Zip Codes with the Highest Percentage of Population Employed in Education Instruction & Library in Lynnwood, WA
RELATED REPORTS & OPTIONS
Education Instruction & Library
Lynnwood
Compare Zip Codes
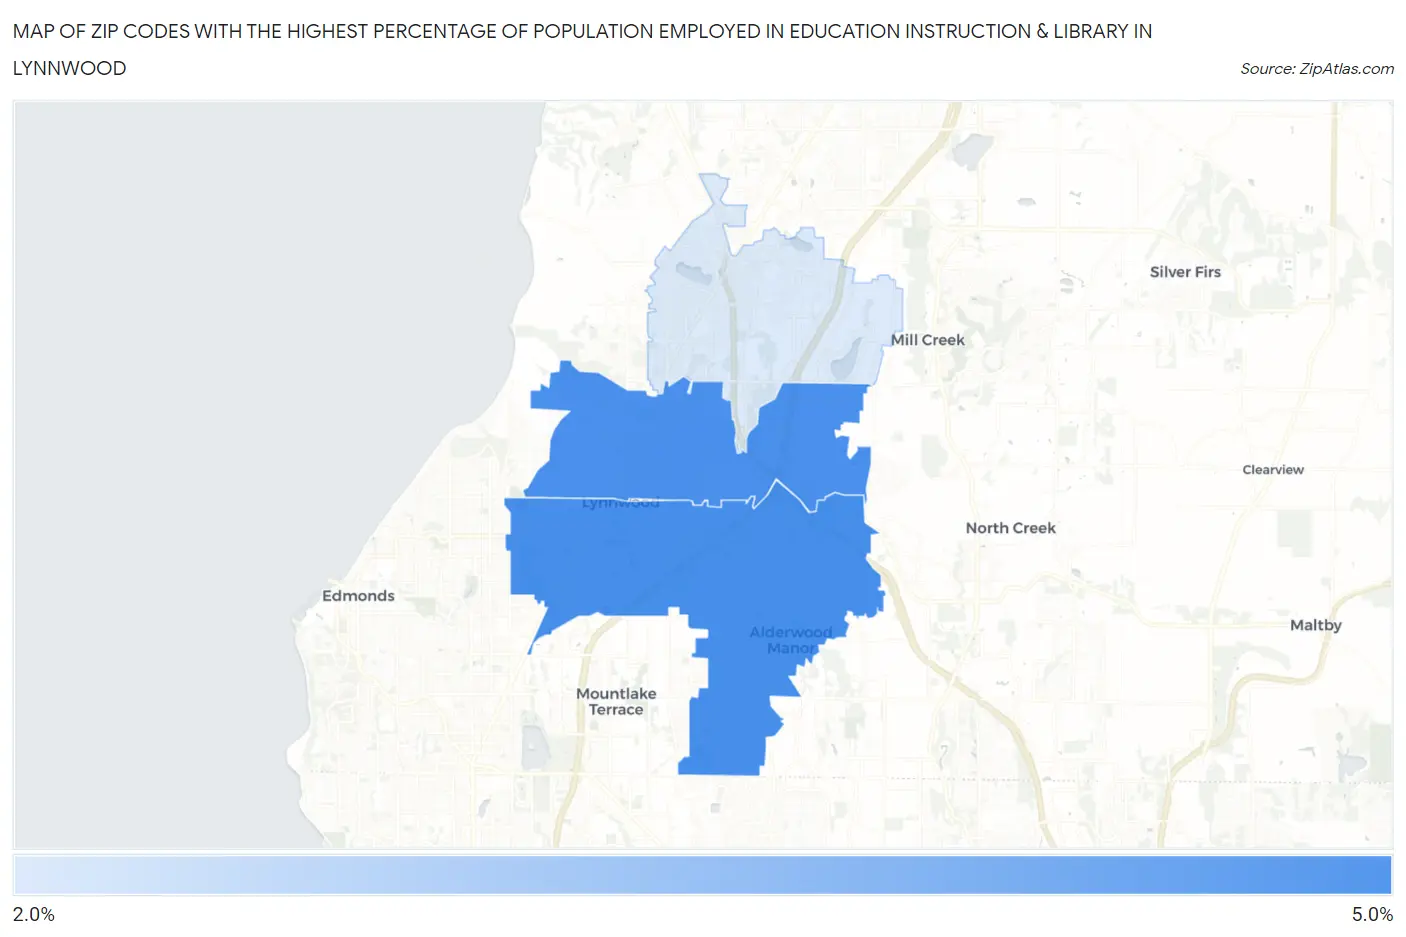
Map of Zip Codes with the Highest Percentage of Population Employed in Education Instruction & Library in Lynnwood
2.7%
4.8%
Zip Codes with the Highest Percentage of Population Employed in Education Instruction & Library in Lynnwood, WA
| Zip Code | % Employed | vs State | vs National | |
| 1. | 98036 | 4.8% | 5.7%(-0.942)#341 | 6.2%(-1.39)#18,517 |
| 2. | 98037 | 4.8% | 5.7%(-0.984)#345 | 6.2%(-1.43)#18,711 |
| 3. | 98087 | 2.7% | 5.7%(-3.05)#484 | 6.2%(-3.49)#25,573 |
1
Common Questions
What are the Top Zip Codes with the Highest Percentage of Population Employed in Education Instruction & Library in Lynnwood, WA?
Top Zip Codes with the Highest Percentage of Population Employed in Education Instruction & Library in Lynnwood, WA are:
What zip code has the Highest Percentage of Population Employed in Education Instruction & Library in Lynnwood, WA?
98036 has the Highest Percentage of Population Employed in Education Instruction & Library in Lynnwood, WA with 4.8%.
What is the Percentage of Population Employed in Education Instruction & Library in Lynnwood, WA?
Percentage of Population Employed in Education Instruction & Library in Lynnwood is 4.5%.
What is the Percentage of Population Employed in Education Instruction & Library in Washington?
Percentage of Population Employed in Education Instruction & Library in Washington is 5.7%.
What is the Percentage of Population Employed in Education Instruction & Library in the United States?
Percentage of Population Employed in Education Instruction & Library in the United States is 6.2%.