Zip Codes with the Highest Percentage of Population Employed in Education Instruction & Library in Kent, WA

RELATED REPORTS & OPTIONS

Education Instruction & Library
Population
Families and Households
Female Fertility
Female Fertility (Unmarried)
Race (Community Size)
Race (Percentage)
Ancestry (Community Size)
AfghanAfricanAmericanArabArgentineanArmenianAustralianAustrianBangladeshiBarbadianBelgianBhutaneseBlackfeetBrazilianBritishBulgarianBurmeseCanadianCentral AmericanCentral American IndianCherokeeChickasawChippewaColombianColvilleCosta RicanCroatianCubanCzechDanishDominicanDutchEastern EuropeanEcuadorianEgyptianEnglishEthiopianEuropeanFijianFilipinoFinnishFrenchFrench American IndianFrench CanadianGermanGhanaianGreekGuamanian / ChamorroGuatemalanHonduranHungarianIcelanderIndian (Asian)IndonesianIranianIraqiIrishItalianJamaicanJapaneseKenyanKoreanLaotianLebaneseLithuanianLuxembourgerMalaysianMexicanMexican American IndianNative HawaiianNavajoNepaleseNicaraguanNigerianNorthern EuropeanNorwegianPakistaniPalestinianPennsylvania GermanPeruvianPolishPortuguesePuerto RicanPuget Sound SalishRomanianRussianSalvadoranSamoanScandinavianScotch-IrishScottishSenegaleseSiouxSlavicSlovakSloveneSomaliSouth AmericanSpaniardSpanishSri LankanSubsaharan AfricanSwedishSwissThaiTlingit-HaidaTonganTurkishUgandanUkrainianVenezuelanWelshWest IndianYakamaYugoslavianYup'ik
Ancestry (Percentage)
AfghanAfricanAmericanArabArgentineanArmenianAustralianAustrianBangladeshiBarbadianBelgianBhutaneseBlackfeetBrazilianBritishBulgarianBurmeseCanadianCentral AmericanCentral American IndianCherokeeChickasawChippewaColombianColvilleCosta RicanCroatianCubanCzechDanishDominicanDutchEastern EuropeanEcuadorianEgyptianEnglishEthiopianEuropeanFijianFilipinoFinnishFrenchFrench American IndianFrench CanadianGermanGhanaianGreekGuamanian / ChamorroGuatemalanHonduranHungarianIcelanderIndian (Asian)IndonesianIranianIraqiIrishItalianJamaicanJapaneseKenyanKoreanLaotianLebaneseLithuanianLuxembourgerMalaysianMexicanMexican American IndianNative HawaiianNavajoNepaleseNicaraguanNigerianNorthern EuropeanNorwegianPakistaniPalestinianPennsylvania GermanPeruvianPolishPortuguesePuerto RicanPuget Sound SalishRomanianRussianSalvadoranSamoanScandinavianScotch-IrishScottishSenegaleseSiouxSlavicSlovakSloveneSomaliSouth AmericanSpaniardSpanishSri LankanSubsaharan AfricanSwedishSwissThaiTlingit-HaidaTonganTurkishUgandanUkrainianVenezuelanWelshWest IndianYakamaYugoslavianYup'ik
Immigrant Origin (Total)
Immigrant Origin (Percentage)
Income
Income (Families)
Income (Households)
Poverty
Poverty (Families)
Unemployment
Employment Occupations
Employment Industries
Employer Class
Commute Time
Commute Means
School Enrollment
Education by Degree Field
Occupancy
Finances
Physical Characteristics
Kent
Compare Zip Codes
Comparison Subject

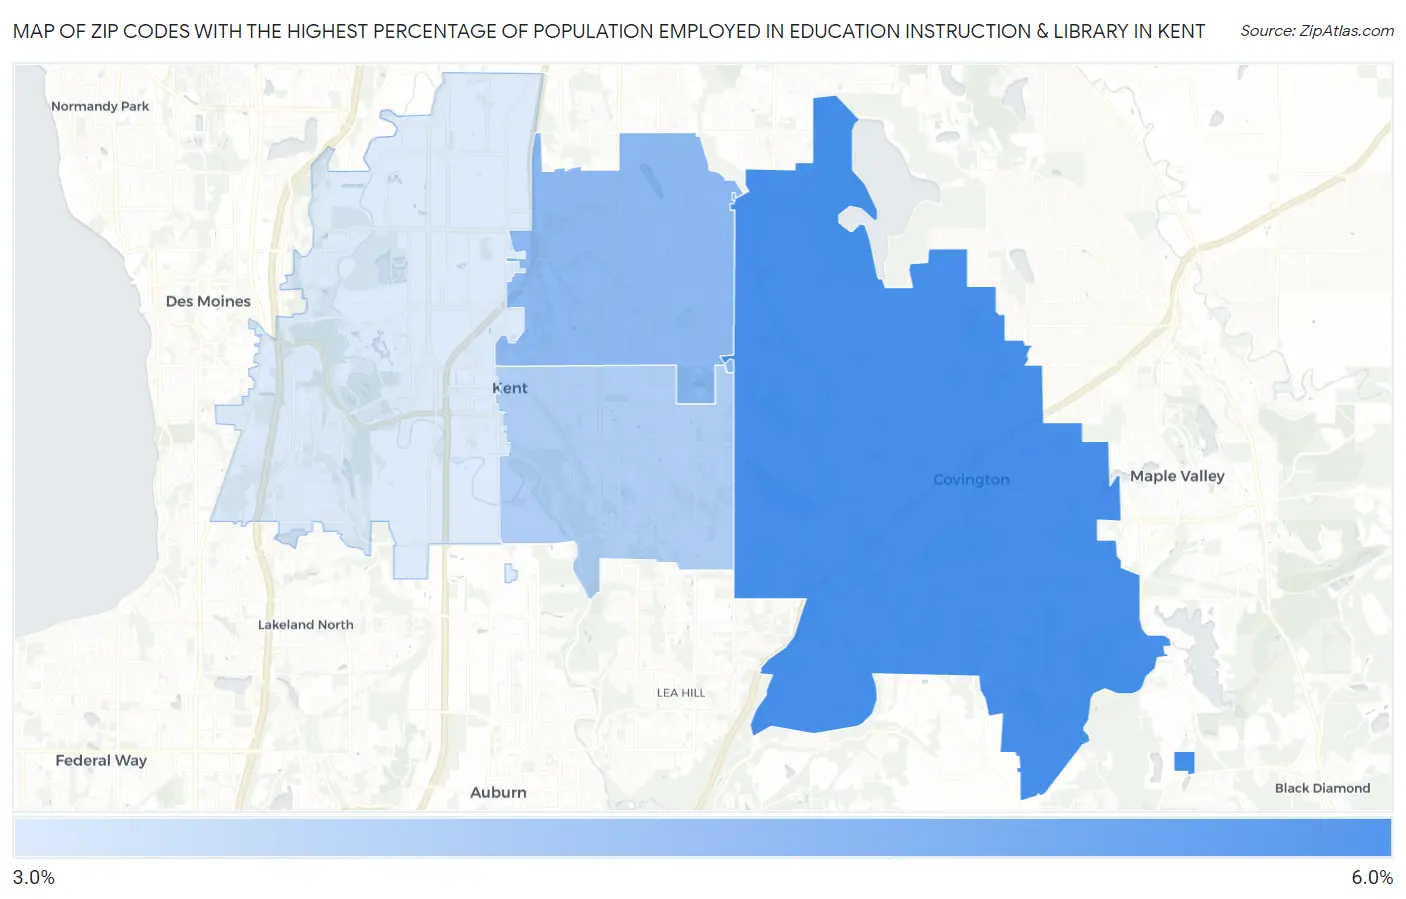
Map of Zip Codes with the Highest Percentage of Population Employed in Education Instruction & Library in Kent

0.0%
6.0%
Zip Codes with the Highest Percentage of Population Employed in Education Instruction & Library in Kent Map

Zip Codes with the Highest Percentage of Population Employed in Education Instruction & Library in Kent, WA

Zip Code % Employed vs State vs National
1.980425.4%5.7%(-0.351)#2936.2%(-0.799)#16,060
2.980314.3%5.7%(-1.40)#3826.2%(-1.85)#20,380
3.980303.8%5.7%(-1.89)#4186.2%(-2.34)#22,249
4.980323.2%5.7%(-2.58)#4646.2%(-3.02)#24,448

Common Questions

What are the Top 3 Zip Codes with the Highest Percentage of Population Employed in Education Instruction & Library in Kent, WA?
Top 3 Zip Codes with the Highest Percentage of Population Employed in Education Instruction & Library in Kent, WA are:
#1
5.4%
#2
4.3%
#3
3.8%
What zip code has the Highest Percentage of Population Employed in Education Instruction & Library in Kent, WA?
98042 has the Highest Percentage of Population Employed in Education Instruction & Library in Kent, WA with 5.4%.
What is the Percentage of Population Employed in Education Instruction & Library in Kent, WA?
Percentage of Population Employed in Education Instruction & Library in Kent is 4.0%.
What is the Percentage of Population Employed in Education Instruction & Library in Washington?
Percentage of Population Employed in Education Instruction & Library in Washington is 5.7%.
What is the Percentage of Population Employed in Education Instruction & Library in the United States?
Percentage of Population Employed in Education Instruction & Library in the United States is 6.2%.