Zip Codes with the Highest Percentage of Population Employed in Transportation & Warehousing in Warrenton, VA
RELATED REPORTS & OPTIONS
Transportation & Warehousing
Warrenton
Compare Zip Codes
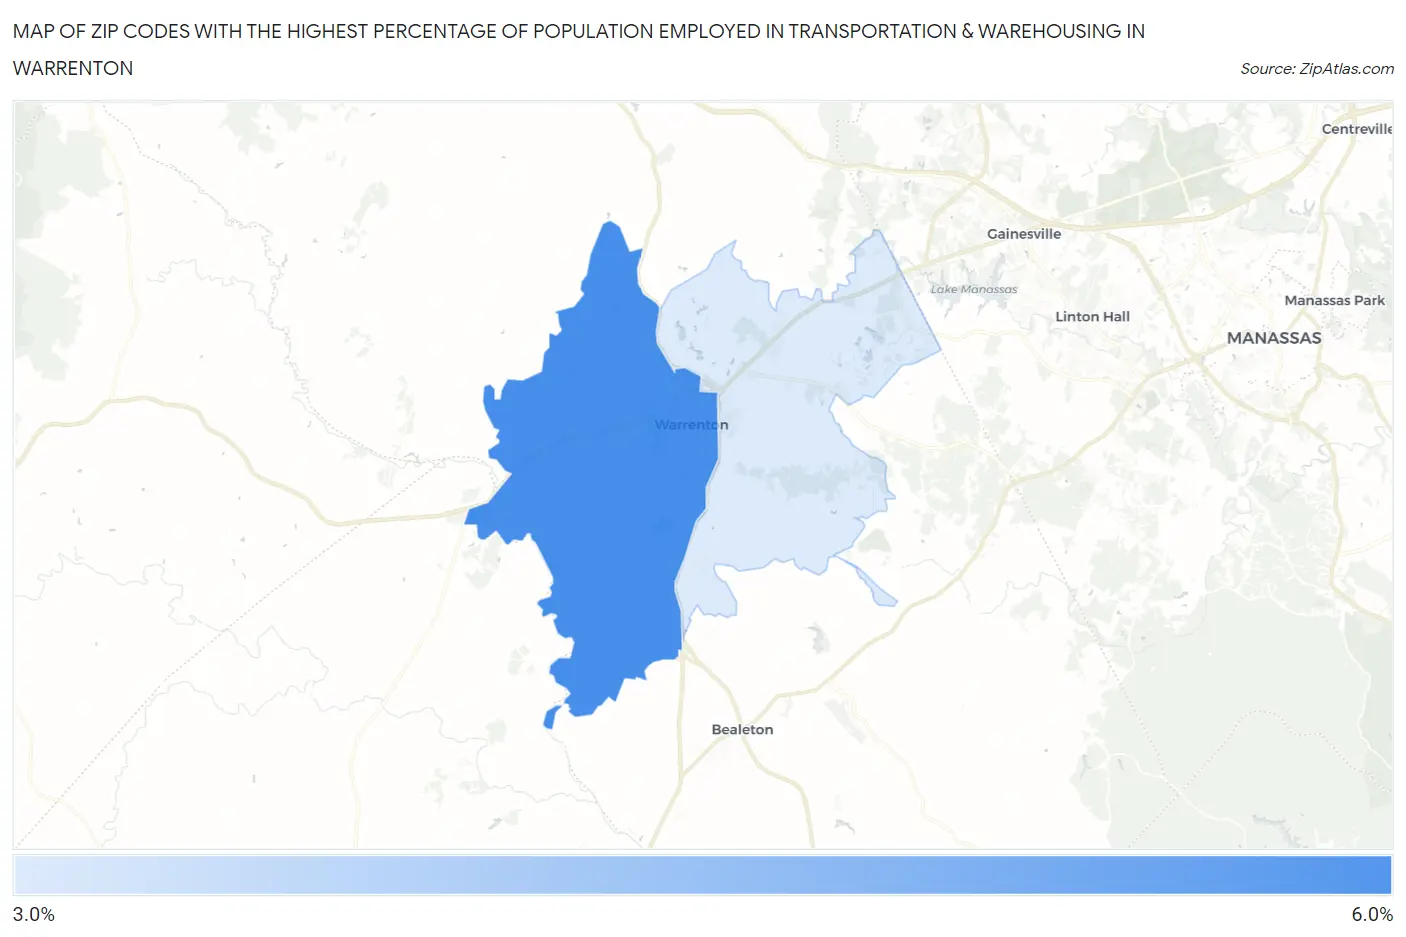
Map of Zip Codes with the Highest Percentage of Population Employed in Transportation & Warehousing in Warrenton
3.8%
5.5%
Zip Codes with the Highest Percentage of Population Employed in Transportation & Warehousing in Warrenton, VA
| Zip Code | % Employed | vs State | vs National | |
| 1. | 20186 | 5.5% | 4.0%(+1.53)#207 | 4.9%(+0.584)#10,155 |
| 2. | 20187 | 3.8% | 4.0%(-0.229)#381 | 4.9%(-1.17)#16,911 |
1
Common Questions
What are the Top Zip Codes with the Highest Percentage of Population Employed in Transportation & Warehousing in Warrenton, VA?
Top Zip Codes with the Highest Percentage of Population Employed in Transportation & Warehousing in Warrenton, VA are:
What zip code has the Highest Percentage of Population Employed in Transportation & Warehousing in Warrenton, VA?
20186 has the Highest Percentage of Population Employed in Transportation & Warehousing in Warrenton, VA with 5.5%.
What is the Percentage of Population Employed in Transportation & Warehousing in Warrenton, VA?
Percentage of Population Employed in Transportation & Warehousing in Warrenton is 5.8%.
What is the Percentage of Population Employed in Transportation & Warehousing in Virginia?
Percentage of Population Employed in Transportation & Warehousing in Virginia is 4.0%.
What is the Percentage of Population Employed in Transportation & Warehousing in the United States?
Percentage of Population Employed in Transportation & Warehousing in the United States is 4.9%.