Zip Codes with the Highest Percentage of Population Employed in Administrative & Support Services in Herndon, VA
RELATED REPORTS & OPTIONS
Administrative & Support Services
Herndon
Compare Zip Codes
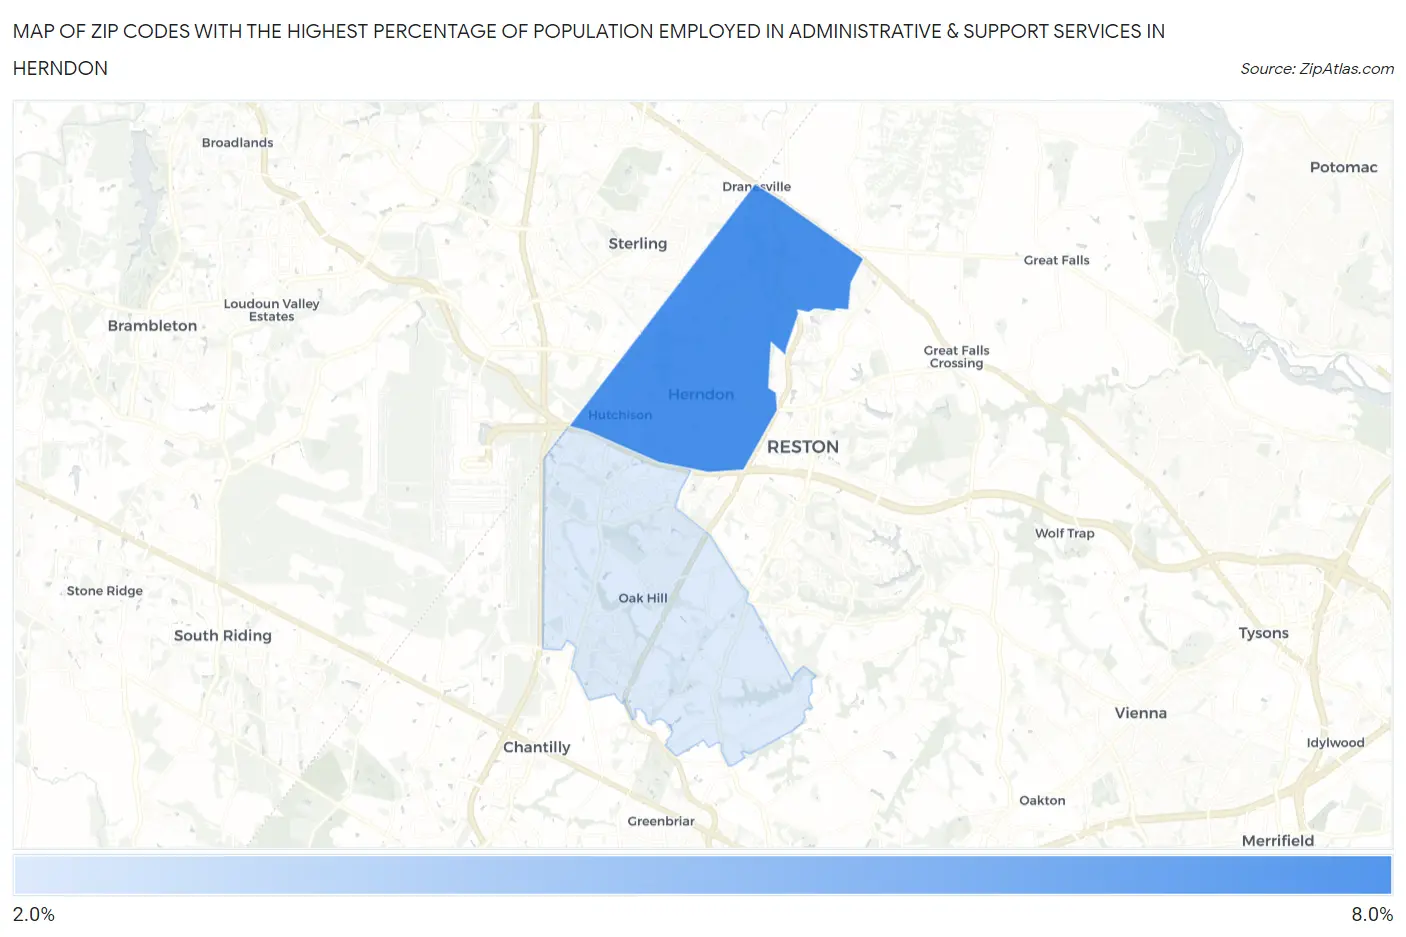
Map of Zip Codes with the Highest Percentage of Population Employed in Administrative & Support Services in Herndon
2.7%
7.0%
Zip Codes with the Highest Percentage of Population Employed in Administrative & Support Services in Herndon, VA
| Zip Code | % Employed | vs State | vs National | |
| 1. | 20170 | 7.0% | 4.1%(+2.86)#118 | 4.1%(+2.84)#3,229 |
| 2. | 20171 | 2.7% | 4.1%(-1.44)#506 | 4.1%(-1.46)#17,114 |
1
Common Questions
What are the Top Zip Codes with the Highest Percentage of Population Employed in Administrative & Support Services in Herndon, VA?
Top Zip Codes with the Highest Percentage of Population Employed in Administrative & Support Services in Herndon, VA are:
What zip code has the Highest Percentage of Population Employed in Administrative & Support Services in Herndon, VA?
20170 has the Highest Percentage of Population Employed in Administrative & Support Services in Herndon, VA with 7.0%.
What is the Percentage of Population Employed in Administrative & Support Services in Herndon, VA?
Percentage of Population Employed in Administrative & Support Services in Herndon is 9.1%.
What is the Percentage of Population Employed in Administrative & Support Services in Virginia?
Percentage of Population Employed in Administrative & Support Services in Virginia is 4.1%.
What is the Percentage of Population Employed in Administrative & Support Services in the United States?
Percentage of Population Employed in Administrative & Support Services in the United States is 4.1%.