Zip Codes with the Highest Percentage of Population with a Degree in Literature and Languages in Provo, UT

RELATED REPORTS & OPTIONS

Literature and Languages
Population
Families and Households
Female Fertility
Female Fertility (Unmarried)
Race (Community Size)
Race (Percentage)
Ancestry (Community Size)
AfricanAmericanArabArgentineanArmenianAustralianAustrianBasqueBhutaneseBlackfeetBolivianBrazilianBritishBurmeseCanadianCentral AmericanCentral American IndianCherokeeChileanChoctawColombianCroatianCubanCzechCzechoslovakianDanishDominicanDutchEastern EuropeanEcuadorianEnglishEuropeanFijianFilipinoFinnishFrenchFrench American IndianFrench CanadianGermanGhanaianGreekGuatemalanHaitianHonduranHungarianIcelanderIndian (Asian)IranianIrishIroquoisIsraeliItalianJamaicanJapaneseKenyanKoreanLaotianLatvianLebaneseLithuanianMalaysianMexicanMexican American IndianNative HawaiianNavajoNicaraguanNigerianNorthern EuropeanNorwegianOkinawanPakistaniPalestinianPeruvianPolishPortuguesePuerto RicanRomanianRussianSalvadoranSamoanScandinavianScotch-IrishScottishSiouxSouth AmericanSouth American IndianSpaniardSpanishSri LankanSubsaharan AfricanSwedishSwissThaiTonganTurkishUkrainianUruguayanVenezuelanWelsh
Ancestry (Percentage)
AfricanAmericanArabArgentineanArmenianAustralianAustrianBasqueBhutaneseBlackfeetBolivianBrazilianBritishBurmeseCanadianCentral AmericanCentral American IndianCherokeeChileanChoctawColombianCroatianCubanCzechCzechoslovakianDanishDominicanDutchEastern EuropeanEcuadorianEnglishEuropeanFijianFilipinoFinnishFrenchFrench American IndianFrench CanadianGermanGhanaianGreekGuatemalanHaitianHonduranHungarianIcelanderIndian (Asian)IranianIrishIroquoisIsraeliItalianJamaicanJapaneseKenyanKoreanLaotianLatvianLebaneseLithuanianMalaysianMexicanMexican American IndianNative HawaiianNavajoNicaraguanNigerianNorthern EuropeanNorwegianOkinawanPakistaniPalestinianPeruvianPolishPortuguesePuerto RicanRomanianRussianSalvadoranSamoanScandinavianScotch-IrishScottishSiouxSouth AmericanSouth American IndianSpaniardSpanishSri LankanSubsaharan AfricanSwedishSwissThaiTonganTurkishUkrainianUruguayanVenezuelanWelsh
Immigrant Origin (Total)
Immigrant Origin (Percentage)
Income
Income (Families)
Income (Households)
Poverty
Poverty (Families)
Unemployment
Employment Occupations
Employment Industries
Employer Class
Commute Time
Commute Means
School Enrollment
Education by Degree Field
Occupancy
Finances
Physical Characteristics
Provo
Compare Zip Codes
Comparison Subject

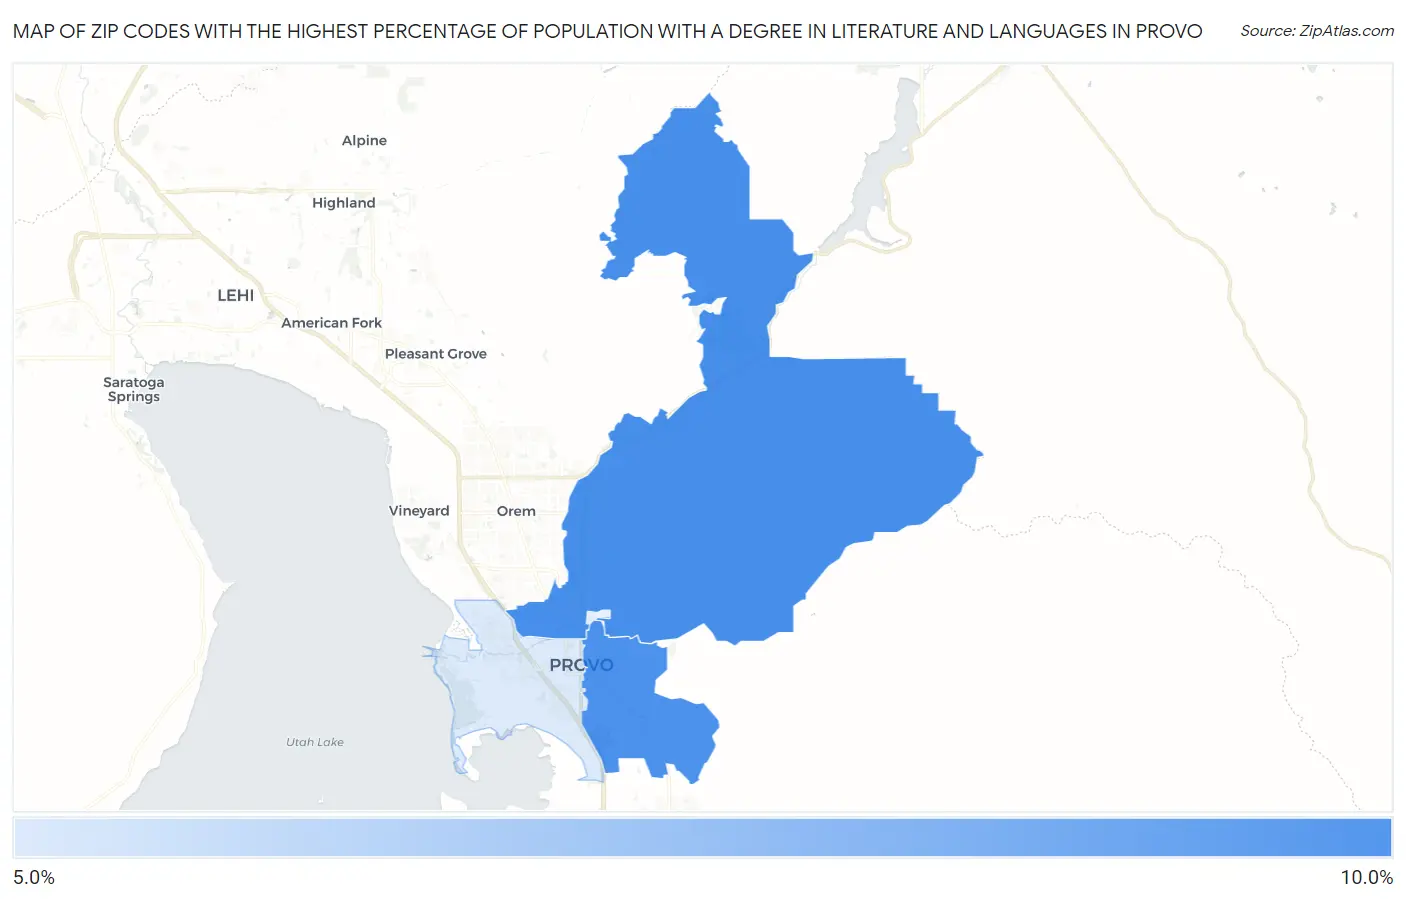
Map of Zip Codes with the Highest Percentage of Population with a Degree in Literature and Languages in Provo

0.0%
10.0%
Zip Codes with the Highest Percentage of Population with a Degree in Literature and Languages in Provo Map

Zip Codes with the Highest Percentage of Population with a Degree in Literature and Languages in Provo, UT

Zip Code % Graduates vs State vs National
1.846049.5%4.8%(+4.74)#284.4%(+5.13)#2,020
2.846069.4%4.8%(+4.60)#294.4%(+4.99)#2,083
3.846015.4%4.8%(+0.633)#694.4%(+1.03)#6,431

Common Questions

What are the Top 3 Zip Codes with the Highest Percentage of Population with a Degree in Literature and Languages in Provo, UT?
Top 3 Zip Codes with the Highest Percentage of Population with a Degree in Literature and Languages in Provo, UT are:
#1
9.5%
#2
9.4%
#3
5.4%
What zip code has the Highest Percentage of Population with a Degree in Literature and Languages in Provo, UT?
84604 has the Highest Percentage of Population with a Degree in Literature and Languages in Provo, UT with 9.5%.
What is the Percentage of Population with a Degree in Literature and Languages in Provo, UT?
Percentage of Population with a Degree in Literature and Languages in Provo is 8.4%.
What is the Percentage of Population with a Degree in Literature and Languages in Utah?
Percentage of Population with a Degree in Literature and Languages in Utah is 4.8%.
What is the Percentage of Population with a Degree in Literature and Languages in the United States?
Percentage of Population with a Degree in Literature and Languages in the United States is 4.4%.