Zip Codes with the Highest Percentage of Population Employed in Sales & Related in Maryville, TN
RELATED REPORTS & OPTIONS
Sales & Related
Maryville
Compare Zip Codes
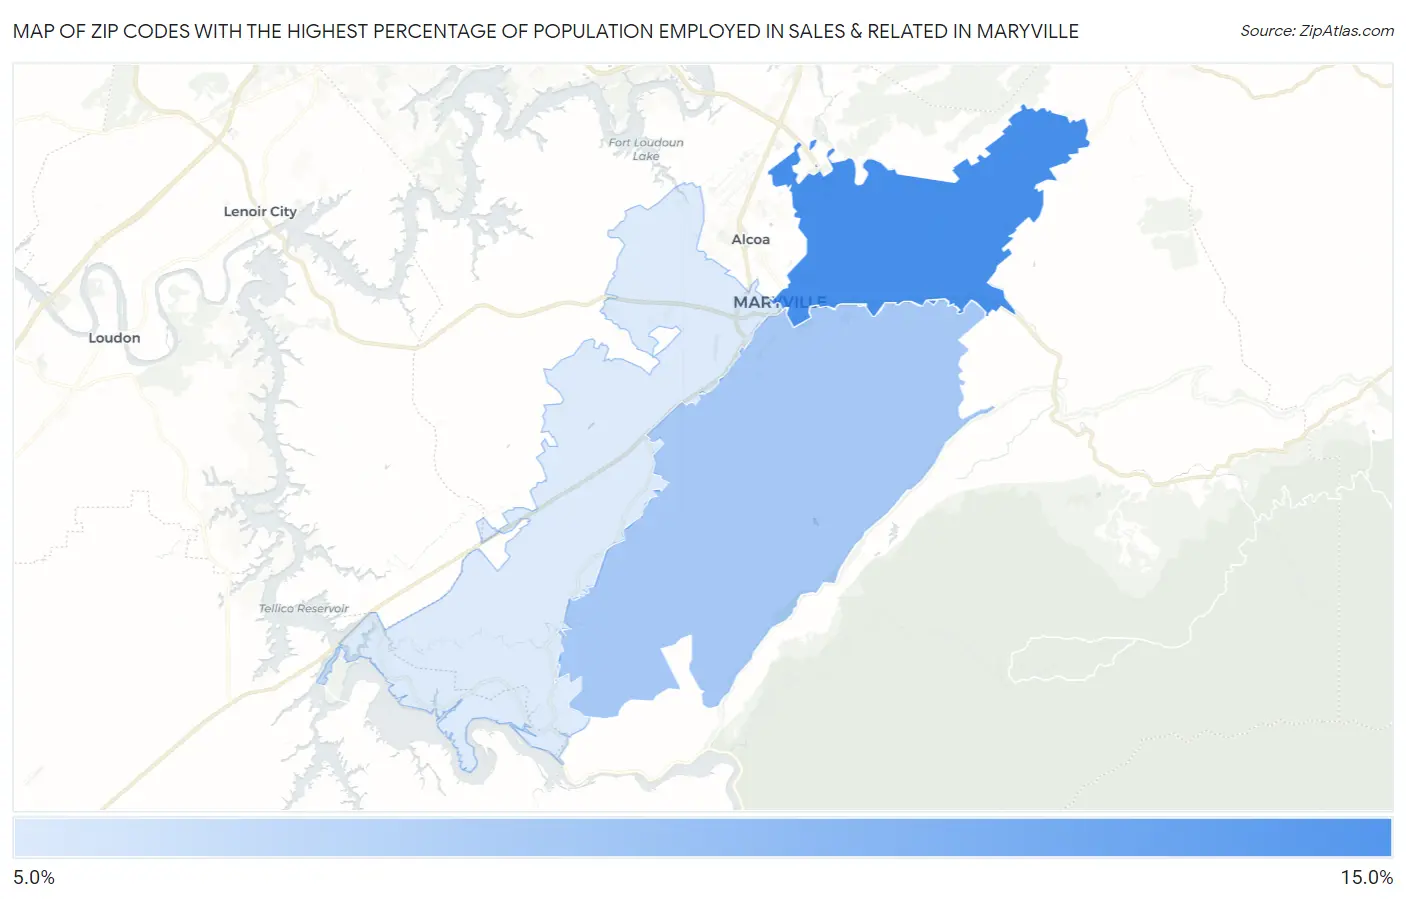
Map of Zip Codes with the Highest Percentage of Population Employed in Sales & Related in Maryville
0.0%
15.0%
Zip Codes with the Highest Percentage of Population Employed in Sales & Related in Maryville, TN
| Zip Code | % Employed | vs State | vs National | |
| 1. | 37804 | 11.6% | 9.8%(+1.72)#132 | 9.6%(+1.96)#6,900 |
| 2. | 37803 | 9.6% | 9.8%(-0.245)#247 | 9.6%(-0.006)#12,431 |
| 3. | 37801 | 8.4% | 9.8%(-1.41)#347 | 9.6%(-1.17)#16,610 |
1
Common Questions
What are the Top Zip Codes with the Highest Percentage of Population Employed in Sales & Related in Maryville, TN?
Top Zip Codes with the Highest Percentage of Population Employed in Sales & Related in Maryville, TN are:
What zip code has the Highest Percentage of Population Employed in Sales & Related in Maryville, TN?
37804 has the Highest Percentage of Population Employed in Sales & Related in Maryville, TN with 11.6%.
What is the Percentage of Population Employed in Sales & Related in Maryville, TN?
Percentage of Population Employed in Sales & Related in Maryville is 9.9%.
What is the Percentage of Population Employed in Sales & Related in Tennessee?
Percentage of Population Employed in Sales & Related in Tennessee is 9.8%.
What is the Percentage of Population Employed in Sales & Related in the United States?
Percentage of Population Employed in Sales & Related in the United States is 9.6%.