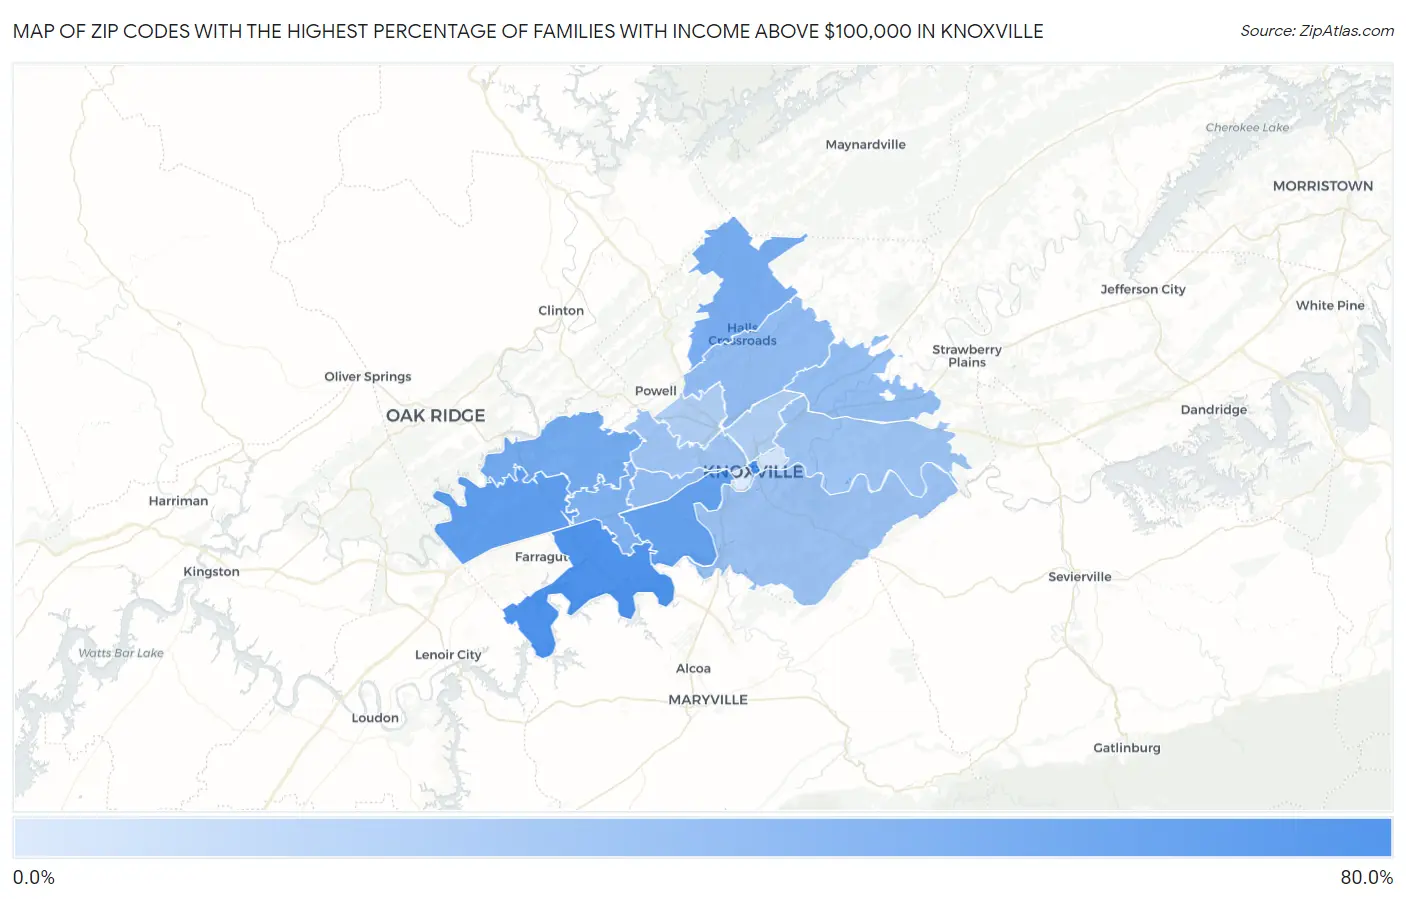
Zip Codes with the Highest Percentage of Families with Income Above $100,000 in Knoxville, TN
RELATED REPORTS & OPTIONS
Family Income | $100k+
Knoxville
Compare Zip Codes
Map of Zip Codes with the Highest Percentage of Families with Income Above $100,000 in Knoxville
7.6%
73.1%
Zip Codes with the Highest Percentage of Families with Income Above $100,000 in Knoxville, TN
| Zip Code | Families with Income > $100k | vs State | vs National | |
| 1. | 37902 | 73.1% | 38.3%(+34.8)#18 | 46.1%(+27.0)#2,027 |
| 2. | 37922 | 68.8% | 38.3%(+30.5)#26 | 46.1%(+22.7)#2,852 |
| 3. | 37932 | 60.2% | 38.3%(+21.9)#40 | 46.1%(+14.1)#5,070 |
| 4. | 37919 | 57.1% | 38.3%(+18.8)#51 | 46.1%(+11.0)#6,060 |
| 5. | 37931 | 49.5% | 38.3%(+11.2)#81 | 46.1%(+3.40)#9,051 |
| 6. | 37938 | 47.5% | 38.3%(+9.20)#96 | 46.1%(+1.40)#10,032 |
| 7. | 37923 | 44.3% | 38.3%(+6.00)#114 | 46.1%(-1.80)#11,743 |
| 8. | 37918 | 36.2% | 38.3%(-2.10)#193 | 46.1%(-9.90)#17,024 |
| 9. | 37909 | 35.6% | 38.3%(-2.70)#201 | 46.1%(-10.5)#17,476 |
| 10. | 37924 | 35.3% | 38.3%(-3.00)#213 | 46.1%(-10.8)#17,683 |
| 11. | 37920 | 33.1% | 38.3%(-5.20)#244 | 46.1%(-13.0)#19,222 |
| 12. | 37914 | 31.5% | 38.3%(-6.80)#265 | 46.1%(-14.6)#20,336 |
| 13. | 37921 | 29.8% | 38.3%(-8.50)#303 | 46.1%(-16.3)#21,547 |
| 14. | 37917 | 23.8% | 38.3%(-14.5)#422 | 46.1%(-22.3)#25,389 |
| 15. | 37912 | 23.5% | 38.3%(-14.8)#427 | 46.1%(-22.6)#25,550 |
| 16. | 37915 | 11.1% | 38.3%(-27.2)#580 | 46.1%(-35.0)#30,133 |
| 17. | 37916 | 7.6% | 38.3%(-30.7)#592 | 46.1%(-38.5)#30,701 |
1
Common Questions
What are the Top 10 Zip Codes with the Highest Percentage of Families with Income Above $100,000 in Knoxville, TN?
Top 10 Zip Codes with the Highest Percentage of Families with Income Above $100,000 in Knoxville, TN are:
What zip code has the Highest Percentage of Families with Income Above $100,000 in Knoxville, TN?
37902 has the Highest Percentage of Families with Income Above $100,000 in Knoxville, TN with 73.1%.
What is the Percentage of Families with Income Above $100,000 in Knoxville, TN?
Percentage of Families with Income Above $100,000 in Knoxville is 30.6%.
What is the Percentage of Families with Income Above $100,000 in Tennessee?
Percentage of Families with Income Above $100,000 in Tennessee is 38.3%.
What is the Percentage of Families with Income Above $100,000 in the United States?
Percentage of Families with Income Above $100,000 in the United States is 46.1%.