Zip Codes with the Highest Percentage of Population with a Degree in Literature and Languages in Knoxville, TN

RELATED REPORTS & OPTIONS

Literature and Languages
Population
Families and Households
Female Fertility
Female Fertility (Unmarried)
Race (Community Size)
Race (Percentage)
Ancestry (Community Size)
AfghanAfricanAlbanianAleutAmericanApacheArabArgentineanArmenianAustralianAustrianBahamianBasqueBelgianBhutaneseBlackfeetBolivianBrazilianBritishBritish West IndianBulgarianBurmeseCajunCanadianCelticCentral AmericanCentral American IndianCherokeeChickasawChileanChippewaChoctawColombianCosta RicanCroatianCubanCzechCzechoslovakianDanishDelawareDominicanDutchDutch West IndianEastern EuropeanEcuadorianEgyptianEnglishEstonianEthiopianEuropeanFilipinoFinnishFrenchFrench American IndianFrench CanadianGermanGhanaianGreekGuatemalanGuyaneseHaitianHonduranHungarianIcelanderIndian (Asian)IndonesianInupiatIranianIraqiIrishIroquoisIsraeliItalianJamaicanJapaneseJordanianKoreanLaotianLatvianLebaneseLithuanianLumbeeLuxembourgerMalaysianMalteseMexicanMexican American IndianMongolianNative HawaiianNavajoNicaraguanNigerianNorthern EuropeanNorwegianPakistaniPalestinianPanamanianPennsylvania GermanPeruvianPolishPortuguesePotawatomiPuerto RicanRomanianRussianSalvadoranSamoanScandinavianScotch-IrishScottishSeminoleSerbianSiouxSlavicSlovakSloveneSomaliSouth AfricanSouth AmericanSpaniardSpanishSri LankanSubsaharan AfricanSwedishSwissSyrianThaiTurkishUkrainianVenezuelanWelshWest IndianYugoslavian
Ancestry (Percentage)
AfghanAfricanAlbanianAleutAmericanApacheArabArgentineanArmenianAustralianAustrianBahamianBasqueBelgianBhutaneseBlackfeetBolivianBrazilianBritishBritish West IndianBulgarianBurmeseCajunCanadianCelticCentral AmericanCentral American IndianCherokeeChickasawChileanChippewaChoctawColombianCosta RicanCroatianCubanCzechCzechoslovakianDanishDelawareDominicanDutchDutch West IndianEastern EuropeanEcuadorianEgyptianEnglishEstonianEthiopianEuropeanFilipinoFinnishFrenchFrench American IndianFrench CanadianGermanGhanaianGreekGuatemalanGuyaneseHaitianHonduranHungarianIcelanderIndian (Asian)IndonesianInupiatIranianIraqiIrishIroquoisIsraeliItalianJamaicanJapaneseJordanianKoreanLaotianLatvianLebaneseLithuanianLumbeeLuxembourgerMalaysianMalteseMexicanMexican American IndianMongolianNative HawaiianNavajoNicaraguanNigerianNorthern EuropeanNorwegianPakistaniPalestinianPanamanianPennsylvania GermanPeruvianPolishPortuguesePotawatomiPuerto RicanRomanianRussianSalvadoranSamoanScandinavianScotch-IrishScottishSeminoleSerbianSiouxSlavicSlovakSloveneSomaliSouth AfricanSouth AmericanSpaniardSpanishSri LankanSubsaharan AfricanSwedishSwissSyrianThaiTurkishUkrainianVenezuelanWelshWest IndianYugoslavian
Immigrant Origin (Total)
AfghanistanAfricaArgentinaAsiaAustraliaBangladeshBoliviaBosnia and HerzegovinaBrazilBulgariaBurma / MyanmarCambodiaCameroonCanadaCaribbeanCentral AmericaChileChinaColombiaCongoCosta RicaCubaCzechoslovakiaDominican RepublicEastern AfricaEastern AsiaEastern EuropeEcuadorEgyptEl SalvadorEnglandEthiopiaEuropeFranceGermanyGhanaGreeceGuatemalaHaitiHondurasHong KongIndiaIndonesiaIranIraqIrelandIsraelItalyJamaicaJapanJordanKazakhstanKenyaKoreaKuwaitLatin AmericaLebanonLiberiaMalaysiaMexicoMiddle AfricaMoldovaMoroccoNepalNicaraguaNigeriaNorthern AfricaNorthern EuropeOceaniaPakistanPanamaPeruPhilippinesPolandRomaniaRussiaSaudi ArabiaScotlandSenegalSouth AfricaSouth AmericaSouth Central AsiaSouth Eastern AsiaSouthern EuropeSri LankaSudanTaiwanThailandTurkeyUkraineUzbekistanVenezuelaVietnamWestern AfricaWestern AsiaWestern EuropeZaireZimbabwe
Immigrant Origin (Percentage)
AfghanistanAfricaArgentinaAsiaAustraliaBangladeshBoliviaBosnia and HerzegovinaBrazilBulgariaBurma / MyanmarCambodiaCameroonCanadaCaribbeanCentral AmericaChileChinaColombiaCongoCosta RicaCubaCzechoslovakiaDominican RepublicEastern AfricaEastern AsiaEastern EuropeEcuadorEgyptEl SalvadorEnglandEthiopiaEuropeFranceGermanyGhanaGreeceGuatemalaHaitiHondurasHong KongIndiaIndonesiaIranIraqIrelandIsraelItalyJamaicaJapanJordanKazakhstanKenyaKoreaKuwaitLatin AmericaLebanonLiberiaMalaysiaMexicoMiddle AfricaMoldovaMoroccoNepalNicaraguaNigeriaNorthern AfricaNorthern EuropeOceaniaPakistanPanamaPeruPhilippinesPolandRomaniaRussiaSaudi ArabiaScotlandSenegalSouth AfricaSouth AmericaSouth Central AsiaSouth Eastern AsiaSouthern EuropeSri LankaSudanTaiwanThailandTurkeyUkraineUzbekistanVenezuelaVietnamWestern AfricaWestern AsiaWestern EuropeZaireZimbabwe
Income
Income (Families)
Income (Households)
Poverty
Poverty (Families)
Unemployment
Employment Occupations
Employment Industries
Employer Class
Commute Time
Commute Means
School Enrollment
Education by Degree Field
Occupancy
Finances
Physical Characteristics
Knoxville
Compare Zip Codes
Comparison Subject

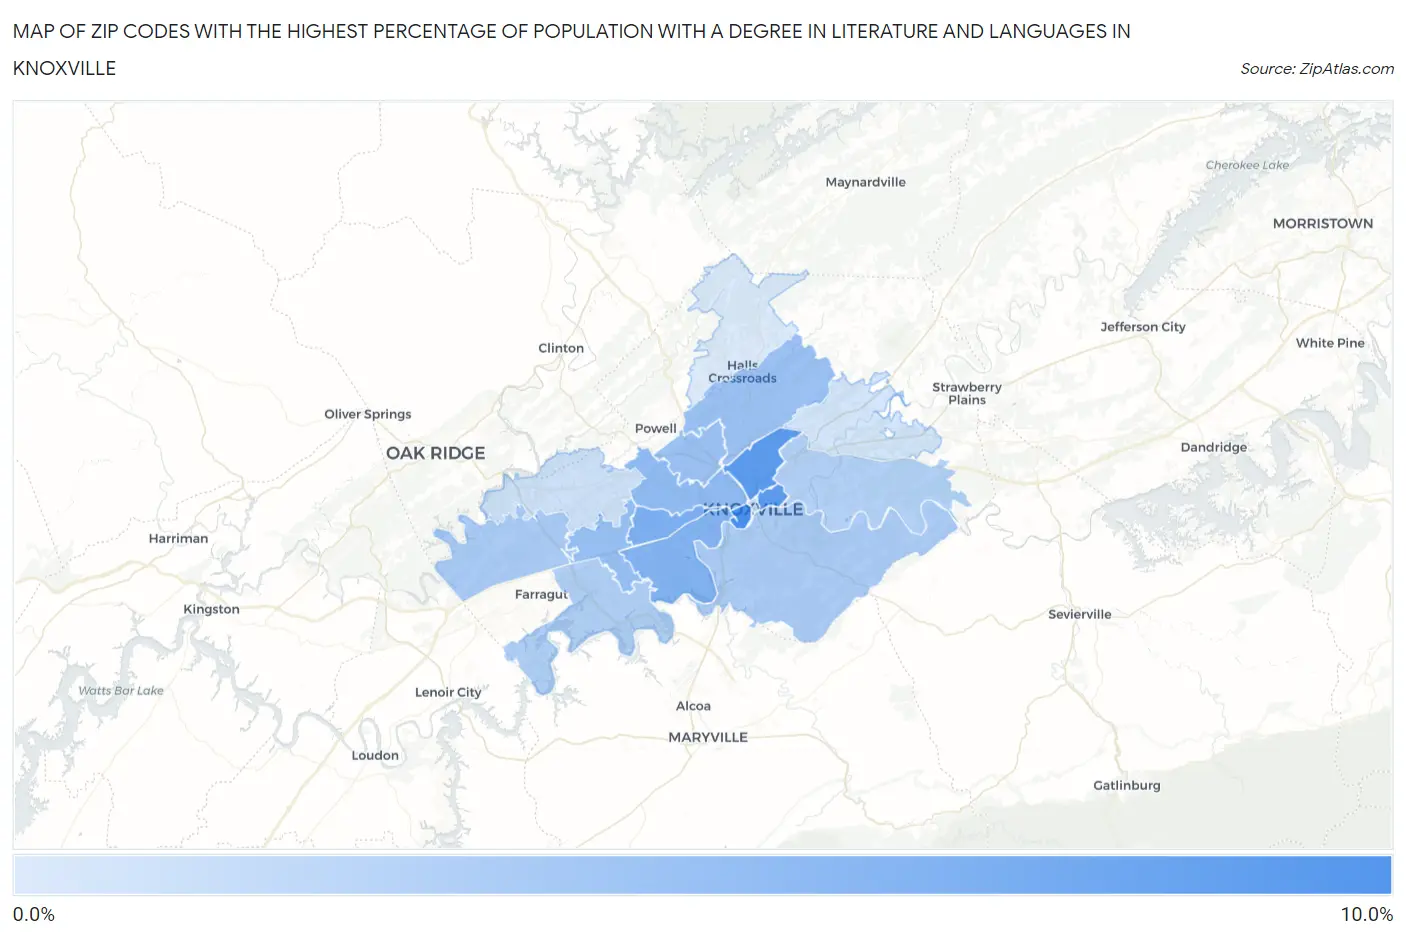
Map of Zip Codes with the Highest Percentage of Population with a Degree in Literature and Languages in Knoxville

0.0%
10.0%
Zip Codes with the Highest Percentage of Population with a Degree in Literature and Languages in Knoxville Map

Zip Codes with the Highest Percentage of Population with a Degree in Literature and Languages in Knoxville, TN

Zip Code % Graduates vs State vs National
1.379168.8%3.6%(+5.20)#324.4%(+4.40)#2,413
2.379157.9%3.6%(+4.26)#394.4%(+3.46)#3,090
3.379177.7%3.6%(+4.13)#424.4%(+3.33)#3,212
4.379095.8%3.6%(+2.24)#834.4%(+1.44)#5,683
5.379195.6%3.6%(+2.04)#894.4%(+1.24)#6,034
6.379214.9%3.6%(+1.29)#1174.4%(+0.494)#7,614
7.379234.6%3.6%(+0.938)#1284.4%(+0.141)#8,568
8.379124.4%3.6%(+0.775)#1424.4%(-0.023)#9,032
9.379184.3%3.6%(+0.669)#1484.4%(-0.129)#9,368
10.379323.6%3.6%(-0.009)#1734.4%(-0.807)#11,484
11.379203.5%3.6%(-0.107)#1834.4%(-0.904)#11,839
12.379223.2%3.6%(-0.411)#2084.4%(-1.21)#12,913
13.379143.1%3.6%(-0.498)#2124.4%(-1.30)#13,170
14.379022.8%3.6%(-0.804)#2344.4%(-1.60)#14,234
15.379311.8%3.6%(-1.85)#3124.4%(-2.65)#17,825
16.379241.5%3.6%(-2.09)#3314.4%(-2.89)#18,606
17.379381.0%3.6%(-2.57)#3634.4%(-3.37)#20,024

Common Questions

What are the Top 10 Zip Codes with the Highest Percentage of Population with a Degree in Literature and Languages in Knoxville, TN?
Top 10 Zip Codes with the Highest Percentage of Population with a Degree in Literature and Languages in Knoxville, TN are:
#1
8.8%
#2
7.9%
#3
7.7%
#4
5.8%
#5
5.6%
#6
4.9%
#7
4.6%
#8
4.4%
#9
4.3%
#10
3.6%
What zip code has the Highest Percentage of Population with a Degree in Literature and Languages in Knoxville, TN?
37916 has the Highest Percentage of Population with a Degree in Literature and Languages in Knoxville, TN with 8.8%.
What is the Percentage of Population with a Degree in Literature and Languages in Knoxville, TN?
Percentage of Population with a Degree in Literature and Languages in Knoxville is 5.8%.
What is the Percentage of Population with a Degree in Literature and Languages in Tennessee?
Percentage of Population with a Degree in Literature and Languages in Tennessee is 3.6%.
What is the Percentage of Population with a Degree in Literature and Languages in the United States?
Percentage of Population with a Degree in Literature and Languages in the United States is 4.4%.