Zip Codes with the Highest Percentage of Population Employed in Arts, Entertainment & Recreation in Chattanooga, TN
RELATED REPORTS & OPTIONS
Arts, Entertainment & Recreation
Chattanooga
Compare Zip Codes
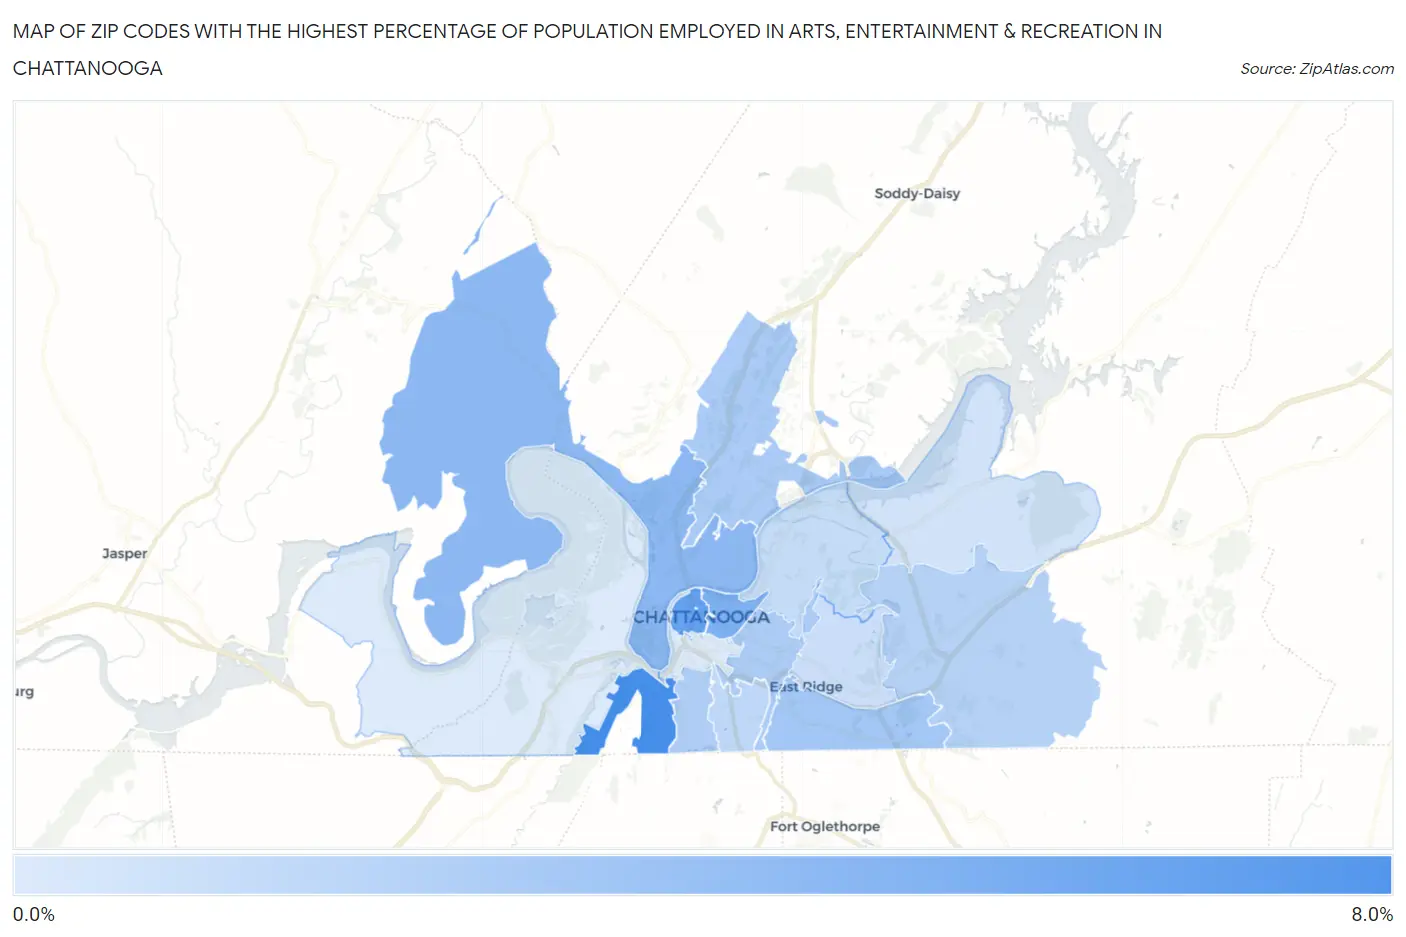
Map of Zip Codes with the Highest Percentage of Population Employed in Arts, Entertainment & Recreation in Chattanooga
0.0%
8.0%
Zip Codes with the Highest Percentage of Population Employed in Arts, Entertainment & Recreation in Chattanooga, TN
| Zip Code | % Employed | vs State | vs National | |
| 1. | 37409 | 7.2% | 1.8%(+5.43)#18 | 2.1%(+5.13)#1,261 |
| 2. | 37402 | 5.8% | 1.8%(+4.06)#26 | 2.1%(+3.76)#1,780 |
| 3. | 37403 | 4.6% | 1.8%(+2.85)#37 | 2.1%(+2.55)#2,599 |
| 4. | 37405 | 4.0% | 1.8%(+2.22)#46 | 2.1%(+1.93)#3,320 |
| 5. | 37412 | 2.9% | 1.8%(+1.10)#83 | 2.1%(+0.809)#5,676 |
| 6. | 37415 | 2.6% | 1.8%(+0.812)#98 | 2.1%(+0.517)#6,758 |
| 7. | 37404 | 2.5% | 1.8%(+0.732)#100 | 2.1%(+0.437)#7,087 |
| 8. | 37410 | 2.4% | 1.8%(+0.591)#117 | 2.1%(+0.296)#7,748 |
| 9. | 37421 | 2.0% | 1.8%(+0.253)#135 | 2.1%(-0.042)#9,551 |
| 10. | 37407 | 1.6% | 1.8%(-0.143)#169 | 2.1%(-0.438)#12,126 |
| 11. | 37406 | 1.3% | 1.8%(-0.482)#227 | 2.1%(-0.777)#14,685 |
| 12. | 37411 | 1.2% | 1.8%(-0.612)#250 | 2.1%(-0.907)#15,662 |
| 13. | 37416 | 0.83% | 1.8%(-0.957)#312 | 2.1%(-1.25)#18,193 |
| 14. | 37419 | 0.31% | 1.8%(-1.48)#406 | 2.1%(-1.77)#21,642 |
| 15. | 37408 | 0.30% | 1.8%(-1.48)#408 | 2.1%(-1.78)#21,705 |
1
Common Questions
What are the Top 10 Zip Codes with the Highest Percentage of Population Employed in Arts, Entertainment & Recreation in Chattanooga, TN?
Top 10 Zip Codes with the Highest Percentage of Population Employed in Arts, Entertainment & Recreation in Chattanooga, TN are:
What zip code has the Highest Percentage of Population Employed in Arts, Entertainment & Recreation in Chattanooga, TN?
37409 has the Highest Percentage of Population Employed in Arts, Entertainment & Recreation in Chattanooga, TN with 7.2%.
What is the Percentage of Population Employed in Arts, Entertainment & Recreation in Chattanooga, TN?
Percentage of Population Employed in Arts, Entertainment & Recreation in Chattanooga is 2.4%.
What is the Percentage of Population Employed in Arts, Entertainment & Recreation in Tennessee?
Percentage of Population Employed in Arts, Entertainment & Recreation in Tennessee is 1.8%.
What is the Percentage of Population Employed in Arts, Entertainment & Recreation in the United States?
Percentage of Population Employed in Arts, Entertainment & Recreation in the United States is 2.1%.