Zip Codes with the Highest Percentage of Households Residing in Condos/Apartments in Chattanooga, TN

RELATED REPORTS & OPTIONS

Condo/Apartment Residency
Population
Families and Households
Female Fertility
Female Fertility (Unmarried)
Race (Community Size)
Race (Percentage)
Ancestry (Community Size)
AfricanAmericanArabArgentineanArmenianAustralianAustrianBelgianBhutaneseBlackfeetBrazilianBritishBurmeseCajunCanadianCelticCentral AmericanCherokeeChileanChippewaChoctawColombianCreekCroatianCubanCzechCzechoslovakianDanishDominicanDutchDutch West IndianEastern EuropeanEgyptianEnglishEthiopianEuropeanFilipinoFinnishFrenchFrench American IndianFrench CanadianGermanGreekGuamanian / ChamorroGuatemalanHaitianHonduranHungarianIcelanderIndian (Asian)IranianIrishIsraeliItalianJamaicanJapaneseKoreanLaotianLebaneseLithuanianLuxembourgerMalaysianMalteseMexicanMexican American IndianMoroccanNative HawaiianNew ZealanderNicaraguanNigerianNorthern EuropeanNorwegianPakistaniPalestinianPanamanianPennsylvania GermanPeruvianPolishPortuguesePuerto RicanRomanianRussianSalvadoranSamoanScandinavianScotch-IrishScottishSerbianSiouxSlovakSloveneSouth AfricanSouth AmericanSpaniardSpanishSri LankanSubsaharan AfricanSudaneseSwedishSwissSyrianThaiTurkishUkrainianUruguayanVenezuelanWelshYugoslavian
Ancestry (Percentage)
AfricanAmericanArabArgentineanArmenianAustralianAustrianBelgianBhutaneseBlackfeetBrazilianBritishBurmeseCajunCanadianCelticCentral AmericanCherokeeChileanChippewaChoctawColombianCreekCroatianCubanCzechCzechoslovakianDanishDominicanDutchDutch West IndianEastern EuropeanEgyptianEnglishEthiopianEuropeanFilipinoFinnishFrenchFrench American IndianFrench CanadianGermanGreekGuamanian / ChamorroGuatemalanHaitianHonduranHungarianIcelanderIndian (Asian)IranianIrishIsraeliItalianJamaicanJapaneseKoreanLaotianLebaneseLithuanianLuxembourgerMalaysianMalteseMexicanMexican American IndianMoroccanNative HawaiianNew ZealanderNicaraguanNigerianNorthern EuropeanNorwegianPakistaniPalestinianPanamanianPennsylvania GermanPeruvianPolishPortuguesePuerto RicanRomanianRussianSalvadoranSamoanScandinavianScotch-IrishScottishSerbianSiouxSlovakSloveneSouth AfricanSouth AmericanSpaniardSpanishSri LankanSubsaharan AfricanSudaneseSwedishSwissSyrianThaiTurkishUkrainianUruguayanVenezuelanWelshYugoslavian
Immigrant Origin (Total)
Immigrant Origin (Percentage)
Income
Income (Families)
Income (Households)
Poverty
Poverty (Families)
Unemployment
Employment Occupations
Employment Industries
Employer Class
Commute Time
Commute Means
School Enrollment
Education by Degree Field
Occupancy
Finances
Physical Characteristics
Chattanooga
Compare Zip Codes
Comparison Subject

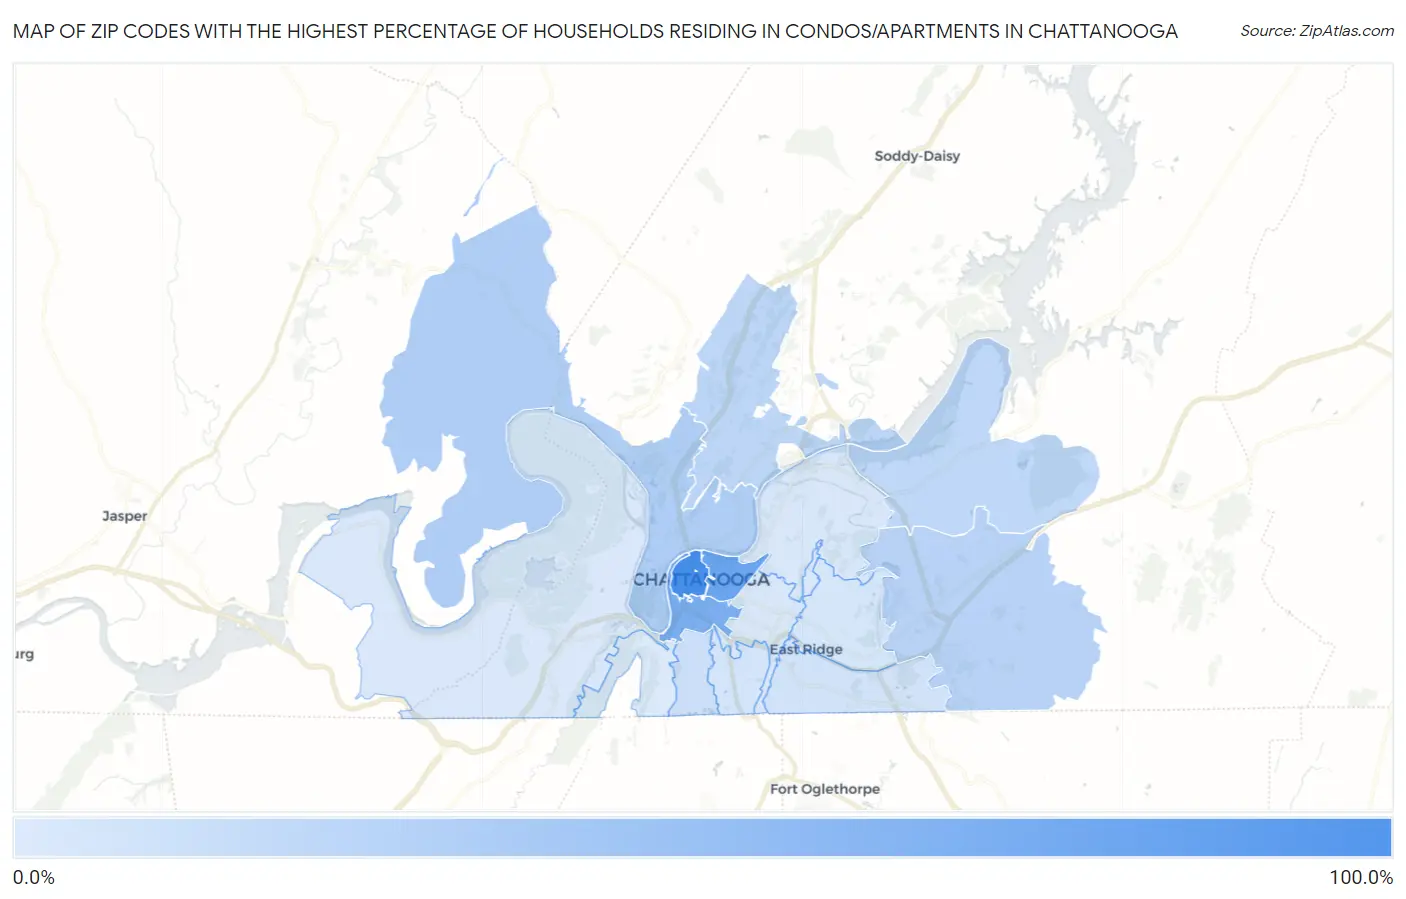
Map of Zip Codes with the Highest Percentage of Households Residing in Condos/Apartments in Chattanooga

0.0%
100.0%
Zip Codes with the Highest Percentage of Households Residing in Condos/Apartments in Chattanooga Map

Zip Codes with the Highest Percentage of Households Residing in Condos/Apartments in Chattanooga, TN

Zip Code Detached Home Residency vs State vs National
1.3740280.2%8.5%(+71.7)#613.8%(+66.4)#240
2.3740357.7%8.5%(+49.2)#1013.8%(+43.9)#474
3.3740848.2%8.5%(+39.7)#1113.8%(+34.4)#619
4.3740522.9%8.5%(+14.4)#2913.8%(+9.10)#1,995
5.3742118.7%8.5%(+10.2)#3213.8%(+4.90)#2,688
6.3741517.0%8.5%(+8.50)#3913.8%(+3.20)#3,031
7.3741615.7%8.5%(+7.20)#4313.8%(+1.90)#3,398
8.3741010.1%8.5%(+1.60)#6913.8%(-3.70)#5,467
9.374128.1%8.5%(-0.400)#8713.8%(-5.70)#6,615
10.374077.2%8.5%(-1.30)#9413.8%(-6.60)#7,240
11.374116.4%8.5%(-2.10)#10413.8%(-7.40)#7,881
12.374065.6%8.5%(-2.90)#11513.8%(-8.20)#8,599
13.374045.5%8.5%(-3.00)#11713.8%(-8.30)#8,698
14.374194.6%8.5%(-3.90)#12813.8%(-9.20)#9,559
15.374094.0%8.5%(-4.50)#13413.8%(-9.80)#10,247

Common Questions

What are the Top 10 Zip Codes with the Highest Percentage of Households Residing in Condos/Apartments in Chattanooga, TN?
Top 10 Zip Codes with the Highest Percentage of Households Residing in Condos/Apartments in Chattanooga, TN are:
#1
80.2%
#2
57.7%
#3
48.2%
#4
22.9%
#5
18.7%
#6
17.0%
#7
15.7%
#8
10.1%
#9
8.1%
#10
7.2%
What zip code has the Highest Percentage of Households Residing in Condos/Apartments in Chattanooga, TN?
37402 has the Highest Percentage of Households Residing in Condos/Apartments in Chattanooga, TN with 80.2%.
What is the Percentage of Households Residing in Condos/Apartments in Chattanooga, TN?
Percentage of Households Residing in Condos/Apartments in Chattanooga is 18.5%.
What is the Percentage of Households Residing in Condos/Apartments in Tennessee?
Percentage of Households Residing in Condos/Apartments in Tennessee is 8.5%.
What is the Percentage of Households Residing in Condos/Apartments in the United States?
Percentage of Households Residing in Condos/Apartments in the United States is 13.8%.