Zip Codes with the Highest Percentage of Population Employed in Agriculture, Fishing & Hunting in Simpsonville, SC
RELATED REPORTS & OPTIONS
Agriculture, Fishing & Hunting
Simpsonville
Compare Zip Codes
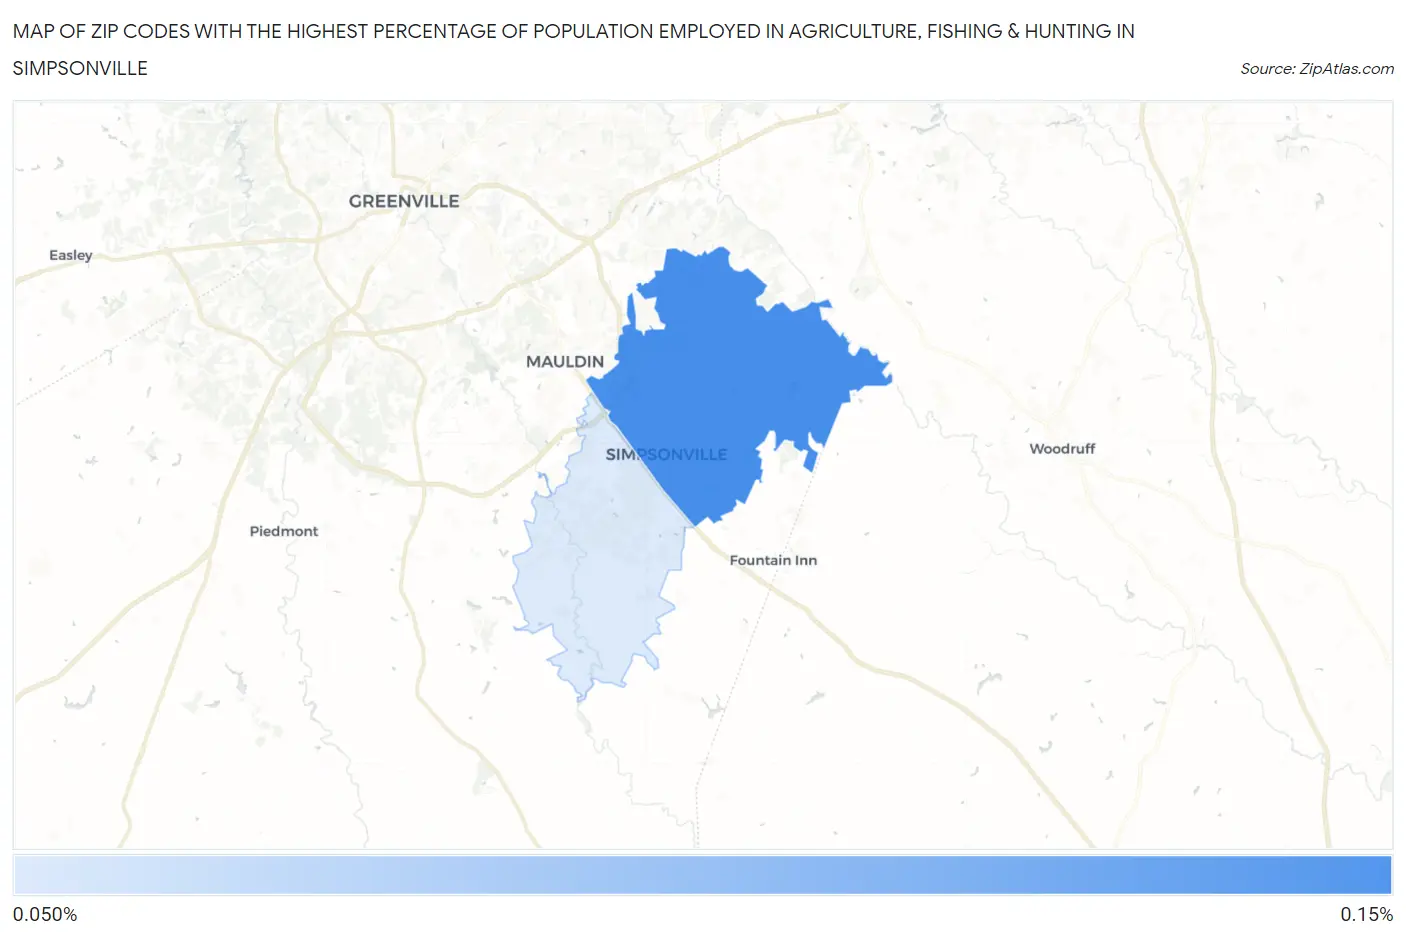
Map of Zip Codes with the Highest Percentage of Population Employed in Agriculture, Fishing & Hunting in Simpsonville
0.0%
0.15%
Zip Codes with the Highest Percentage of Population Employed in Agriculture, Fishing & Hunting in Simpsonville, SC
| Zip Code | % Employed | vs State | vs National | |
| 1. | 29681 | 0.12% | 0.78%(-0.662)#296 | 1.2%(-1.08)#23,467 |
| 2. | 29680 | 0.11% | 0.78%(-0.667)#298 | 1.2%(-1.09)#23,532 |
1
Common Questions
What are the Top Zip Codes with the Highest Percentage of Population Employed in Agriculture, Fishing & Hunting in Simpsonville, SC?
Top Zip Codes with the Highest Percentage of Population Employed in Agriculture, Fishing & Hunting in Simpsonville, SC are:
What zip code has the Highest Percentage of Population Employed in Agriculture, Fishing & Hunting in Simpsonville, SC?
29681 has the Highest Percentage of Population Employed in Agriculture, Fishing & Hunting in Simpsonville, SC with 0.12%.
What is the Percentage of Population Employed in Agriculture, Fishing & Hunting in Simpsonville, SC?
Percentage of Population Employed in Agriculture, Fishing & Hunting in Simpsonville is 0.16%.
What is the Percentage of Population Employed in Agriculture, Fishing & Hunting in South Carolina?
Percentage of Population Employed in Agriculture, Fishing & Hunting in South Carolina is 0.78%.
What is the Percentage of Population Employed in Agriculture, Fishing & Hunting in the United States?
Percentage of Population Employed in Agriculture, Fishing & Hunting in the United States is 1.2%.