Zip Codes with the Highest Percentage of Population Employed in Arts, Entertainment & Recreation in North Augusta, SC
RELATED REPORTS & OPTIONS
Arts, Entertainment & Recreation
North Augusta
Compare Zip Codes
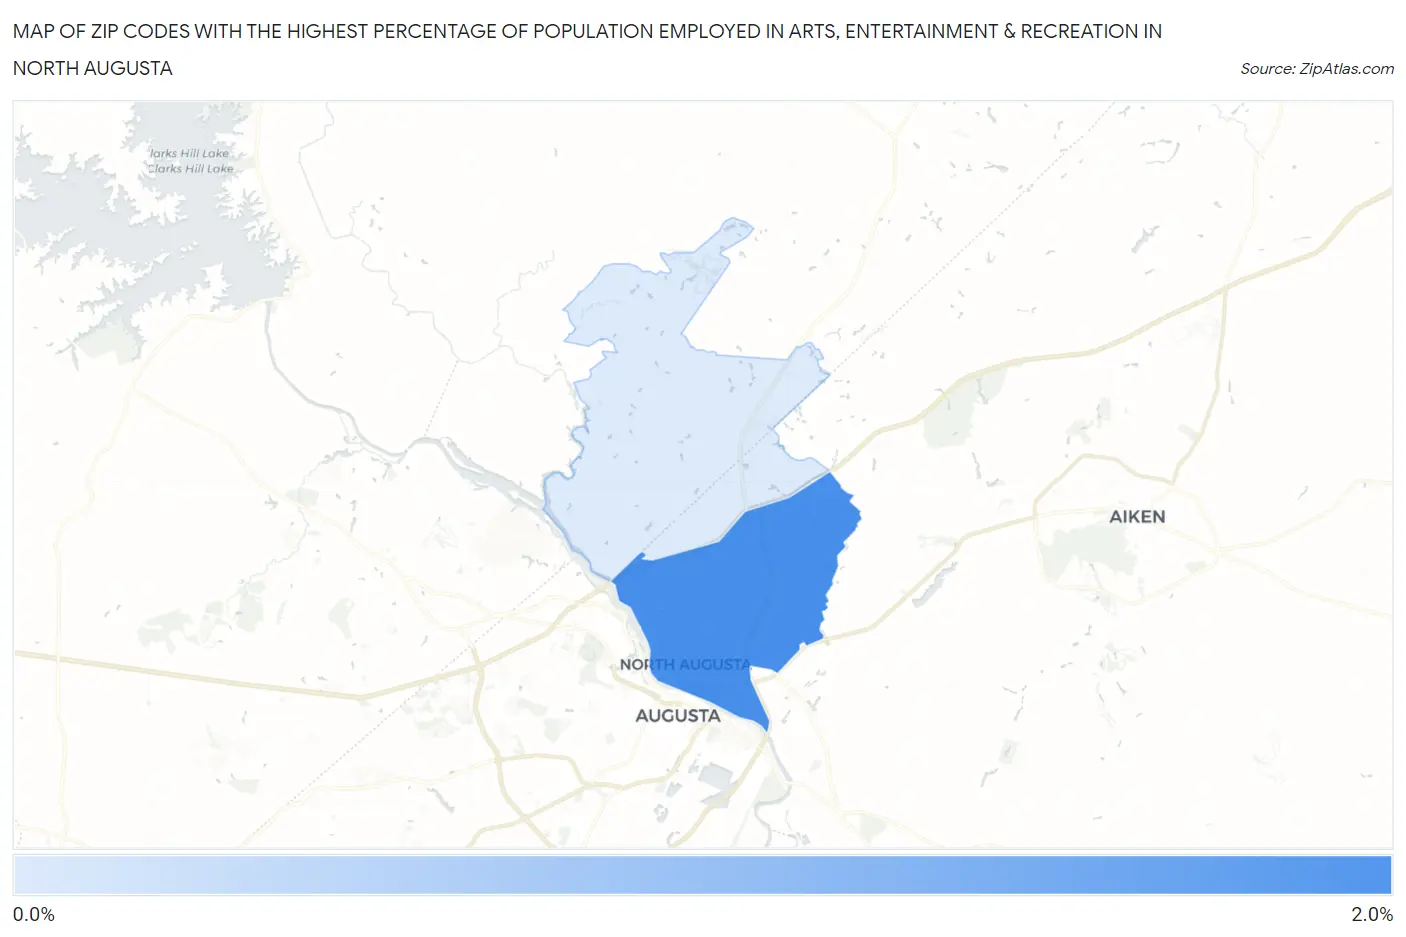
Map of Zip Codes with the Highest Percentage of Population Employed in Arts, Entertainment & Recreation in North Augusta
0.0%
2.0%
Zip Codes with the Highest Percentage of Population Employed in Arts, Entertainment & Recreation in North Augusta, SC
| Zip Code | % Employed | vs State | vs National | |
| 1. | 29841 | 1.6% | 1.8%(-0.144)#135 | 2.1%(-0.467)#12,333 |
| 2. | 29860 | 0.75% | 1.8%(-1.01)#236 | 2.1%(-1.34)#18,784 |
1
Common Questions
What are the Top Zip Codes with the Highest Percentage of Population Employed in Arts, Entertainment & Recreation in North Augusta, SC?
Top Zip Codes with the Highest Percentage of Population Employed in Arts, Entertainment & Recreation in North Augusta, SC are:
What zip code has the Highest Percentage of Population Employed in Arts, Entertainment & Recreation in North Augusta, SC?
29841 has the Highest Percentage of Population Employed in Arts, Entertainment & Recreation in North Augusta, SC with 1.6%.
What is the Percentage of Population Employed in Arts, Entertainment & Recreation in North Augusta, SC?
Percentage of Population Employed in Arts, Entertainment & Recreation in North Augusta is 2.1%.
What is the Percentage of Population Employed in Arts, Entertainment & Recreation in South Carolina?
Percentage of Population Employed in Arts, Entertainment & Recreation in South Carolina is 1.8%.
What is the Percentage of Population Employed in Arts, Entertainment & Recreation in the United States?
Percentage of Population Employed in Arts, Entertainment & Recreation in the United States is 2.1%.