Zip Codes with the Highest Percentage of Population Employed in Arts, Entertainment & Recreation in Mount Pleasant, SC
RELATED REPORTS & OPTIONS
Arts, Entertainment & Recreation
Mount Pleasant
Compare Zip Codes
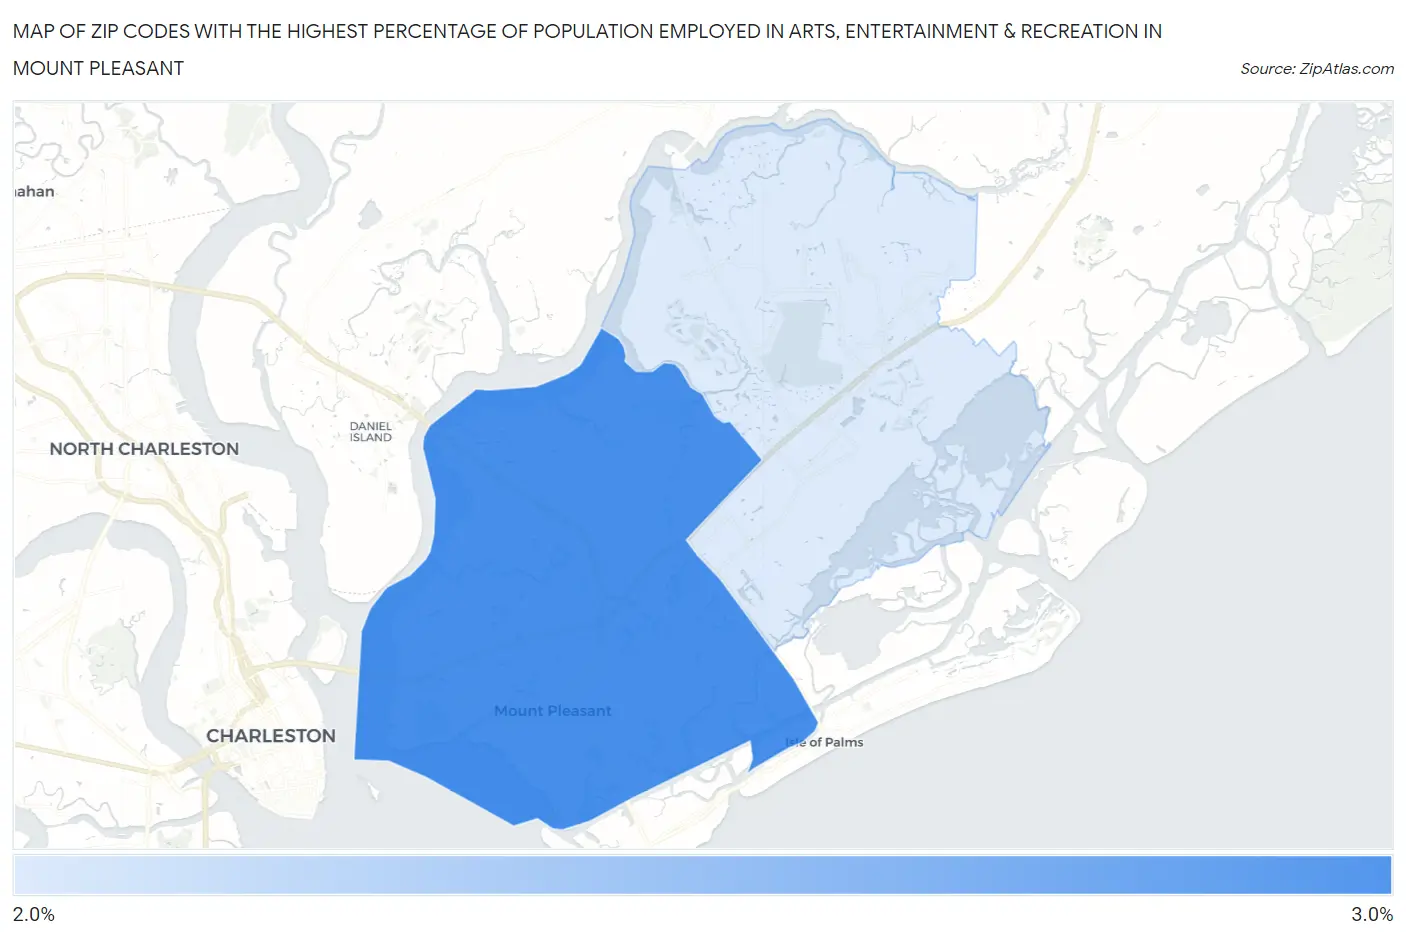
Map of Zip Codes with the Highest Percentage of Population Employed in Arts, Entertainment & Recreation in Mount Pleasant
2.4%
2.6%
Zip Codes with the Highest Percentage of Population Employed in Arts, Entertainment & Recreation in Mount Pleasant, SC
| Zip Code | % Employed | vs State | vs National | |
| 1. | 29464 | 2.6% | 1.8%(+0.823)#72 | 2.1%(+0.501)#6,829 |
| 2. | 29466 | 2.4% | 1.8%(+0.667)#79 | 2.1%(+0.344)#7,524 |
1
Common Questions
What are the Top Zip Codes with the Highest Percentage of Population Employed in Arts, Entertainment & Recreation in Mount Pleasant, SC?
Top Zip Codes with the Highest Percentage of Population Employed in Arts, Entertainment & Recreation in Mount Pleasant, SC are:
What zip code has the Highest Percentage of Population Employed in Arts, Entertainment & Recreation in Mount Pleasant, SC?
29464 has the Highest Percentage of Population Employed in Arts, Entertainment & Recreation in Mount Pleasant, SC with 2.6%.
What is the Percentage of Population Employed in Arts, Entertainment & Recreation in Mount Pleasant, SC?
Percentage of Population Employed in Arts, Entertainment & Recreation in Mount Pleasant is 2.6%.
What is the Percentage of Population Employed in Arts, Entertainment & Recreation in South Carolina?
Percentage of Population Employed in Arts, Entertainment & Recreation in South Carolina is 1.8%.
What is the Percentage of Population Employed in Arts, Entertainment & Recreation in the United States?
Percentage of Population Employed in Arts, Entertainment & Recreation in the United States is 2.1%.