Zip Codes with the Highest Percentage of Population Employed in Life, Physical & Social Science in Mount Pleasant, SC
RELATED REPORTS & OPTIONS
Life, Physical & Social Science
Mount Pleasant
Compare Zip Codes
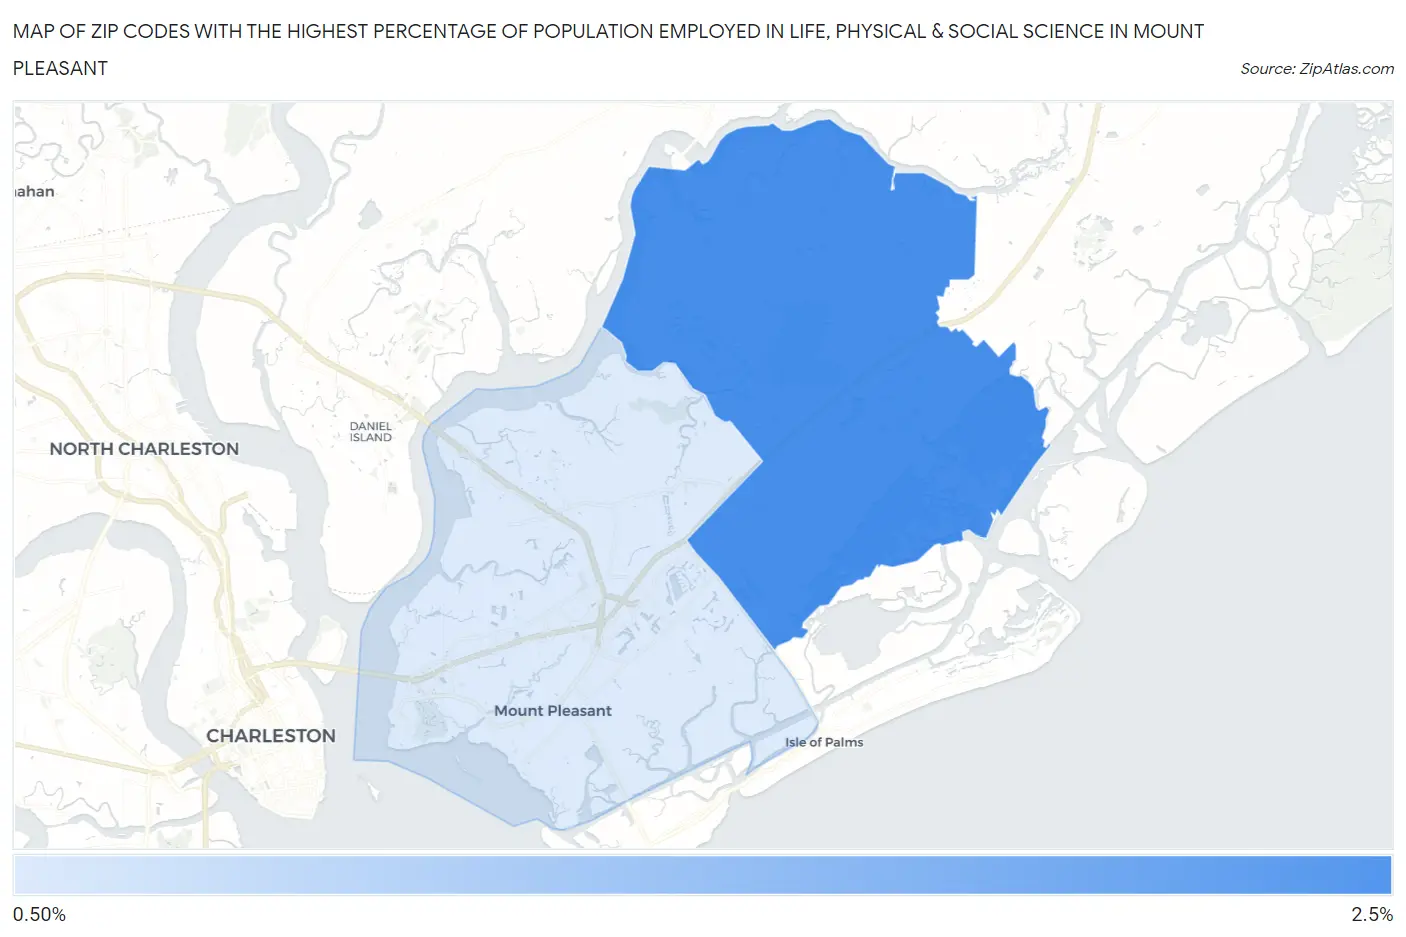
Map of Zip Codes with the Highest Percentage of Population Employed in Life, Physical & Social Science in Mount Pleasant
1.4%
2.2%
Zip Codes with the Highest Percentage of Population Employed in Life, Physical & Social Science in Mount Pleasant, SC
| Zip Code | % Employed | vs State | vs National | |
| 1. | 29466 | 2.2% | 0.73%(+1.44)#17 | 1.1%(+1.08)#3,256 |
| 2. | 29464 | 1.4% | 0.73%(+0.697)#56 | 1.1%(+0.333)#6,065 |
1
Common Questions
What are the Top Zip Codes with the Highest Percentage of Population Employed in Life, Physical & Social Science in Mount Pleasant, SC?
Top Zip Codes with the Highest Percentage of Population Employed in Life, Physical & Social Science in Mount Pleasant, SC are:
What zip code has the Highest Percentage of Population Employed in Life, Physical & Social Science in Mount Pleasant, SC?
29466 has the Highest Percentage of Population Employed in Life, Physical & Social Science in Mount Pleasant, SC with 2.2%.
What is the Percentage of Population Employed in Life, Physical & Social Science in Mount Pleasant, SC?
Percentage of Population Employed in Life, Physical & Social Science in Mount Pleasant is 1.8%.
What is the Percentage of Population Employed in Life, Physical & Social Science in South Carolina?
Percentage of Population Employed in Life, Physical & Social Science in South Carolina is 0.73%.
What is the Percentage of Population Employed in Life, Physical & Social Science in the United States?
Percentage of Population Employed in Life, Physical & Social Science in the United States is 1.1%.