Zip Codes with the Highest Percentage of Population Employed in Farming, Fishing & Forestry in Genesee, PA
RELATED REPORTS & OPTIONS
Farming, Fishing & Forestry
Genesee
Compare Zip Codes
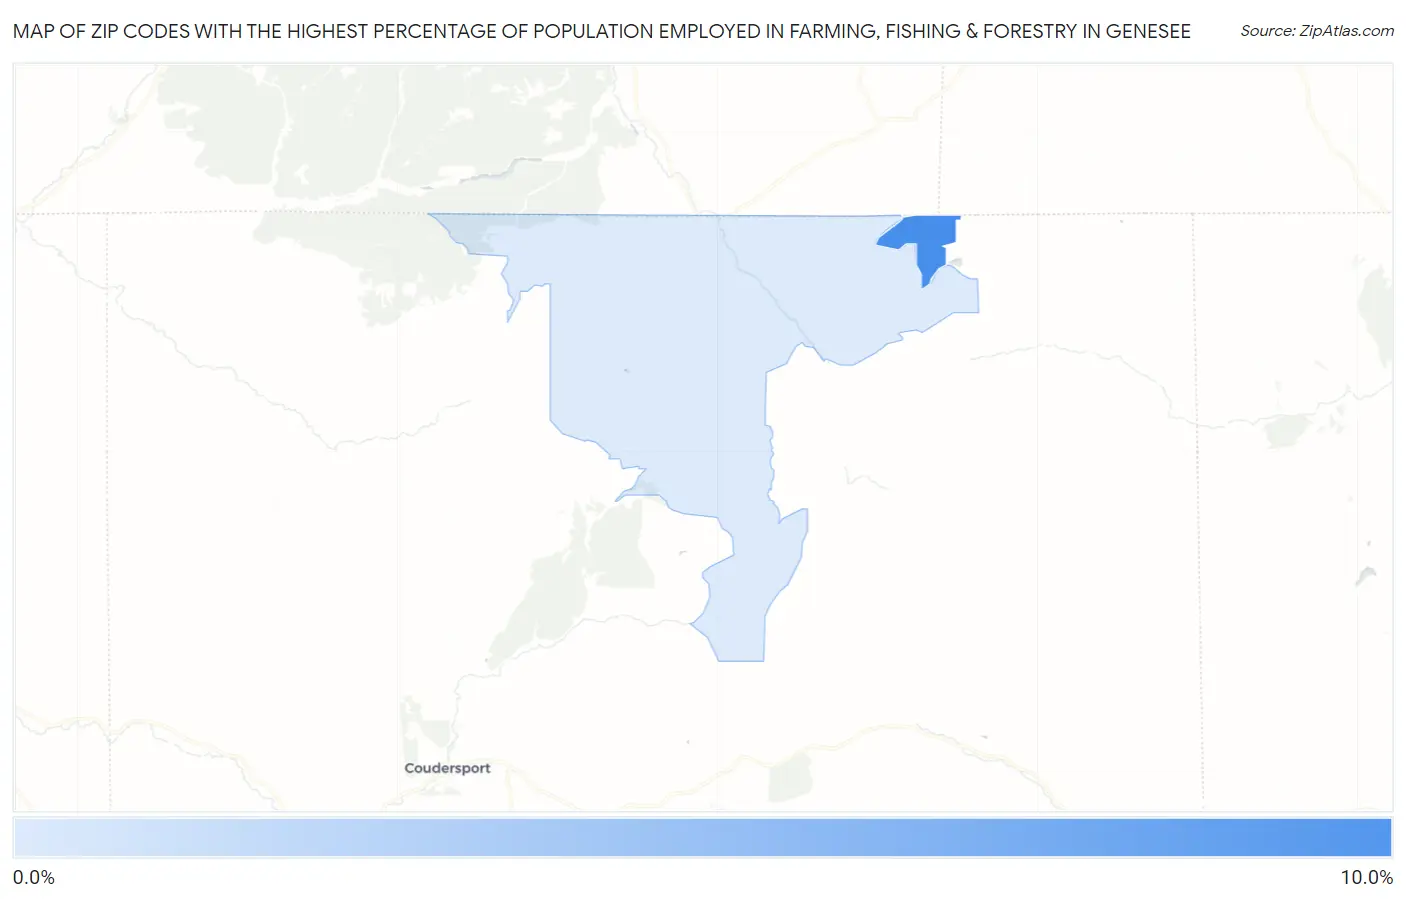
Map of Zip Codes with the Highest Percentage of Population Employed in Farming, Fishing & Forestry in Genesee
0.0%
10.0%
Zip Codes with the Highest Percentage of Population Employed in Farming, Fishing & Forestry in Genesee, PA
| Zip Code | % Employed | vs State | vs National | |
| 1. | 16941 | 8.8% | 0.41%(+8.42)#19 | 0.61%(+8.22)#1,450 |
| 2. | 16923 | 1.0% | 0.41%(+0.594)#347 | 0.61%(+0.394)#9,740 |
1
Common Questions
What are the Top Zip Codes with the Highest Percentage of Population Employed in Farming, Fishing & Forestry in Genesee, PA?
Top Zip Codes with the Highest Percentage of Population Employed in Farming, Fishing & Forestry in Genesee, PA are:
What zip code has the Highest Percentage of Population Employed in Farming, Fishing & Forestry in Genesee, PA?
16941 has the Highest Percentage of Population Employed in Farming, Fishing & Forestry in Genesee, PA with 8.8%.
What is the Percentage of Population Employed in Farming, Fishing & Forestry in Pennsylvania?
Percentage of Population Employed in Farming, Fishing & Forestry in Pennsylvania is 0.41%.
What is the Percentage of Population Employed in Farming, Fishing & Forestry in the United States?
Percentage of Population Employed in Farming, Fishing & Forestry in the United States is 0.61%.