Zip Codes with the Highest Percentage of Population Employed in Sales & Related in Las Vegas, NV

RELATED REPORTS & OPTIONS

Sales & Related
Population
Families and Households
Female Fertility
Female Fertility (Unmarried)
Race (Community Size)
Race (Percentage)
Ancestry (Community Size)
AfghanAfricanAlaska NativeAlbanianAleutAmericanApacheArabArapahoArgentineanArmenianAssyrian / Chaldean / SyriacAustralianAustrianBangladeshiBarbadianBasqueBelgianBelizeanBhutaneseBlackfeetBolivianBrazilianBritishBritish West IndianBulgarianBurmeseCajunCambodianCanadianCape VerdeanCelticCentral AmericanCentral American IndianCherokeeCheyenneChickasawChileanChineseChippewaChoctawColombianComancheCosta RicanCreeCreekCroatianCubanCzechCzechoslovakianDanishDelawareDominicanDutchDutch West IndianEastern EuropeanEcuadorianEgyptianEnglishEstonianEthiopianEuropeanFijianFilipinoFinnishFrenchFrench American IndianFrench CanadianGermanGerman RussianGhanaianGreekGuamanian / ChamorroGuatemalanGuyaneseHaitianHonduranHopiHungarianIcelanderIndian (Asian)IndonesianInupiatIranianIraqiIrishIroquoisIsraeliItalianJamaicanJapaneseJordanianKenyanKoreanLaotianLatvianLebaneseLiberianLithuanianLuxembourgerMacedonianMalaysianMalteseMenomineeMexicanMexican American IndianMongolianMoroccanNative HawaiianNavajoNew ZealanderNicaraguanNigerianNorthern EuropeanNorwegianOkinawanOsagePaiutePakistaniPalestinianPanamanianParaguayanPennsylvania GermanPeruvianPimaPolishPortuguesePotawatomiPuebloPuerto RicanPuget Sound SalishRomanianRussianSalvadoranSamoanScandinavianScotch-IrishScottishSeminoleSenegaleseSerbianShoshoneSierra LeoneanSiouxSlavicSlovakSloveneSomaliSouth AfricanSouth AmericanSouth American IndianSoviet UnionSpaniardSpanishSpanish AmericanSpanish American IndianSri LankanSubsaharan AfricanSudaneseSwedishSwissSyrianThaiTlingit-HaidaTohono O'OdhamTonganTrinidadian and TobagonianTurkishU.S. Virgin IslanderUgandanUkrainianUruguayanUteVenezuelanVietnameseWelshWest IndianYaquiYugoslavianYumanYup'ikZimbabwean
Ancestry (Percentage)
AfghanAfricanAlaska NativeAlbanianAleutAmericanApacheArabArapahoArgentineanArmenianAssyrian / Chaldean / SyriacAustralianAustrianBangladeshiBarbadianBasqueBelgianBelizeanBhutaneseBlackfeetBolivianBrazilianBritishBritish West IndianBulgarianBurmeseCajunCambodianCanadianCape VerdeanCelticCentral AmericanCentral American IndianCherokeeCheyenneChickasawChileanChineseChippewaChoctawColombianComancheCosta RicanCreeCreekCroatianCubanCzechCzechoslovakianDanishDelawareDominicanDutchDutch West IndianEastern EuropeanEcuadorianEgyptianEnglishEstonianEthiopianEuropeanFijianFilipinoFinnishFrenchFrench American IndianFrench CanadianGermanGerman RussianGhanaianGreekGuamanian / ChamorroGuatemalanGuyaneseHaitianHonduranHopiHungarianIcelanderIndian (Asian)IndonesianInupiatIranianIraqiIrishIroquoisIsraeliItalianJamaicanJapaneseJordanianKenyanKoreanLaotianLatvianLebaneseLiberianLithuanianLuxembourgerMacedonianMalaysianMalteseMenomineeMexicanMexican American IndianMongolianMoroccanNative HawaiianNavajoNew ZealanderNicaraguanNigerianNorthern EuropeanNorwegianOkinawanOsagePaiutePakistaniPalestinianPanamanianParaguayanPennsylvania GermanPeruvianPimaPolishPortuguesePotawatomiPuebloPuerto RicanPuget Sound SalishRomanianRussianSalvadoranSamoanScandinavianScotch-IrishScottishSeminoleSenegaleseSerbianShoshoneSierra LeoneanSiouxSlavicSlovakSloveneSomaliSouth AfricanSouth AmericanSouth American IndianSoviet UnionSpaniardSpanishSpanish AmericanSpanish American IndianSri LankanSubsaharan AfricanSudaneseSwedishSwissSyrianThaiTlingit-HaidaTohono O'OdhamTonganTrinidadian and TobagonianTurkishU.S. Virgin IslanderUgandanUkrainianUruguayanUteVenezuelanVietnameseWelshWest IndianYaquiYugoslavianYumanYup'ikZimbabwean
Immigrant Origin (Total)
AfghanistanAfricaAlbaniaArgentinaArmeniaAsiaAustraliaAustriaBahamasBangladeshBarbadosBelarusBelgiumBelizeBoliviaBosnia and HerzegovinaBrazilBulgariaBurma / MyanmarCambodiaCameroonCanadaCaribbeanCentral AmericaChileChinaColombiaCosta RicaCroatiaCubaCzechoslovakiaDenmarkDominican RepublicEastern AfricaEastern AsiaEastern EuropeEcuadorEgyptEl SalvadorEnglandEritreaEthiopiaEuropeFijiFranceGermanyGhanaGreeceGuatemalaGuyanaHaitiHondurasHong KongHungaryIndiaIndonesiaIranIraqIrelandIsraelItalyJamaicaJapanJordanKazakhstanKenyaKoreaLaosLatin AmericaLatviaLebanonLiberiaLithuaniaMalaysiaMexicoMicronesiaMiddle AfricaMoldovaMoroccoNepalNetherlandsNicaraguaNigeriaNorth MacedoniaNorthern AfricaNorthern EuropeNorwayOceaniaPakistanPanamaPeruPhilippinesPolandPortugalRomaniaRussiaSaudi ArabiaScotlandSenegalSerbiaSierra LeoneSingaporeSomaliaSouth AfricaSouth AmericaSouth Central AsiaSouth Eastern AsiaSouthern EuropeSpainSri LankaSudanSwedenSwitzerlandSyriaTaiwanThailandTrinidad and TobagoTurkeyUgandaUkraineUruguayUzbekistanVenezuelaVietnamWest IndiesWestern AfricaWestern AsiaWestern EuropeYemenZaireZimbabwe
Immigrant Origin (Percentage)
AfghanistanAfricaAlbaniaArgentinaArmeniaAsiaAustraliaAustriaBahamasBangladeshBarbadosBelarusBelgiumBelizeBoliviaBosnia and HerzegovinaBrazilBulgariaBurma / MyanmarCambodiaCameroonCanadaCaribbeanCentral AmericaChileChinaColombiaCosta RicaCroatiaCubaCzechoslovakiaDenmarkDominican RepublicEastern AfricaEastern AsiaEastern EuropeEcuadorEgyptEl SalvadorEnglandEritreaEthiopiaEuropeFijiFranceGermanyGhanaGreeceGuatemalaGuyanaHaitiHondurasHong KongHungaryIndiaIndonesiaIranIraqIrelandIsraelItalyJamaicaJapanJordanKazakhstanKenyaKoreaLaosLatin AmericaLatviaLebanonLiberiaLithuaniaMalaysiaMexicoMicronesiaMiddle AfricaMoldovaMoroccoNepalNetherlandsNicaraguaNigeriaNorth MacedoniaNorthern AfricaNorthern EuropeNorwayOceaniaPakistanPanamaPeruPhilippinesPolandPortugalRomaniaRussiaSaudi ArabiaScotlandSenegalSerbiaSierra LeoneSingaporeSomaliaSouth AfricaSouth AmericaSouth Central AsiaSouth Eastern AsiaSouthern EuropeSpainSri LankaSudanSwedenSwitzerlandSyriaTaiwanThailandTrinidad and TobagoTurkeyUgandaUkraineUruguayUzbekistanVenezuelaVietnamWest IndiesWestern AfricaWestern AsiaWestern EuropeYemenZaireZimbabwe
Income
Income (Families)
Income (Households)
Poverty
Poverty (Families)
Unemployment
Employment Occupations
Employment Industries
Employer Class
Commute Time
Commute Means
School Enrollment
Education by Degree Field
Occupancy
Finances
Physical Characteristics
Las Vegas
Compare Zip Codes
Comparison Subject

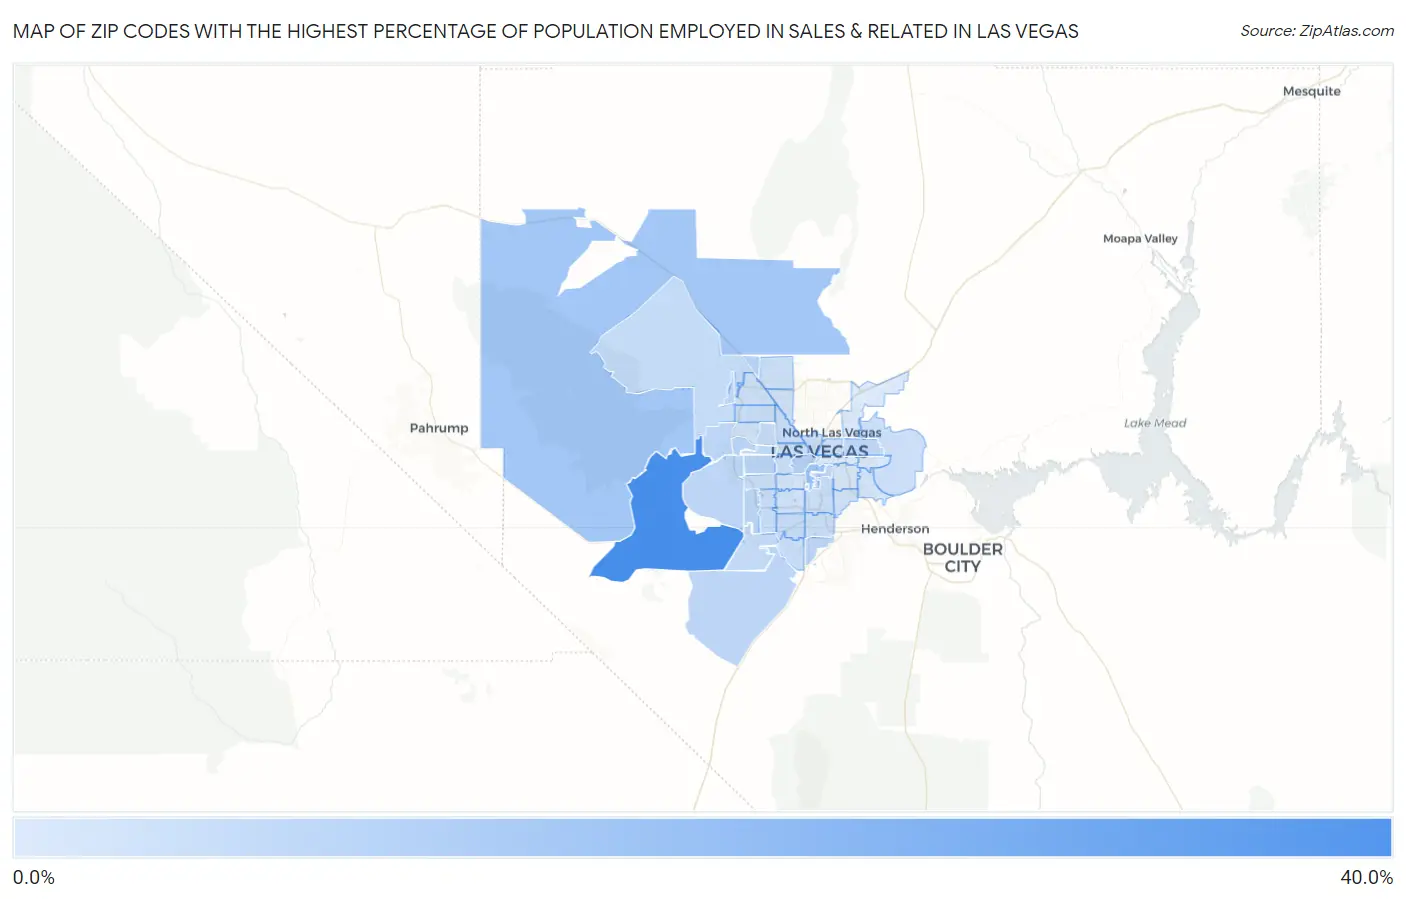
Map of Zip Codes with the Highest Percentage of Population Employed in Sales & Related in Las Vegas

0.0%
40.0%
Zip Codes with the Highest Percentage of Population Employed in Sales & Related in Las Vegas Map

Zip Codes with the Highest Percentage of Population Employed in Sales & Related in Las Vegas, NV

Zip Code % Employed vs State vs National
1.8916135.1%10.4%(+24.7)#29.6%(+25.5)#273
2.8910919.0%10.4%(+8.62)#79.6%(+9.45)#1,331
3.8912417.4%10.4%(+7.01)#99.6%(+7.84)#1,711
4.8910213.9%10.4%(+3.50)#189.6%(+4.33)#3,540
5.8914313.6%10.4%(+3.16)#219.6%(+3.99)#3,859
6.8914413.2%10.4%(+2.78)#259.6%(+3.60)#4,272
7.8914813.2%10.4%(+2.74)#269.6%(+3.57)#4,322
8.8911713.1%10.4%(+2.70)#279.6%(+3.52)#4,364
9.8917913.1%10.4%(+2.65)#289.6%(+3.47)#4,415
10.8913513.0%10.4%(+2.57)#309.6%(+3.40)#4,488
11.8913813.0%10.4%(+2.56)#319.6%(+3.38)#4,511
12.8915813.0%10.4%(+2.55)#329.6%(+3.37)#4,518
13.8918312.9%10.4%(+2.47)#339.6%(+3.29)#4,622
14.8916912.4%10.4%(+1.97)#379.6%(+2.79)#5,346
15.8911012.2%10.4%(+1.75)#409.6%(+2.58)#5,722
16.8917811.9%10.4%(+1.47)#449.6%(+2.30)#6,231
17.8914511.8%10.4%(+1.35)#489.6%(+2.17)#6,463
18.8912811.5%10.4%(+1.12)#549.6%(+1.95)#6,919
19.8913911.5%10.4%(+1.10)#559.6%(+1.93)#6,961
20.8911311.4%10.4%(+0.955)#579.6%(+1.78)#7,299
21.8916611.4%10.4%(+0.934)#589.6%(+1.76)#7,349
22.8912911.1%10.4%(+0.629)#609.6%(+1.46)#8,082
23.8914111.0%10.4%(+0.612)#619.6%(+1.44)#8,122
24.8911910.9%10.4%(+0.438)#649.6%(+1.26)#8,552
25.8910610.8%10.4%(+0.355)#669.6%(+1.18)#8,786
26.8914610.7%10.4%(+0.244)#679.6%(+1.07)#9,092
27.8912310.5%10.4%(+0.043)#709.6%(+0.869)#9,627
28.8914710.4%10.4%(+0.003)#729.6%(+0.829)#9,729
29.8910810.4%10.4%(-0.034)#739.6%(+0.792)#9,850
30.8914910.3%10.4%(-0.134)#759.6%(+0.692)#10,148
31.8915610.2%10.4%(-0.189)#769.6%(+0.638)#10,309
32.8913110.0%10.4%(-0.414)#819.6%(+0.413)#10,975
33.8912010.0%10.4%(-0.461)#849.6%(+0.365)#11,139
34.891309.9%10.4%(-0.510)#869.6%(+0.316)#11,283
35.891079.9%10.4%(-0.517)#879.6%(+0.310)#11,308
36.891189.8%10.4%(-0.585)#899.6%(+0.242)#11,512
37.891019.8%10.4%(-0.626)#909.6%(+0.201)#11,666
38.891349.7%10.4%(-0.736)#919.6%(+0.090)#12,087
39.891039.0%10.4%(-1.39)#999.6%(-0.563)#14,388
40.891229.0%10.4%(-1.40)#1009.6%(-0.570)#14,418
41.891428.2%10.4%(-2.23)#1109.6%(-1.41)#17,449
42.891218.1%10.4%(-2.36)#1119.6%(-1.54)#17,866
43.891157.6%10.4%(-2.78)#1169.6%(-1.95)#19,186
44.891047.5%10.4%(-2.93)#1189.6%(-2.11)#19,706

Common Questions

What are the Top 10 Zip Codes with the Highest Percentage of Population Employed in Sales & Related in Las Vegas, NV?
Top 10 Zip Codes with the Highest Percentage of Population Employed in Sales & Related in Las Vegas, NV are:
#1
35.1%
#2
19.0%
#3
17.4%
#4
13.9%
#5
13.6%
#6
13.2%
#7
13.2%
#8
13.1%
#9
13.1%
#10
13.0%
What zip code has the Highest Percentage of Population Employed in Sales & Related in Las Vegas, NV?
89161 has the Highest Percentage of Population Employed in Sales & Related in Las Vegas, NV with 35.1%.
What is the Percentage of Population Employed in Sales & Related in Las Vegas, NV?
Percentage of Population Employed in Sales & Related in Las Vegas is 11.2%.
What is the Percentage of Population Employed in Sales & Related in Nevada?
Percentage of Population Employed in Sales & Related in Nevada is 10.4%.
What is the Percentage of Population Employed in Sales & Related in the United States?
Percentage of Population Employed in Sales & Related in the United States is 9.6%.