Zip Codes with the Highest Percentage of Population Employed in Agriculture, Fishing & Hunting in Lexington, NC
RELATED REPORTS & OPTIONS
Agriculture, Fishing & Hunting
Lexington
Compare Zip Codes
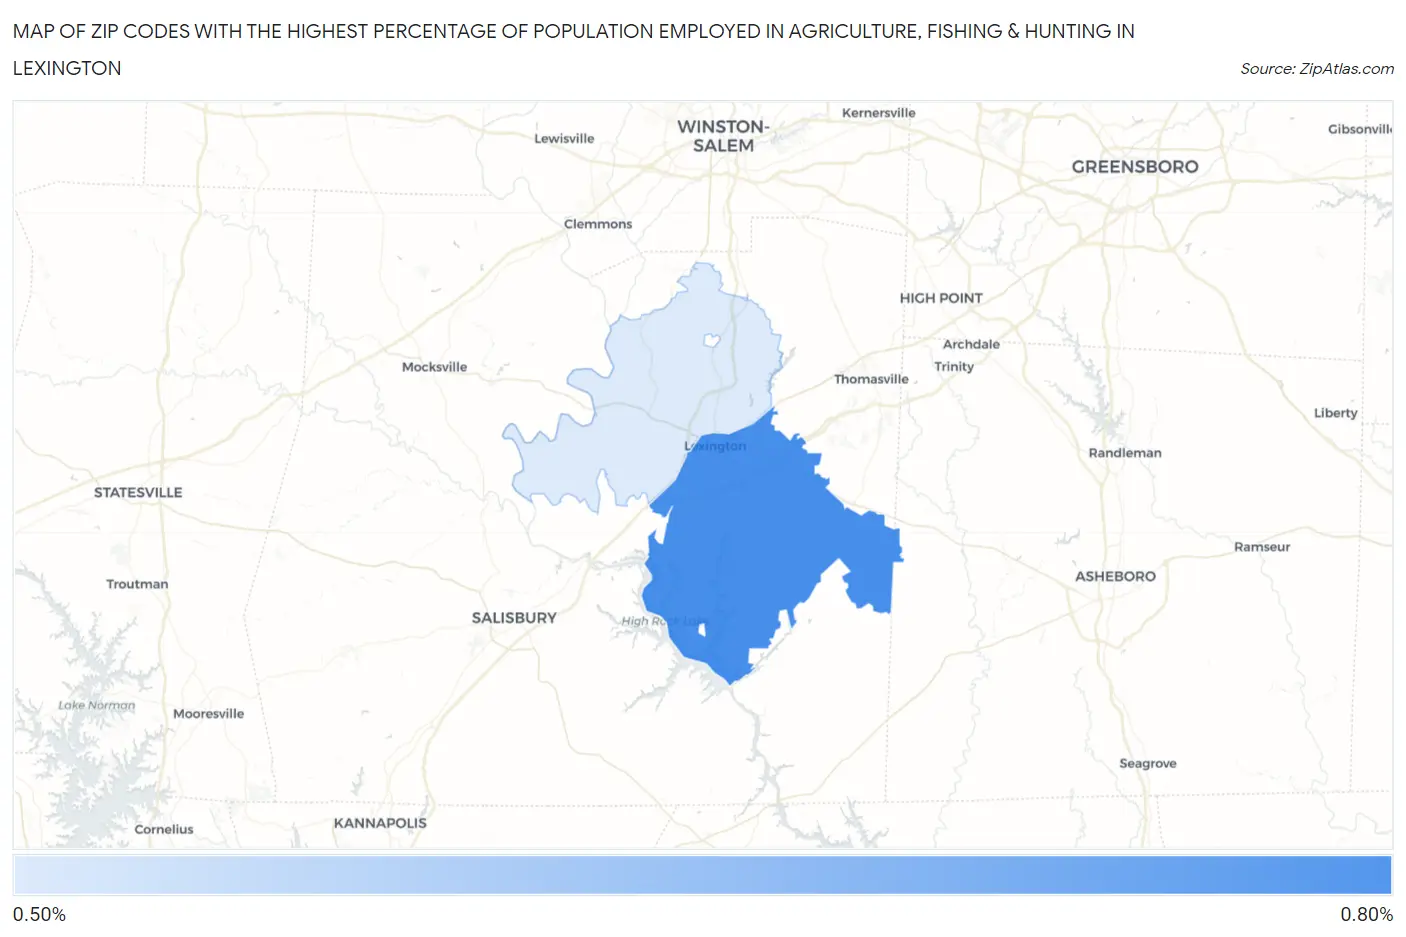
Map of Zip Codes with the Highest Percentage of Population Employed in Agriculture, Fishing & Hunting in Lexington
0.0%
0.80%
Zip Codes with the Highest Percentage of Population Employed in Agriculture, Fishing & Hunting in Lexington, NC
| Zip Code | % Employed | vs State | vs National | |
| 1. | 27292 | 0.70% | 1.0%(-0.303)#435 | 1.2%(-0.494)#17,822 |
| 2. | 27295 | 0.52% | 1.0%(-0.489)#473 | 1.2%(-0.680)#19,114 |
1
Common Questions
What are the Top Zip Codes with the Highest Percentage of Population Employed in Agriculture, Fishing & Hunting in Lexington, NC?
Top Zip Codes with the Highest Percentage of Population Employed in Agriculture, Fishing & Hunting in Lexington, NC are:
What zip code has the Highest Percentage of Population Employed in Agriculture, Fishing & Hunting in Lexington, NC?
27292 has the Highest Percentage of Population Employed in Agriculture, Fishing & Hunting in Lexington, NC with 0.70%.
What is the Percentage of Population Employed in Agriculture, Fishing & Hunting in Lexington, NC?
Percentage of Population Employed in Agriculture, Fishing & Hunting in Lexington is 0.21%.
What is the Percentage of Population Employed in Agriculture, Fishing & Hunting in North Carolina?
Percentage of Population Employed in Agriculture, Fishing & Hunting in North Carolina is 1.0%.
What is the Percentage of Population Employed in Agriculture, Fishing & Hunting in the United States?
Percentage of Population Employed in Agriculture, Fishing & Hunting in the United States is 1.2%.