Zip Codes with the Highest Percentage of Population Employed in Agriculture, Fishing & Hunting in Fort Bragg, NC
RELATED REPORTS & OPTIONS
Agriculture, Fishing & Hunting
Fort Bragg
Compare Zip Codes
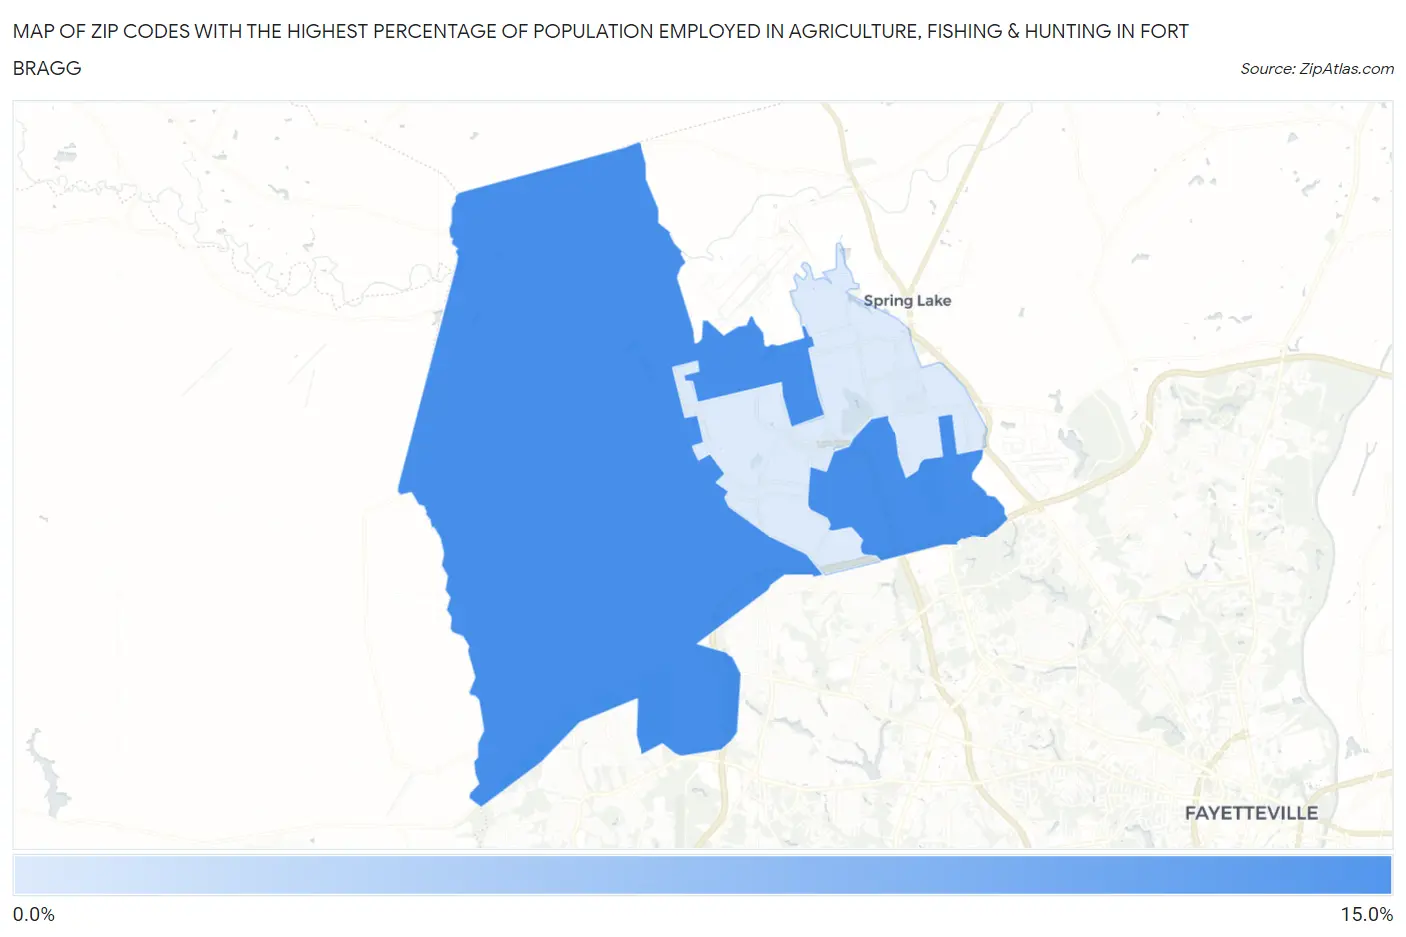
Map of Zip Codes with the Highest Percentage of Population Employed in Agriculture, Fishing & Hunting in Fort Bragg
0.26%
10.7%
Zip Codes with the Highest Percentage of Population Employed in Agriculture, Fishing & Hunting in Fort Bragg, NC
| Zip Code | % Employed | vs State | vs National | |
| 1. | 28310 | 10.7% | 1.0%(+9.70)#34 | 1.2%(+9.51)#3,998 |
| 2. | 28307 | 0.26% | 1.0%(-0.748)#565 | 1.2%(-0.939)#21,646 |
1
Common Questions
What are the Top Zip Codes with the Highest Percentage of Population Employed in Agriculture, Fishing & Hunting in Fort Bragg, NC?
Top Zip Codes with the Highest Percentage of Population Employed in Agriculture, Fishing & Hunting in Fort Bragg, NC are:
What zip code has the Highest Percentage of Population Employed in Agriculture, Fishing & Hunting in Fort Bragg, NC?
28310 has the Highest Percentage of Population Employed in Agriculture, Fishing & Hunting in Fort Bragg, NC with 10.7%.
What is the Percentage of Population Employed in Agriculture, Fishing & Hunting in North Carolina?
Percentage of Population Employed in Agriculture, Fishing & Hunting in North Carolina is 1.0%.
What is the Percentage of Population Employed in Agriculture, Fishing & Hunting in the United States?
Percentage of Population Employed in Agriculture, Fishing & Hunting in the United States is 1.2%.