Zip Codes with the Highest Percentage of Households Heated by Fuel Oil / Kerosene in Charlotte, NC

RELATED REPORTS & OPTIONS

Fuel Oil Heating
Population
Families and Households
Female Fertility
Female Fertility (Unmarried)
Race (Community Size)
Race (Percentage)
Ancestry (Community Size)
AfghanAfricanAlbanianAlsatianAmericanApacheArabArgentineanArmenianAustralianAustrianBahamianBangladeshiBarbadianBelgianBelizeanBhutaneseBlackfeetBolivianBrazilianBritishBritish West IndianBulgarianBurmeseCajunCambodianCanadianCape VerdeanCelticCentral AmericanCentral American IndianCherokeeChickasawChileanChippewaChoctawColombianCosta RicanCreekCroatianCubanCzechCzechoslovakianDanishDominicanDutchEastern EuropeanEcuadorianEgyptianEnglishEthiopianEuropeanFilipinoFinnishFrenchFrench American IndianFrench CanadianGermanGhanaianGreekGuamanian / ChamorroGuatemalanGuyaneseHaitianHonduranHoumaHungarianIcelanderIndian (Asian)IndonesianIranianIraqiIrishIroquoisIsraeliItalianJamaicanJapaneseJordanianKenyanKiowaKoreanLaotianLatvianLebaneseLiberianLithuanianLumbeeMacedonianMalaysianMalteseMexicanMexican American IndianMoroccanNative HawaiianNavajoNew ZealanderNicaraguanNigerianNorthern EuropeanNorwegianOsagePakistaniPalestinianPanamanianParaguayanPennsylvania GermanPeruvianPolishPortuguesePuerto RicanRomanianRussianSalvadoranSamoanScandinavianScotch-IrishScottishSeminoleSenegaleseSerbianSierra LeoneanSiouxSlavicSlovakSloveneSomaliSouth AfricanSouth AmericanSouth American IndianSpaniardSpanishSri LankanSubsaharan AfricanSudaneseSwedishSwissSyrianTaiwaneseThaiTonganTrinidadian and TobagonianTurkishU.S. Virgin IslanderUkrainianUruguayanVenezuelanVietnameseWelshWest IndianYugoslavianZimbabwean
Ancestry (Percentage)
AfghanAfricanAlbanianAlsatianAmericanApacheArabArgentineanArmenianAustralianAustrianBahamianBangladeshiBarbadianBelgianBelizeanBhutaneseBlackfeetBolivianBrazilianBritishBritish West IndianBulgarianBurmeseCajunCambodianCanadianCape VerdeanCelticCentral AmericanCentral American IndianCherokeeChickasawChileanChippewaChoctawColombianCosta RicanCreekCroatianCubanCzechCzechoslovakianDanishDominicanDutchEastern EuropeanEcuadorianEgyptianEnglishEthiopianEuropeanFilipinoFinnishFrenchFrench American IndianFrench CanadianGermanGhanaianGreekGuamanian / ChamorroGuatemalanGuyaneseHaitianHonduranHoumaHungarianIcelanderIndian (Asian)IndonesianIranianIraqiIrishIroquoisIsraeliItalianJamaicanJapaneseJordanianKenyanKiowaKoreanLaotianLatvianLebaneseLiberianLithuanianLumbeeMacedonianMalaysianMalteseMexicanMexican American IndianMoroccanNative HawaiianNavajoNew ZealanderNicaraguanNigerianNorthern EuropeanNorwegianOsagePakistaniPalestinianPanamanianParaguayanPennsylvania GermanPeruvianPolishPortuguesePuerto RicanRomanianRussianSalvadoranSamoanScandinavianScotch-IrishScottishSeminoleSenegaleseSerbianSierra LeoneanSiouxSlavicSlovakSloveneSomaliSouth AfricanSouth AmericanSouth American IndianSpaniardSpanishSri LankanSubsaharan AfricanSudaneseSwedishSwissSyrianTaiwaneseThaiTonganTrinidadian and TobagonianTurkishU.S. Virgin IslanderUkrainianUruguayanVenezuelanVietnameseWelshWest IndianYugoslavianZimbabwean
Immigrant Origin (Total)
AfghanistanAfricaAlbaniaArgentinaAsiaAustraliaAustriaBahamasBangladeshBarbadosBelarusBelgiumBelizeBoliviaBosnia and HerzegovinaBrazilBulgariaBurma / MyanmarCabo VerdeCambodiaCameroonCanadaCaribbeanCentral AmericaChileChinaColombiaCongoCosta RicaCroatiaCubaCzechoslovakiaDenmarkDominican RepublicEastern AfricaEastern AsiaEastern EuropeEcuadorEgyptEl SalvadorEnglandEritreaEthiopiaEuropeFranceGermanyGhanaGreeceGrenadaGuatemalaGuyanaHaitiHondurasHong KongHungaryIndiaIndonesiaIranIraqIrelandIsraelItalyJamaicaJapanJordanKazakhstanKenyaKoreaKuwaitLaosLatin AmericaLatviaLebanonLiberiaLithuaniaMalaysiaMexicoMiddle AfricaMoldovaMoroccoNepalNetherlandsNicaraguaNigeriaNorthern AfricaNorthern EuropeNorwayOceaniaPakistanPanamaPeruPhilippinesPolandPortugalRomaniaRussiaSaudi ArabiaScotlandSenegalSerbiaSierra LeoneSingaporeSomaliaSouth AfricaSouth AmericaSouth Central AsiaSouth Eastern AsiaSouthern EuropeSpainSri LankaSudanSwedenSwitzerlandSyriaTaiwanThailandTrinidad and TobagoTurkeyUkraineUruguayUzbekistanVenezuelaVietnamWest IndiesWestern AfricaWestern AsiaWestern EuropeZaireZimbabwe
Immigrant Origin (Percentage)
AfghanistanAfricaAlbaniaArgentinaAsiaAustraliaAustriaBahamasBangladeshBarbadosBelarusBelgiumBelizeBoliviaBosnia and HerzegovinaBrazilBulgariaBurma / MyanmarCabo VerdeCambodiaCameroonCanadaCaribbeanCentral AmericaChileChinaColombiaCongoCosta RicaCroatiaCubaCzechoslovakiaDenmarkDominican RepublicEastern AfricaEastern AsiaEastern EuropeEcuadorEgyptEl SalvadorEnglandEritreaEthiopiaEuropeFranceGermanyGhanaGreeceGrenadaGuatemalaGuyanaHaitiHondurasHong KongHungaryIndiaIndonesiaIranIraqIrelandIsraelItalyJamaicaJapanJordanKazakhstanKenyaKoreaKuwaitLaosLatin AmericaLatviaLebanonLiberiaLithuaniaMalaysiaMexicoMiddle AfricaMoldovaMoroccoNepalNetherlandsNicaraguaNigeriaNorthern AfricaNorthern EuropeNorwayOceaniaPakistanPanamaPeruPhilippinesPolandPortugalRomaniaRussiaSaudi ArabiaScotlandSenegalSerbiaSierra LeoneSingaporeSomaliaSouth AfricaSouth AmericaSouth Central AsiaSouth Eastern AsiaSouthern EuropeSpainSri LankaSudanSwedenSwitzerlandSyriaTaiwanThailandTrinidad and TobagoTurkeyUkraineUruguayUzbekistanVenezuelaVietnamWest IndiesWestern AfricaWestern AsiaWestern EuropeZaireZimbabwe
Income
Income (Families)
Income (Households)
Poverty
Poverty (Families)
Unemployment
Employment Occupations
Employment Industries
Employer Class
Commute Time
Commute Means
School Enrollment
Education by Degree Field
Occupancy
Finances
Physical Characteristics
Charlotte
Compare Zip Codes
Comparison Subject

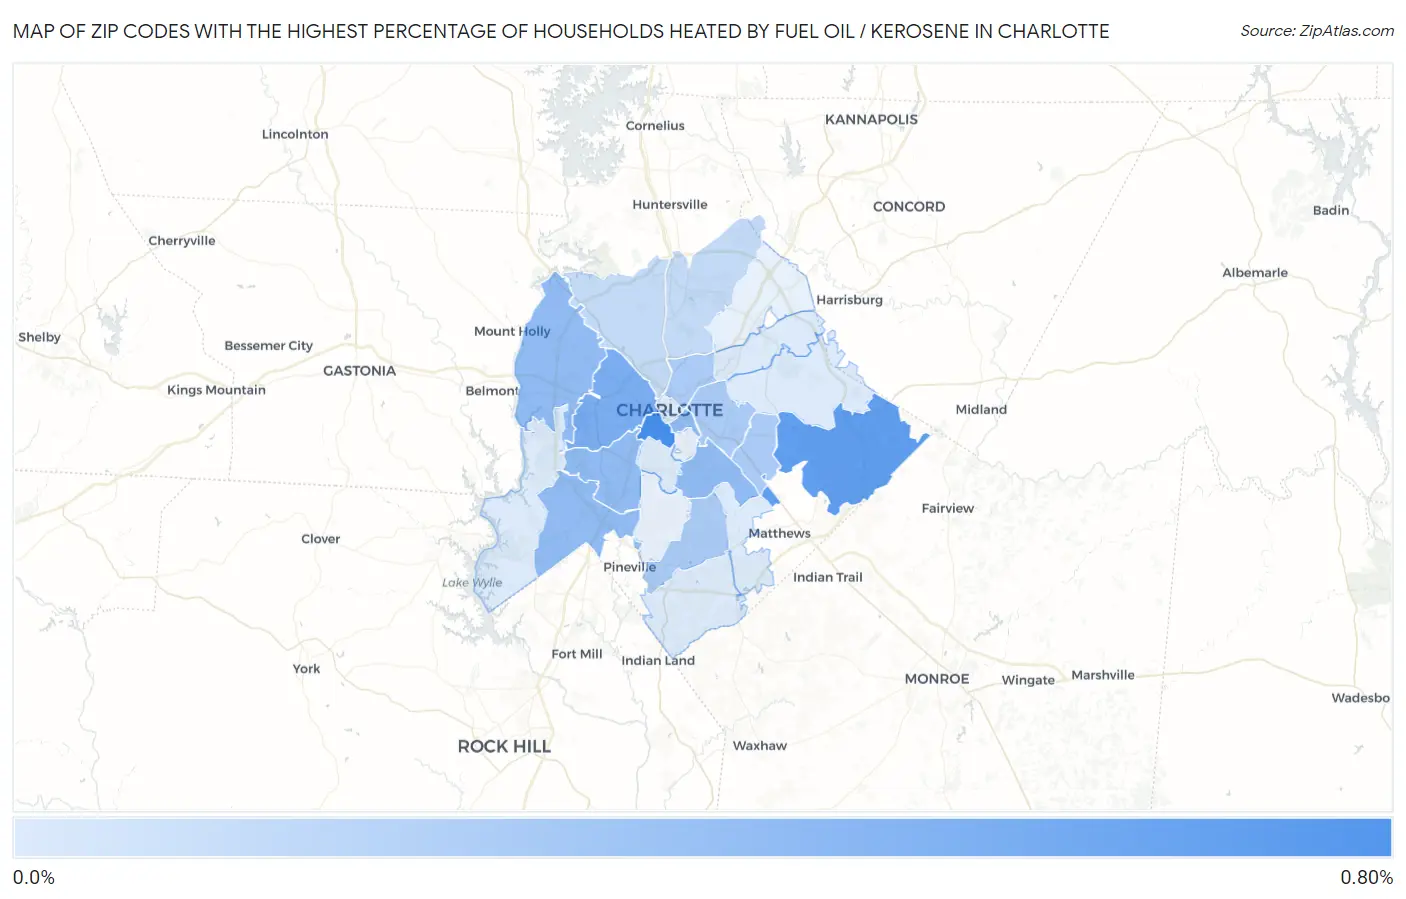
Map of Zip Codes with the Highest Percentage of Households Heated by Fuel Oil / Kerosene in Charlotte

0.0%
0.80%
Zip Codes with the Highest Percentage of Households Heated by Fuel Oil / Kerosene in Charlotte Map

Zip Codes with the Highest Percentage of Households Heated by Fuel Oil / Kerosene in Charlotte, NC

Zip Code Fuel Oil Heating vs State vs National
1.282030.70%2.4%(-1.70)#4744.2%(-3.50)#13,623
2.282270.60%2.4%(-1.80)#4834.2%(-3.60)#13,876
3.282080.50%2.4%(-1.90)#5084.2%(-3.70)#14,313
4.282730.40%2.4%(-2.00)#5314.2%(-3.80)#14,734
5.282140.40%2.4%(-2.00)#5344.2%(-3.80)#14,755
6.282110.40%2.4%(-2.00)#5404.2%(-3.80)#14,801
7.282170.40%2.4%(-2.00)#5414.2%(-3.80)#14,804
8.282040.40%2.4%(-2.00)#5474.2%(-3.80)#15,002
9.282050.30%2.4%(-2.10)#5554.2%(-3.90)#15,228
10.282120.30%2.4%(-2.10)#5594.2%(-3.90)#15,264
11.282260.30%2.4%(-2.10)#5614.2%(-3.90)#15,291
12.282060.30%2.4%(-2.10)#5684.2%(-3.90)#15,565
13.282690.20%2.4%(-2.20)#5794.2%(-4.00)#15,837
14.282160.20%2.4%(-2.20)#5834.2%(-4.00)#15,899
15.282770.10%2.4%(-2.30)#6024.2%(-4.10)#16,672
16.282150.10%2.4%(-2.30)#6034.2%(-4.10)#16,692
17.282130.10%2.4%(-2.30)#6124.2%(-4.10)#16,900
18.282780.10%2.4%(-2.30)#6174.2%(-4.10)#17,069
19.282700.10%2.4%(-2.30)#6194.2%(-4.10)#17,092
20.282090.10%2.4%(-2.30)#6234.2%(-4.10)#17,361
21.282020.10%2.4%(-2.30)#6284.2%(-4.10)#17,535

Common Questions

What are the Top 10 Zip Codes with the Highest Percentage of Households Heated by Fuel Oil / Kerosene in Charlotte, NC?
Top 10 Zip Codes with the Highest Percentage of Households Heated by Fuel Oil / Kerosene in Charlotte, NC are:
#1
0.70%
#2
0.60%
#3
0.50%
#4
0.40%
#5
0.40%
#6
0.40%
#7
0.40%
#8
0.40%
#9
0.30%
#10
0.30%
What zip code has the Highest Percentage of Households Heated by Fuel Oil / Kerosene in Charlotte, NC?
28203 has the Highest Percentage of Households Heated by Fuel Oil / Kerosene in Charlotte, NC with 0.70%.
What is the Percentage of Households Heated by Fuel Oil / Kerosene in Charlotte, NC?
Percentage of Households Heated by Fuel Oil / Kerosene in Charlotte is 0.20%.
What is the Percentage of Households Heated by Fuel Oil / Kerosene in North Carolina?
Percentage of Households Heated by Fuel Oil / Kerosene in North Carolina is 2.4%.
What is the Percentage of Households Heated by Fuel Oil / Kerosene in the United States?
Percentage of Households Heated by Fuel Oil / Kerosene in the United States is 4.2%.