Zip Codes with the Highest Percentage of Population Employed in Agriculture, Fishing & Hunting in Burlington, NC
RELATED REPORTS & OPTIONS
Agriculture, Fishing & Hunting
Burlington
Compare Zip Codes
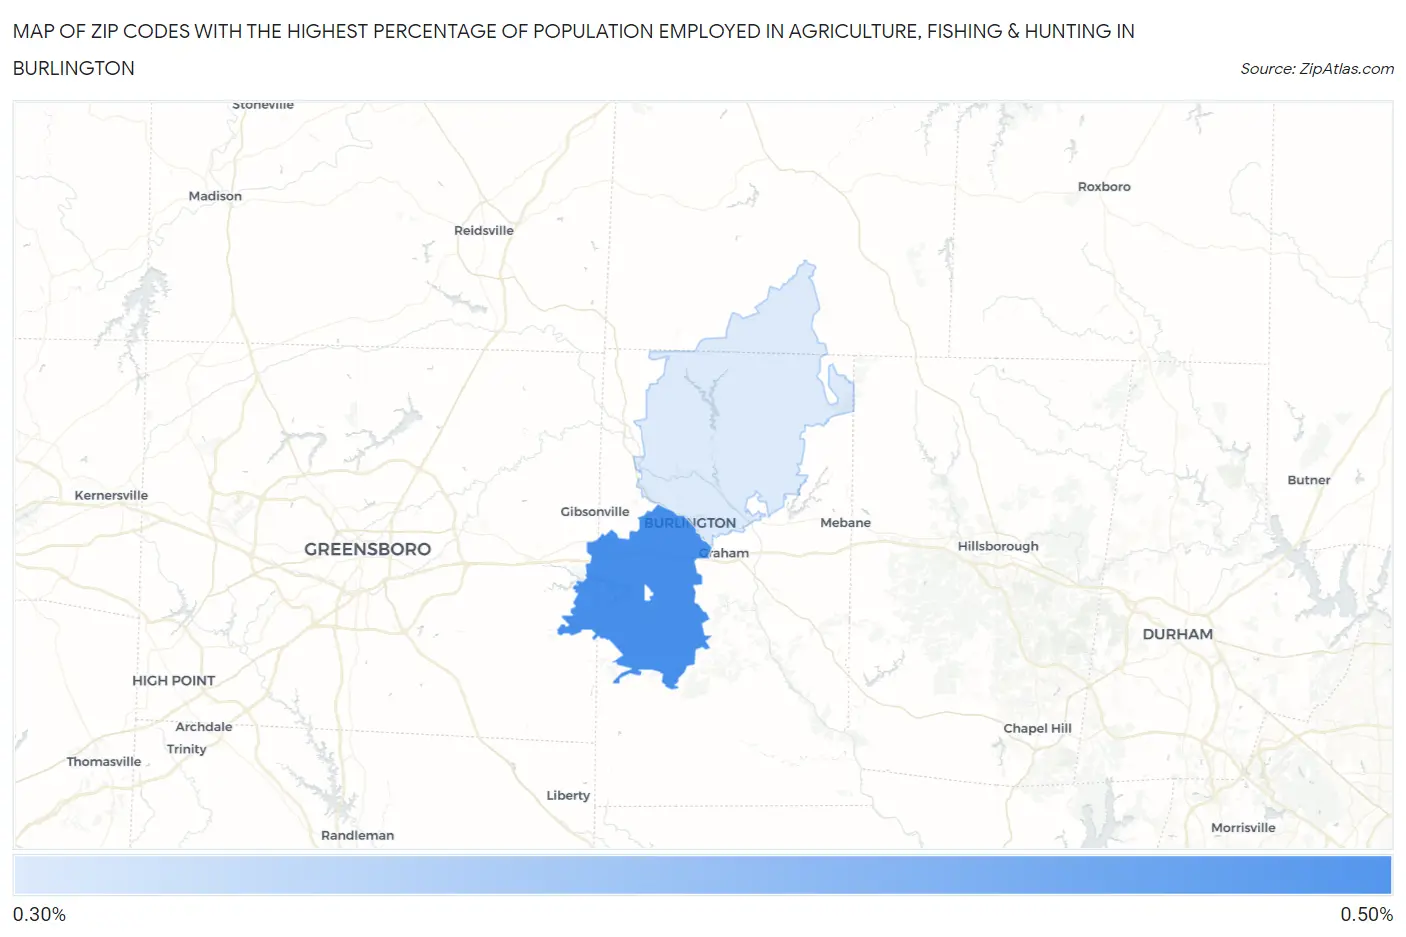
Map of Zip Codes with the Highest Percentage of Population Employed in Agriculture, Fishing & Hunting in Burlington
0.0%
0.50%
Zip Codes with the Highest Percentage of Population Employed in Agriculture, Fishing & Hunting in Burlington, NC
| Zip Code | % Employed | vs State | vs National | |
| 1. | 27215 | 0.50% | 1.0%(-0.509)#482 | 1.2%(-0.700)#19,290 |
| 2. | 27217 | 0.34% | 1.0%(-0.672)#536 | 1.2%(-0.864)#20,792 |
1
Common Questions
What are the Top Zip Codes with the Highest Percentage of Population Employed in Agriculture, Fishing & Hunting in Burlington, NC?
Top Zip Codes with the Highest Percentage of Population Employed in Agriculture, Fishing & Hunting in Burlington, NC are:
What zip code has the Highest Percentage of Population Employed in Agriculture, Fishing & Hunting in Burlington, NC?
27215 has the Highest Percentage of Population Employed in Agriculture, Fishing & Hunting in Burlington, NC with 0.50%.
What is the Percentage of Population Employed in Agriculture, Fishing & Hunting in Burlington, NC?
Percentage of Population Employed in Agriculture, Fishing & Hunting in Burlington is 0.27%.
What is the Percentage of Population Employed in Agriculture, Fishing & Hunting in North Carolina?
Percentage of Population Employed in Agriculture, Fishing & Hunting in North Carolina is 1.0%.
What is the Percentage of Population Employed in Agriculture, Fishing & Hunting in the United States?
Percentage of Population Employed in Agriculture, Fishing & Hunting in the United States is 1.2%.