Zip Codes with the Highest Percentage of Population Employed in Professional & Scientific Services in Missoula, MT
RELATED REPORTS & OPTIONS
Professional & Scientific Services
Missoula
Compare Zip Codes
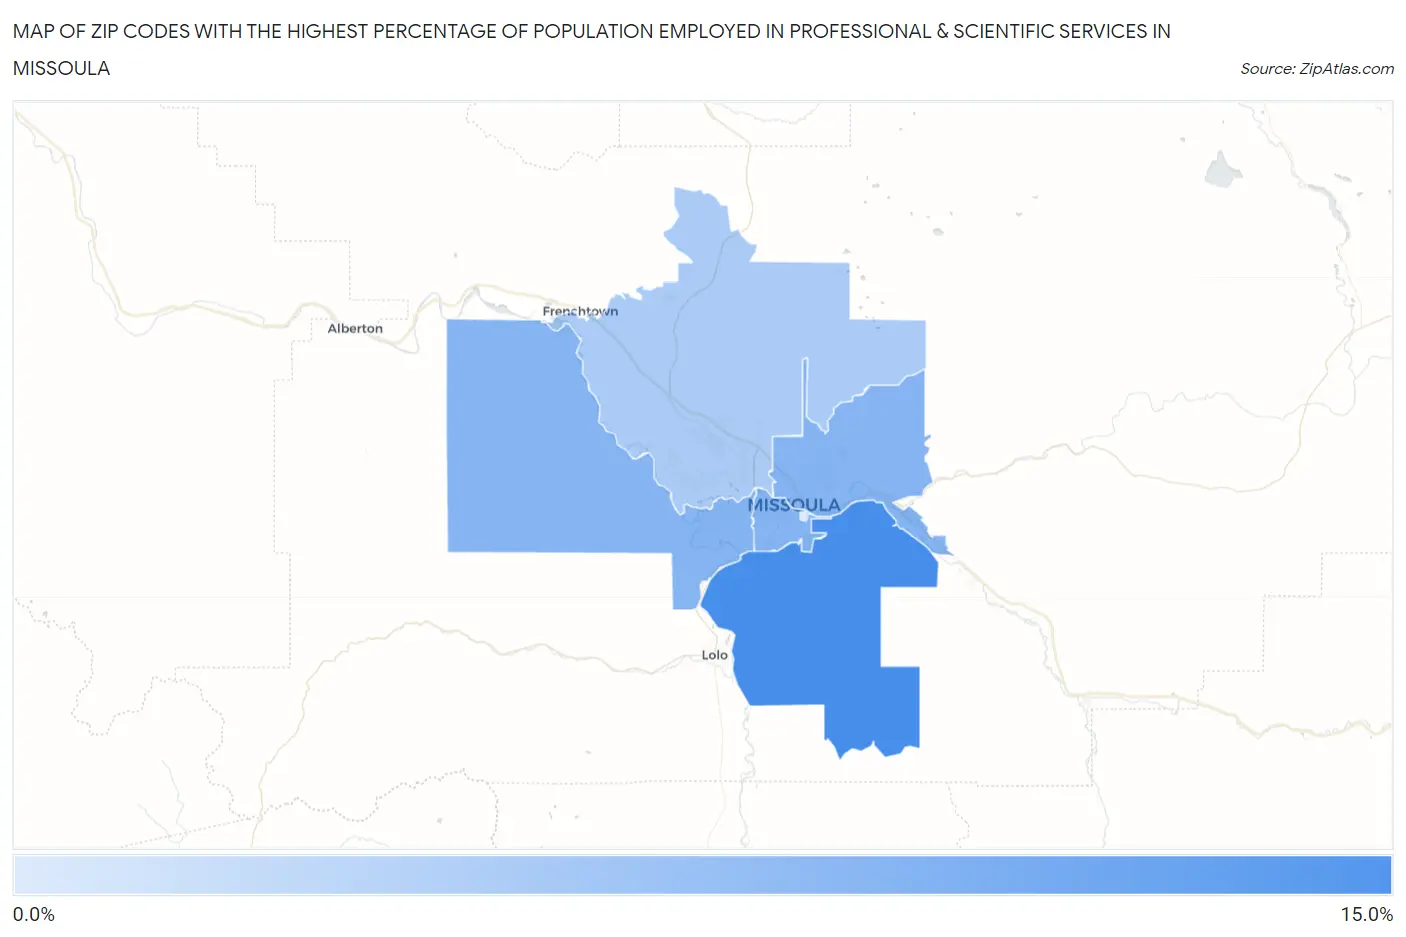
Map of Zip Codes with the Highest Percentage of Population Employed in Professional & Scientific Services in Missoula
0.0%
15.0%
Zip Codes with the Highest Percentage of Population Employed in Professional & Scientific Services in Missoula, MT
| Zip Code | % Employed | vs State | vs National | |
| 1. | 59803 | 12.9% | 6.1%(+6.82)#14 | 7.8%(+5.07)#2,744 |
| 2. | 59804 | 7.9% | 6.1%(+1.77)#48 | 7.8%(+0.021)#6,846 |
| 3. | 59802 | 7.9% | 6.1%(+1.76)#49 | 7.8%(+0.011)#6,858 |
| 4. | 59801 | 7.8% | 6.1%(+1.74)#50 | 7.8%(-0.013)#6,886 |
| 5. | 59808 | 4.8% | 6.1%(-1.25)#103 | 7.8%(-3.00)#12,703 |
| 6. | 59812 | 0.95% | 6.1%(-5.15)#232 | 7.8%(-6.90)#25,170 |
1
Common Questions
What are the Top 5 Zip Codes with the Highest Percentage of Population Employed in Professional & Scientific Services in Missoula, MT?
Top 5 Zip Codes with the Highest Percentage of Population Employed in Professional & Scientific Services in Missoula, MT are:
What zip code has the Highest Percentage of Population Employed in Professional & Scientific Services in Missoula, MT?
59803 has the Highest Percentage of Population Employed in Professional & Scientific Services in Missoula, MT with 12.9%.
What is the Percentage of Population Employed in Professional & Scientific Services in Missoula, MT?
Percentage of Population Employed in Professional & Scientific Services in Missoula is 8.6%.
What is the Percentage of Population Employed in Professional & Scientific Services in Montana?
Percentage of Population Employed in Professional & Scientific Services in Montana is 6.1%.
What is the Percentage of Population Employed in Professional & Scientific Services in the United States?
Percentage of Population Employed in Professional & Scientific Services in the United States is 7.8%.