Zip Codes with the Highest Percentage of Population Employed in Arts, Entertainment & Recreation in Great Falls, MT
RELATED REPORTS & OPTIONS
Arts, Entertainment & Recreation
Great Falls
Compare Zip Codes
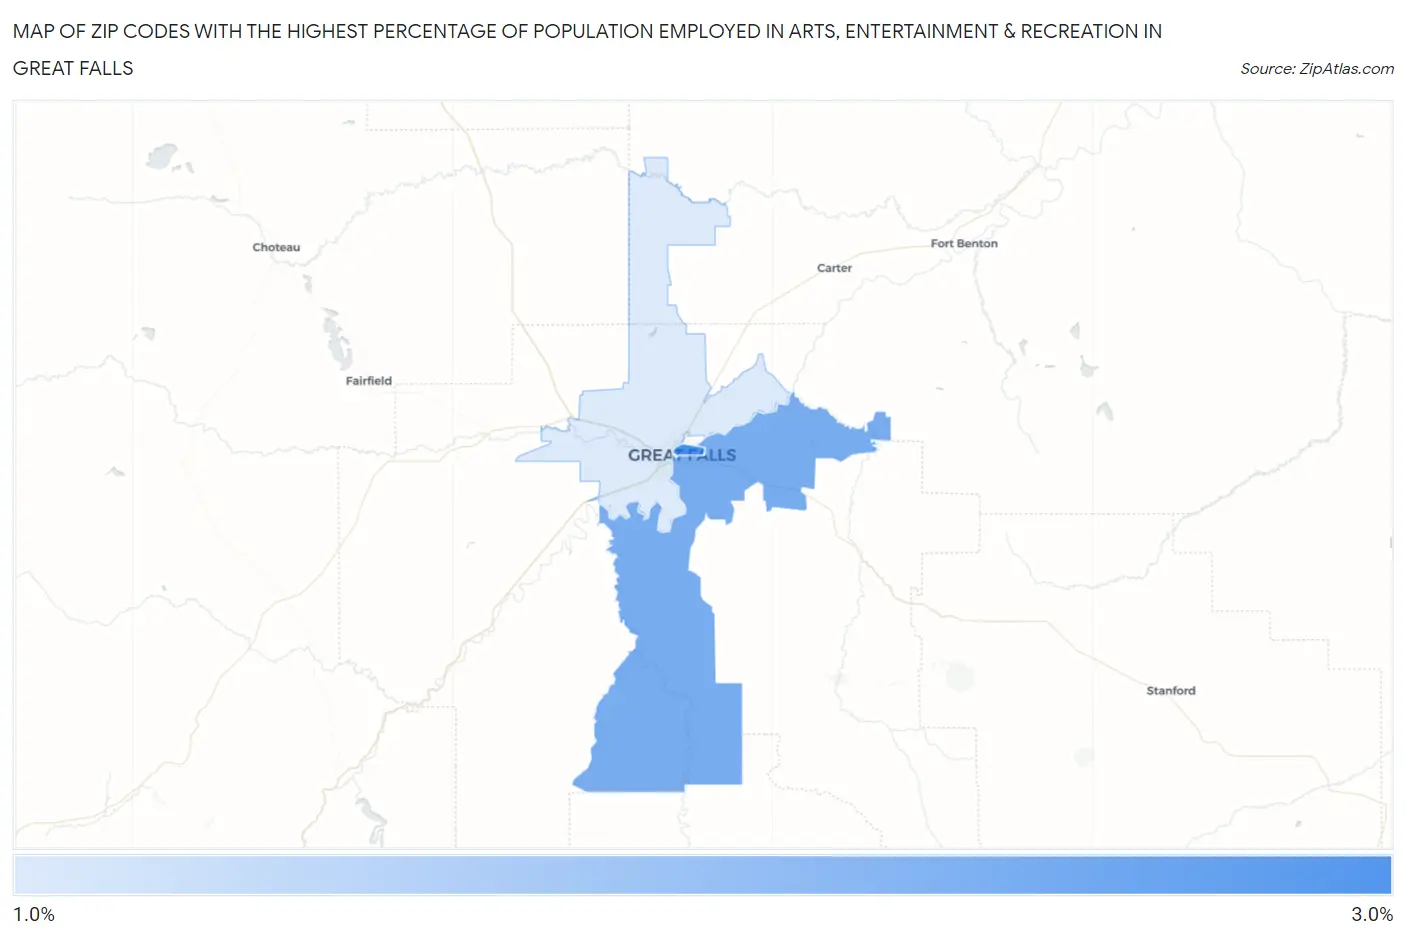
Map of Zip Codes with the Highest Percentage of Population Employed in Arts, Entertainment & Recreation in Great Falls
0.0%
3.0%
Zip Codes with the Highest Percentage of Population Employed in Arts, Entertainment & Recreation in Great Falls, MT
| Zip Code | % Employed | vs State | vs National | |
| 1. | 59401 | 2.8% | 2.5%(+0.328)#80 | 2.1%(+0.745)#5,894 |
| 2. | 59405 | 2.4% | 2.5%(-0.068)#90 | 2.1%(+0.350)#7,496 |
| 3. | 59404 | 1.6% | 2.5%(-0.889)#116 | 2.1%(-0.471)#12,380 |
1
Common Questions
What are the Top Zip Codes with the Highest Percentage of Population Employed in Arts, Entertainment & Recreation in Great Falls, MT?
Top Zip Codes with the Highest Percentage of Population Employed in Arts, Entertainment & Recreation in Great Falls, MT are:
What zip code has the Highest Percentage of Population Employed in Arts, Entertainment & Recreation in Great Falls, MT?
59401 has the Highest Percentage of Population Employed in Arts, Entertainment & Recreation in Great Falls, MT with 2.8%.
What is the Percentage of Population Employed in Arts, Entertainment & Recreation in Great Falls, MT?
Percentage of Population Employed in Arts, Entertainment & Recreation in Great Falls is 2.2%.
What is the Percentage of Population Employed in Arts, Entertainment & Recreation in Montana?
Percentage of Population Employed in Arts, Entertainment & Recreation in Montana is 2.5%.
What is the Percentage of Population Employed in Arts, Entertainment & Recreation in the United States?
Percentage of Population Employed in Arts, Entertainment & Recreation in the United States is 2.1%.