Zip Codes with the Highest Percentage of Population Employed in Arts, Entertainment & Recreation in Bozeman, MT
RELATED REPORTS & OPTIONS
Arts, Entertainment & Recreation
Bozeman
Compare Zip Codes
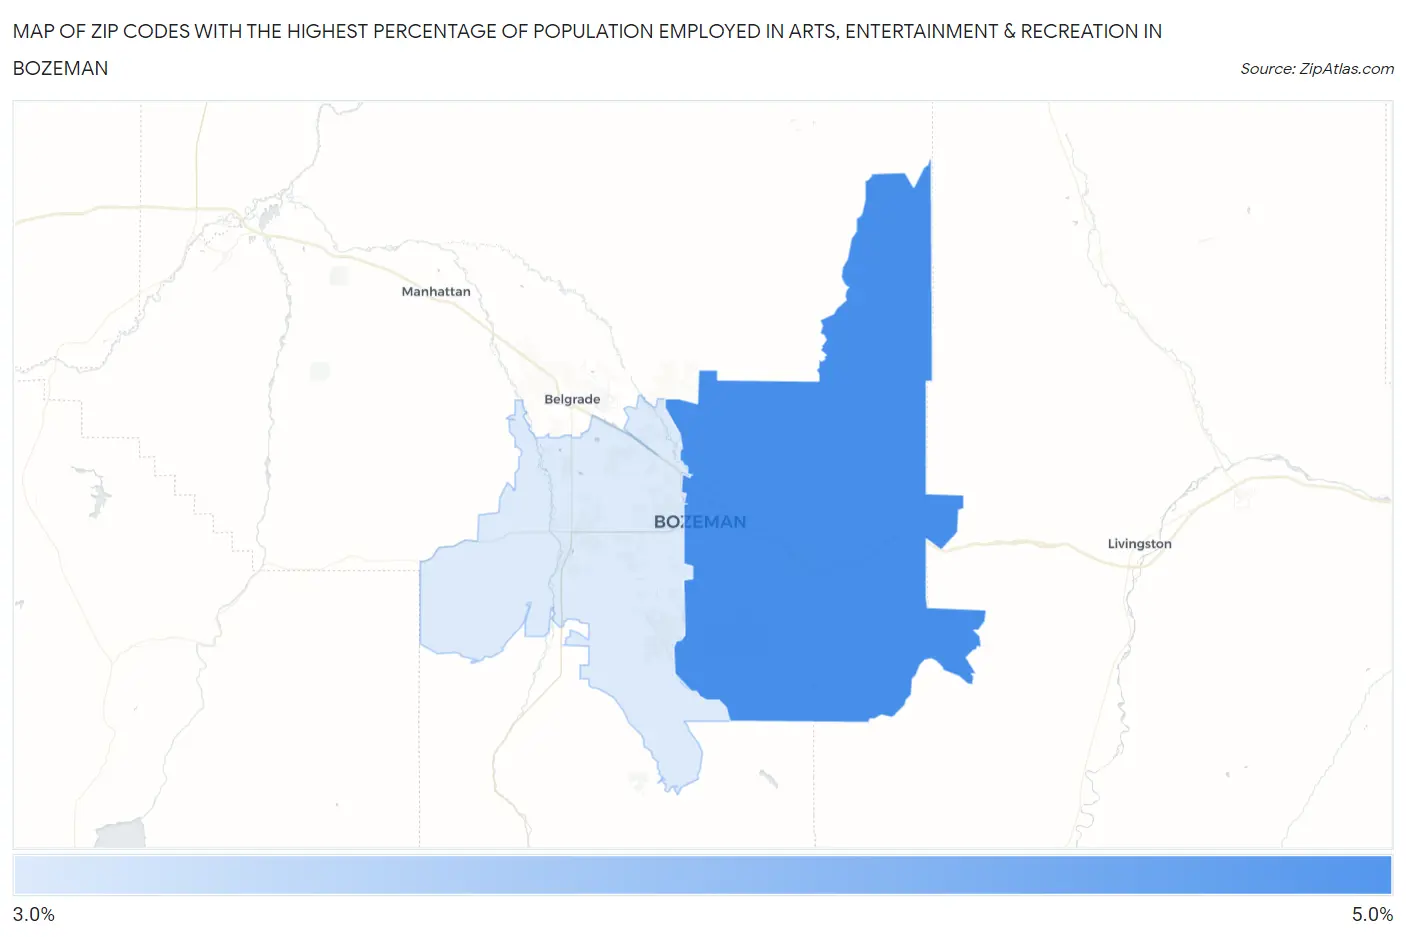
Map of Zip Codes with the Highest Percentage of Population Employed in Arts, Entertainment & Recreation in Bozeman
0.0%
5.0%
Zip Codes with the Highest Percentage of Population Employed in Arts, Entertainment & Recreation in Bozeman, MT
| Zip Code | % Employed | vs State | vs National | |
| 1. | 59715 | 4.1% | 2.5%(+1.58)#47 | 2.1%(+1.99)#3,225 |
| 2. | 59718 | 3.7% | 2.5%(+1.23)#52 | 2.1%(+1.64)#3,738 |
1
Common Questions
What are the Top Zip Codes with the Highest Percentage of Population Employed in Arts, Entertainment & Recreation in Bozeman, MT?
Top Zip Codes with the Highest Percentage of Population Employed in Arts, Entertainment & Recreation in Bozeman, MT are:
What zip code has the Highest Percentage of Population Employed in Arts, Entertainment & Recreation in Bozeman, MT?
59715 has the Highest Percentage of Population Employed in Arts, Entertainment & Recreation in Bozeman, MT with 4.1%.
What is the Percentage of Population Employed in Arts, Entertainment & Recreation in Bozeman, MT?
Percentage of Population Employed in Arts, Entertainment & Recreation in Bozeman is 3.9%.
What is the Percentage of Population Employed in Arts, Entertainment & Recreation in Montana?
Percentage of Population Employed in Arts, Entertainment & Recreation in Montana is 2.5%.
What is the Percentage of Population Employed in Arts, Entertainment & Recreation in the United States?
Percentage of Population Employed in Arts, Entertainment & Recreation in the United States is 2.1%.