Zip Codes with the Highest Percentage of Population with a Degree in Visual and Performing Arts in Pascagoula, MS
RELATED REPORTS & OPTIONS
Visual and Performing Arts
Pascagoula
Compare Zip Codes
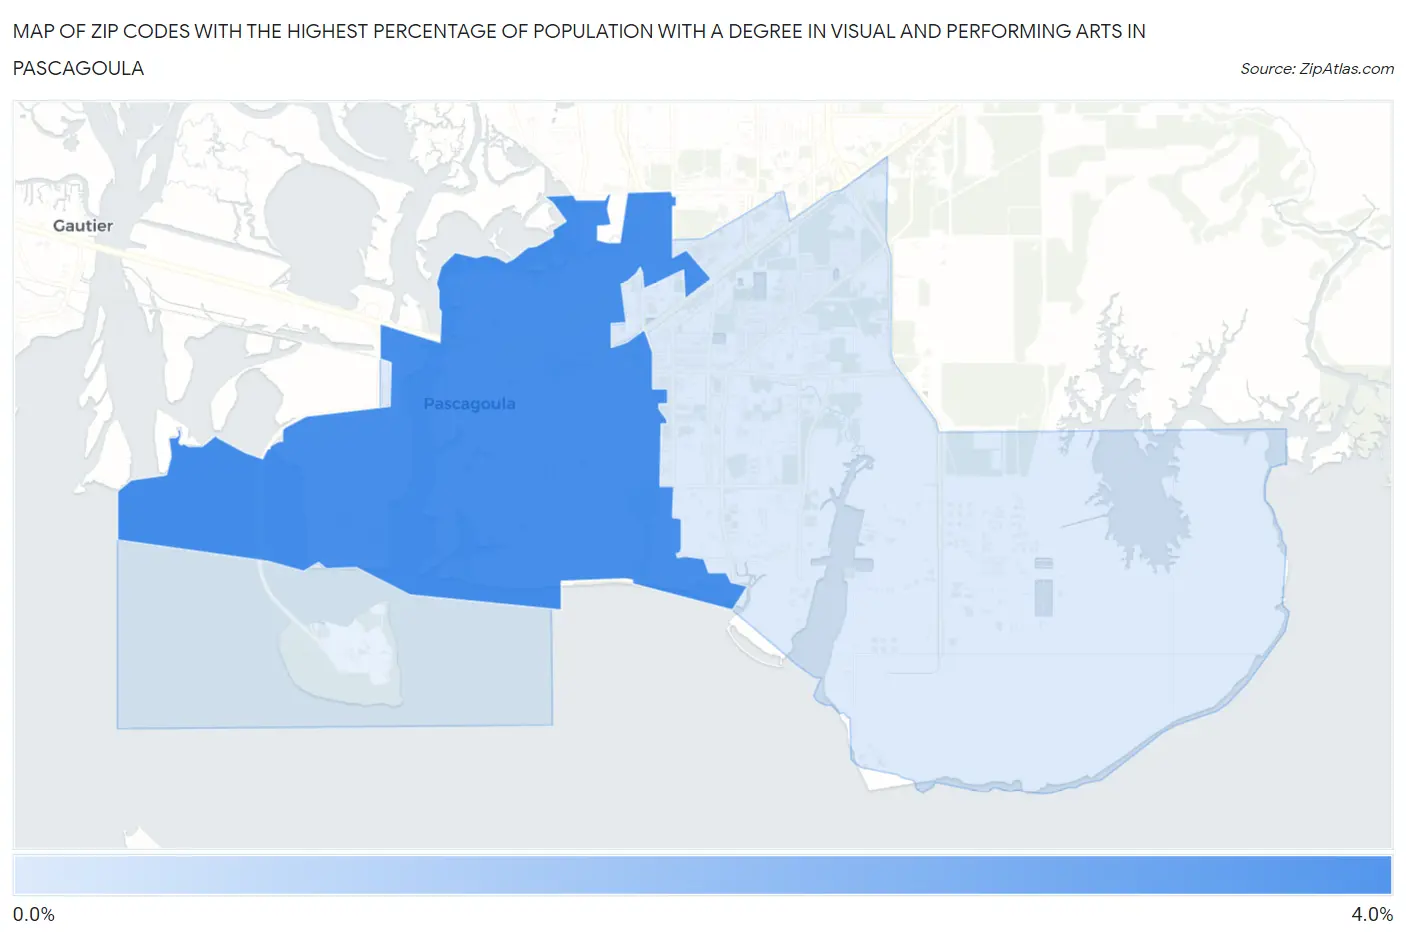
Map of Zip Codes with the Highest Percentage of Population with a Degree in Visual and Performing Arts in Pascagoula
0.39%
3.1%
Zip Codes with the Highest Percentage of Population with a Degree in Visual and Performing Arts in Pascagoula, MS
| Zip Code | % Graduates | vs State | vs National | |
| 1. | 39567 | 3.1% | 2.4%(+0.765)#66 | 4.3%(-1.11)#12,190 |
| 2. | 39581 | 0.39% | 2.4%(-1.99)#185 | 4.3%(-3.86)#20,973 |
1
Common Questions
What are the Top Zip Codes with the Highest Percentage of Population with a Degree in Visual and Performing Arts in Pascagoula, MS?
Top Zip Codes with the Highest Percentage of Population with a Degree in Visual and Performing Arts in Pascagoula, MS are:
What zip code has the Highest Percentage of Population with a Degree in Visual and Performing Arts in Pascagoula, MS?
39567 has the Highest Percentage of Population with a Degree in Visual and Performing Arts in Pascagoula, MS with 3.1%.
What is the Percentage of Population with a Degree in Visual and Performing Arts in Pascagoula, MS?
Percentage of Population with a Degree in Visual and Performing Arts in Pascagoula is 1.8%.
What is the Percentage of Population with a Degree in Visual and Performing Arts in Mississippi?
Percentage of Population with a Degree in Visual and Performing Arts in Mississippi is 2.4%.
What is the Percentage of Population with a Degree in Visual and Performing Arts in the United States?
Percentage of Population with a Degree in Visual and Performing Arts in the United States is 4.3%.