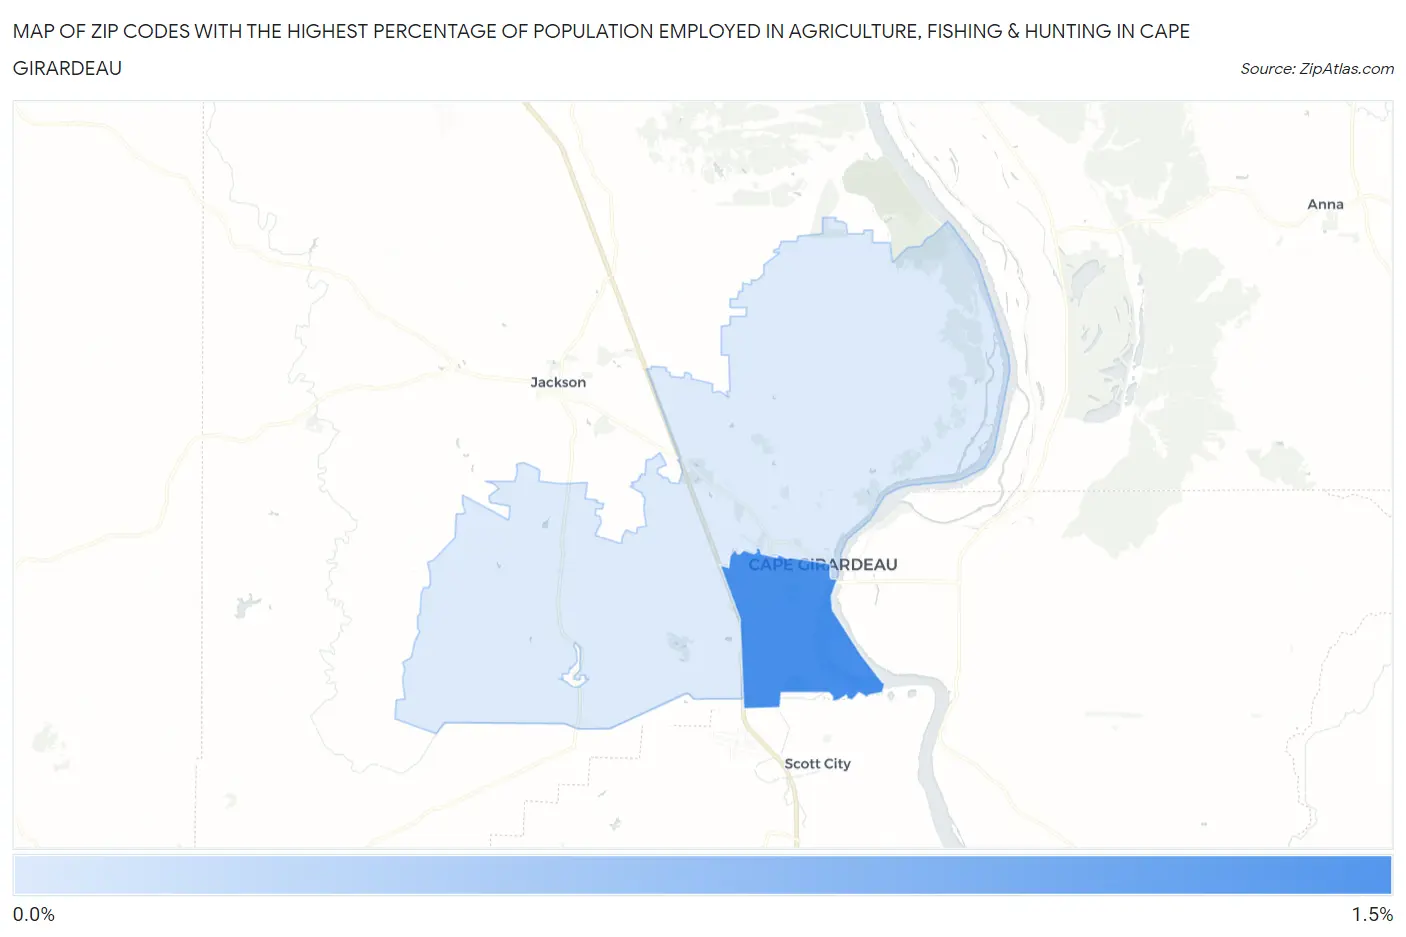
Zip Codes with the Highest Percentage of Population Employed in Agriculture, Fishing & Hunting in Cape Girardeau, MO
RELATED REPORTS & OPTIONS
Agriculture, Fishing & Hunting
Cape Girardeau
Compare Zip Codes
Map of Zip Codes with the Highest Percentage of Population Employed in Agriculture, Fishing & Hunting in Cape Girardeau
0.0%
1.5%
Zip Codes with the Highest Percentage of Population Employed in Agriculture, Fishing & Hunting in Cape Girardeau, MO
| Zip Code | % Employed | vs State | vs National | |
| 1. | 63703 | 1.1% | 1.4%(-0.332)#613 | 1.2%(-0.088)#15,754 |
| 2. | 63701 | 0.26% | 1.4%(-1.18)#772 | 1.2%(-0.936)#21,605 |
1
Common Questions
What are the Top Zip Codes with the Highest Percentage of Population Employed in Agriculture, Fishing & Hunting in Cape Girardeau, MO?
Top Zip Codes with the Highest Percentage of Population Employed in Agriculture, Fishing & Hunting in Cape Girardeau, MO are:
What zip code has the Highest Percentage of Population Employed in Agriculture, Fishing & Hunting in Cape Girardeau, MO?
63703 has the Highest Percentage of Population Employed in Agriculture, Fishing & Hunting in Cape Girardeau, MO with 1.1%.
What is the Percentage of Population Employed in Agriculture, Fishing & Hunting in Cape Girardeau, MO?
Percentage of Population Employed in Agriculture, Fishing & Hunting in Cape Girardeau is 0.26%.
What is the Percentage of Population Employed in Agriculture, Fishing & Hunting in Missouri?
Percentage of Population Employed in Agriculture, Fishing & Hunting in Missouri is 1.4%.
What is the Percentage of Population Employed in Agriculture, Fishing & Hunting in the United States?
Percentage of Population Employed in Agriculture, Fishing & Hunting in the United States is 1.2%.