Zip Codes with the Highest Percentage of Renter-Occupied Units in Blue Springs, MO
RELATED REPORTS & OPTIONS
Highest Renter-Occupied
Blue Springs
Compare Zip Codes
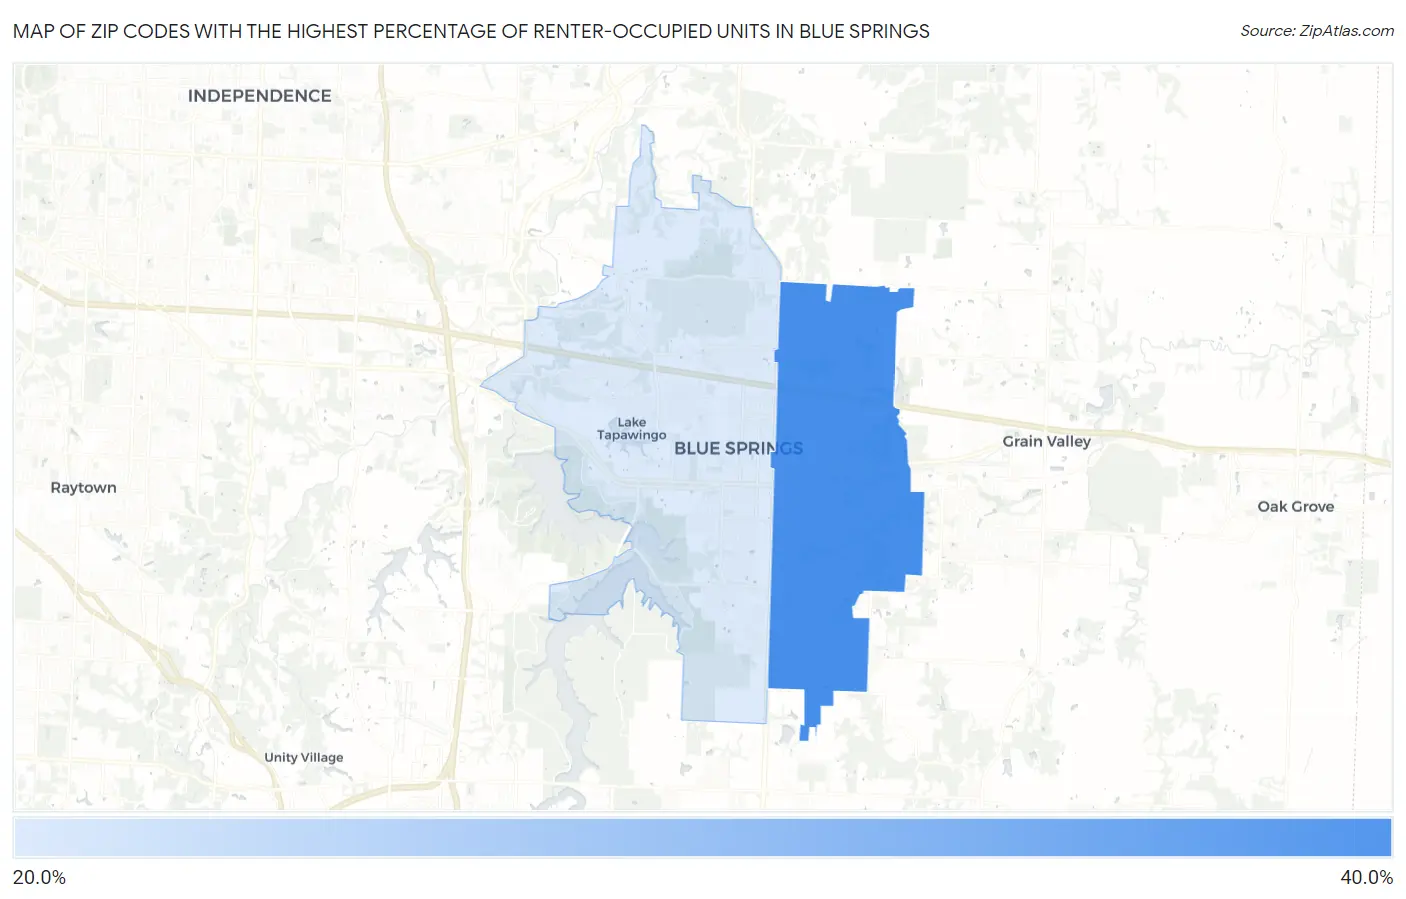
Map of Zip Codes with the Highest Percentage of Renter-Occupied Units in Blue Springs
0.0%
40.0%
Zip Codes with the Highest Percentage of Renter-Occupied Units in Blue Springs, MO
| Zip Code | % Renter-Occupied | vs State | vs National | |
| 1. | 64014 | 31.6% | 32.4%(-0.788)#240 | 35.2%(-3.57)#9,080 |
| 2. | 64015 | 27.8% | 32.4%(-4.61)#328 | 35.2%(-7.40)#11,541 |
1
Common Questions
What are the Top Zip Codes with the Highest Percentage of Renter-Occupied Units in Blue Springs, MO?
Top Zip Codes with the Highest Percentage of Renter-Occupied Units in Blue Springs, MO are:
What zip code has the Highest Percentage of Renter-Occupied Units in Blue Springs, MO?
64014 has the Highest Percentage of Renter-Occupied Units in Blue Springs, MO with 31.6%.
What is the Percentage of Renter-Occupied Units in Blue Springs, MO?
Percentage of Renter-Occupied Units in Blue Springs is 31.1%.
What is the Percentage of Renter-Occupied Units in Missouri?
Percentage of Renter-Occupied Units in Missouri is 32.4%.
What is the Percentage of Renter-Occupied Units in the United States?
Percentage of Renter-Occupied Units in the United States is 35.2%.