Zip Codes with the Highest Percentage of Population Employed in Professional & Scientific Services in Utica, MI
RELATED REPORTS & OPTIONS
Professional & Scientific Services
Utica
Compare Zip Codes
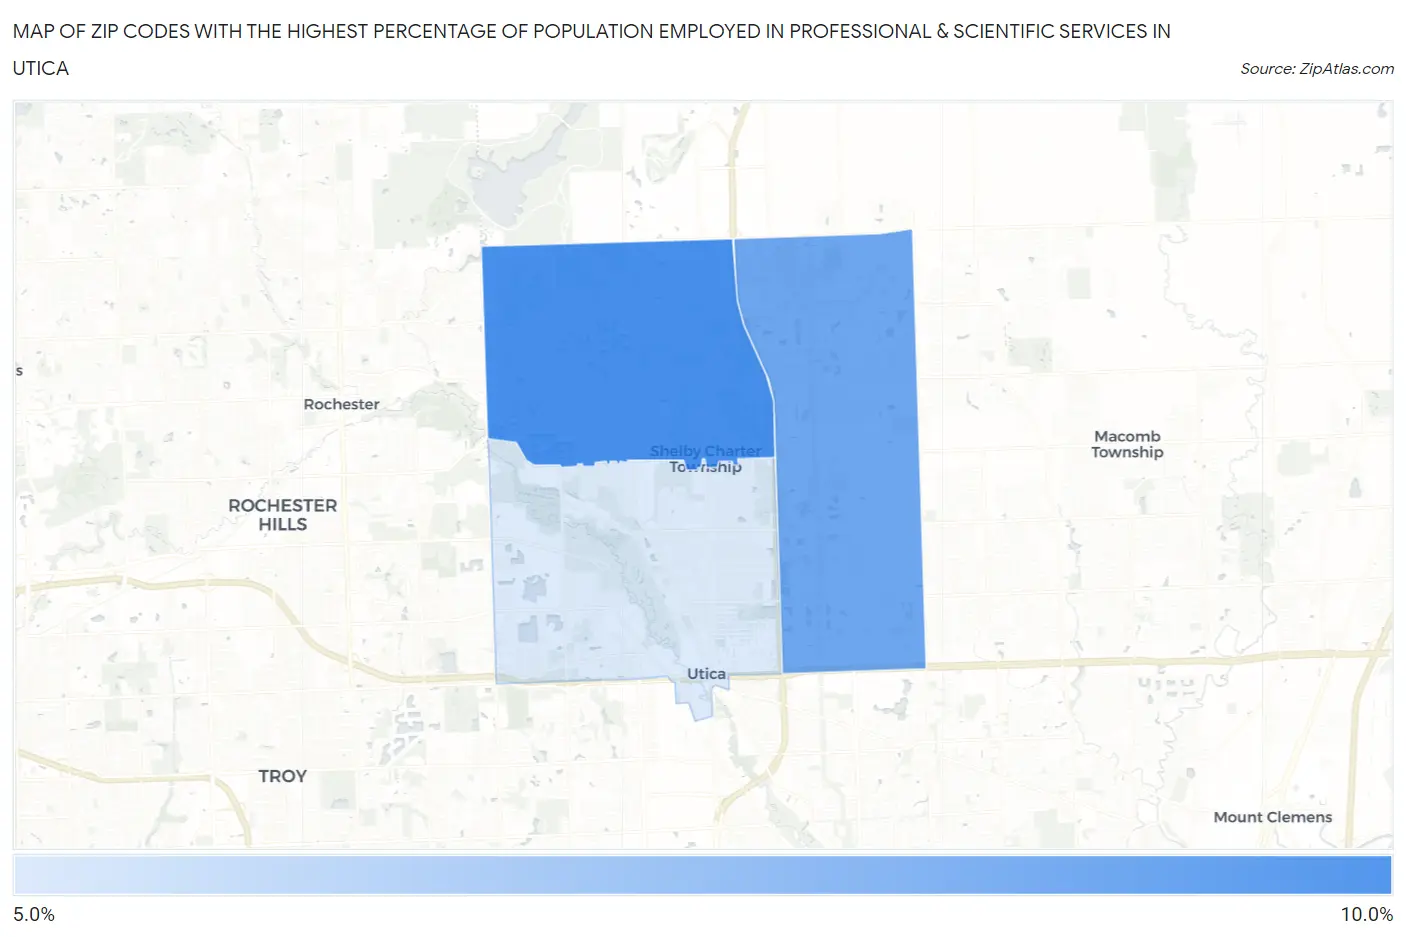
Map of Zip Codes with the Highest Percentage of Population Employed in Professional & Scientific Services in Utica
5.6%
8.1%
Zip Codes with the Highest Percentage of Population Employed in Professional & Scientific Services in Utica, MI
| Zip Code | % Employed | vs State | vs National | |
| 1. | 48316 | 8.1% | 6.0%(+2.08)#127 | 7.8%(+0.236)#6,552 |
| 2. | 48315 | 7.4% | 6.0%(+1.42)#147 | 7.8%(-0.424)#7,464 |
| 3. | 48317 | 5.6% | 6.0%(-0.388)#263 | 7.8%(-2.23)#10,795 |
1
Common Questions
What are the Top Zip Codes with the Highest Percentage of Population Employed in Professional & Scientific Services in Utica, MI?
Top Zip Codes with the Highest Percentage of Population Employed in Professional & Scientific Services in Utica, MI are:
What zip code has the Highest Percentage of Population Employed in Professional & Scientific Services in Utica, MI?
48316 has the Highest Percentage of Population Employed in Professional & Scientific Services in Utica, MI with 8.1%.
What is the Percentage of Population Employed in Professional & Scientific Services in Utica, MI?
Percentage of Population Employed in Professional & Scientific Services in Utica is 4.9%.
What is the Percentage of Population Employed in Professional & Scientific Services in Michigan?
Percentage of Population Employed in Professional & Scientific Services in Michigan is 6.0%.
What is the Percentage of Population Employed in Professional & Scientific Services in the United States?
Percentage of Population Employed in Professional & Scientific Services in the United States is 7.8%.