Zip Codes with the Highest Percentage of Population Employed in Farming, Fishing & Forestry in Traverse City, MI
RELATED REPORTS & OPTIONS
Farming, Fishing & Forestry
Traverse City
Compare Zip Codes
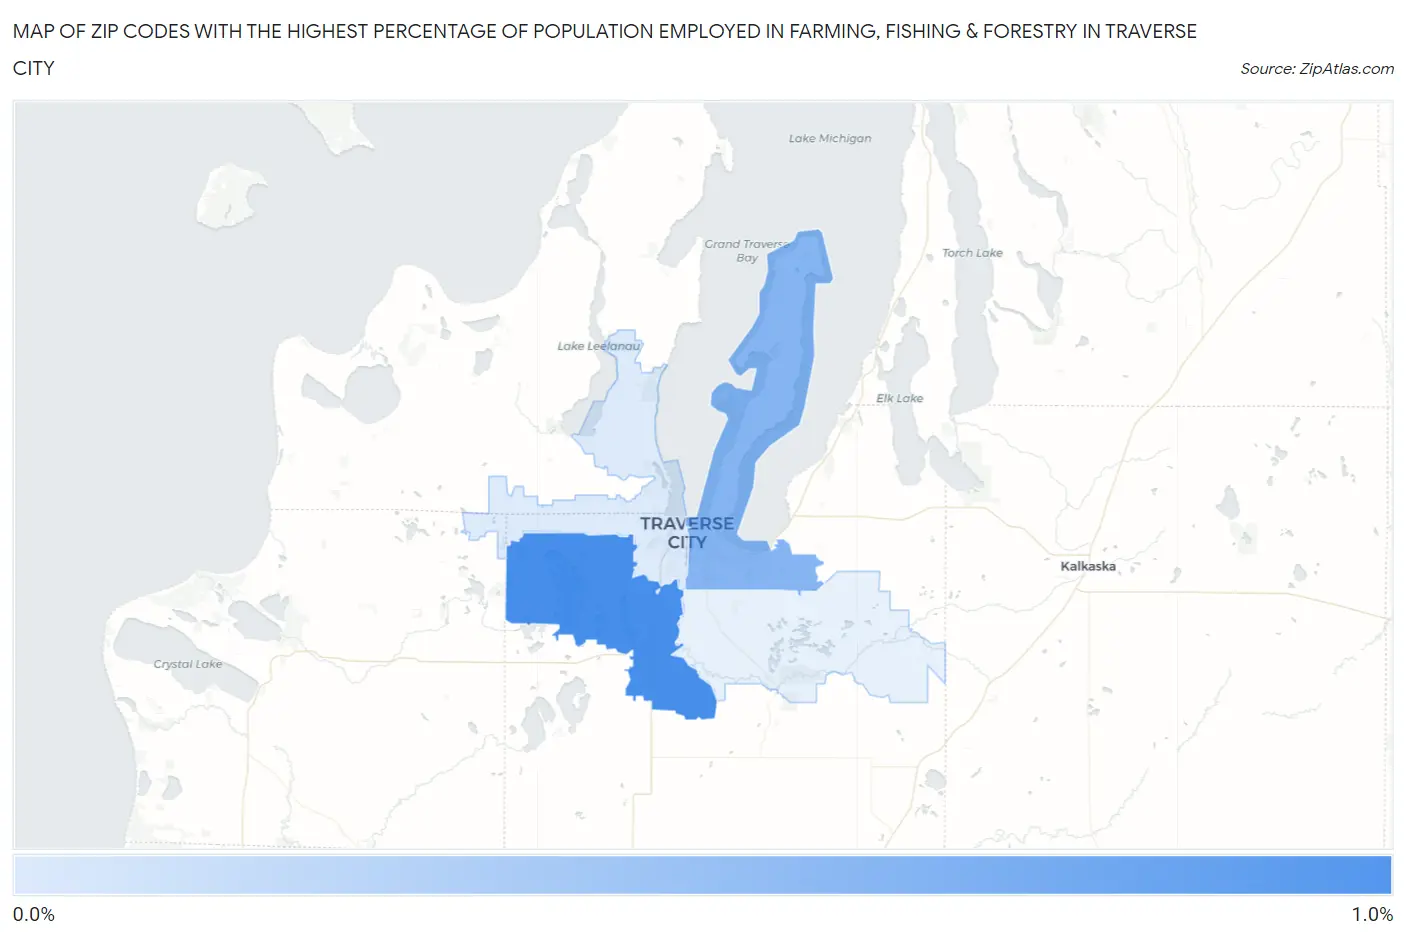
Map of Zip Codes with the Highest Percentage of Population Employed in Farming, Fishing & Forestry in Traverse City
0.0%
1.0%
Zip Codes with the Highest Percentage of Population Employed in Farming, Fishing & Forestry in Traverse City, MI
| Zip Code | % Employed | vs State | vs National | |
| 1. | 49685 | 0.96% | 0.47%(+0.496)#293 | 0.61%(+0.357)#9,912 |
| 2. | 49686 | 0.58% | 0.47%(+0.117)#395 | 0.61%(-0.022)#12,171 |
| 3. | 49684 | 0.063% | 0.47%(-0.403)#657 | 0.61%(-0.542)#18,408 |
1
Common Questions
What are the Top 3 Zip Codes with the Highest Percentage of Population Employed in Farming, Fishing & Forestry in Traverse City, MI?
Top 3 Zip Codes with the Highest Percentage of Population Employed in Farming, Fishing & Forestry in Traverse City, MI are:
What zip code has the Highest Percentage of Population Employed in Farming, Fishing & Forestry in Traverse City, MI?
49685 has the Highest Percentage of Population Employed in Farming, Fishing & Forestry in Traverse City, MI with 0.96%.
What is the Percentage of Population Employed in Farming, Fishing & Forestry in Michigan?
Percentage of Population Employed in Farming, Fishing & Forestry in Michigan is 0.47%.
What is the Percentage of Population Employed in Farming, Fishing & Forestry in the United States?
Percentage of Population Employed in Farming, Fishing & Forestry in the United States is 0.61%.