Zip Codes with the Highest Percentage of Population Employed in Farming, Fishing & Forestry in Muskegon, MI
RELATED REPORTS & OPTIONS
Farming, Fishing & Forestry
Muskegon
Compare Zip Codes
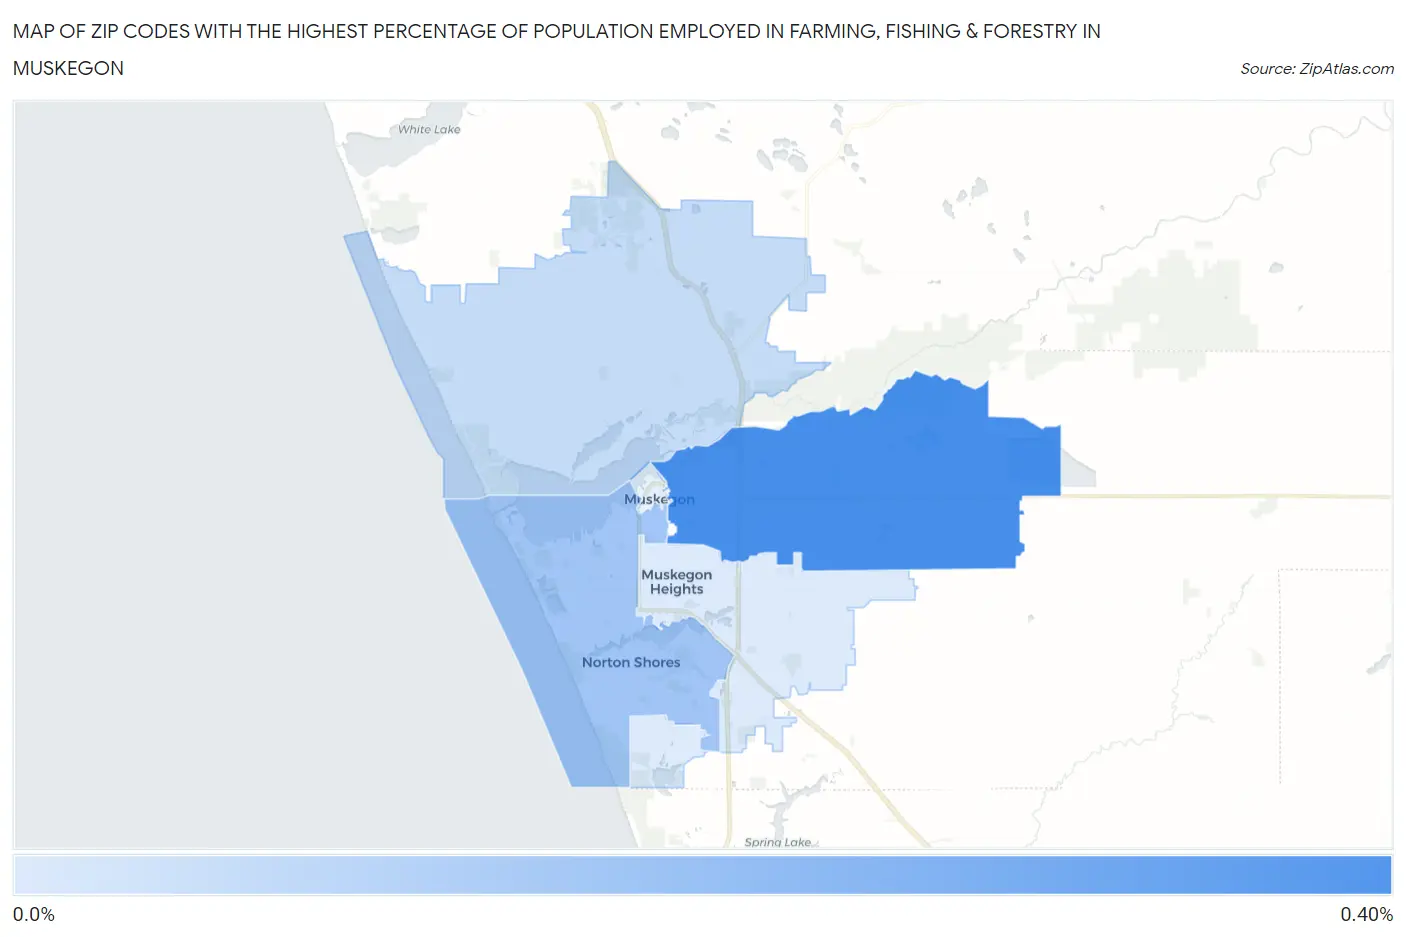
Map of Zip Codes with the Highest Percentage of Population Employed in Farming, Fishing & Forestry in Muskegon
0.0%
0.40%
Zip Codes with the Highest Percentage of Population Employed in Farming, Fishing & Forestry in Muskegon, MI
| Zip Code | % Employed | vs State | vs National | |
| 1. | 49442 | 0.33% | 0.47%(-0.139)#494 | 0.61%(-0.278)#14,509 |
| 2. | 49441 | 0.18% | 0.47%(-0.284)#576 | 0.61%(-0.423)#16,388 |
| 3. | 49445 | 0.12% | 0.47%(-0.344)#615 | 0.61%(-0.483)#17,398 |
| 4. | 49444 | 0.085% | 0.47%(-0.382)#644 | 0.61%(-0.521)#18,029 |
1
Common Questions
What are the Top 3 Zip Codes with the Highest Percentage of Population Employed in Farming, Fishing & Forestry in Muskegon, MI?
Top 3 Zip Codes with the Highest Percentage of Population Employed in Farming, Fishing & Forestry in Muskegon, MI are:
What zip code has the Highest Percentage of Population Employed in Farming, Fishing & Forestry in Muskegon, MI?
49442 has the Highest Percentage of Population Employed in Farming, Fishing & Forestry in Muskegon, MI with 0.33%.
What is the Percentage of Population Employed in Farming, Fishing & Forestry in Muskegon, MI?
Percentage of Population Employed in Farming, Fishing & Forestry in Muskegon is 0.31%.
What is the Percentage of Population Employed in Farming, Fishing & Forestry in Michigan?
Percentage of Population Employed in Farming, Fishing & Forestry in Michigan is 0.47%.
What is the Percentage of Population Employed in Farming, Fishing & Forestry in the United States?
Percentage of Population Employed in Farming, Fishing & Forestry in the United States is 0.61%.