Zip Codes with the Highest Percentage of Population Employed in Food Preparation & Serving in Laurel, MD
RELATED REPORTS & OPTIONS
Food Preparation & Serving
Laurel
Compare Zip Codes
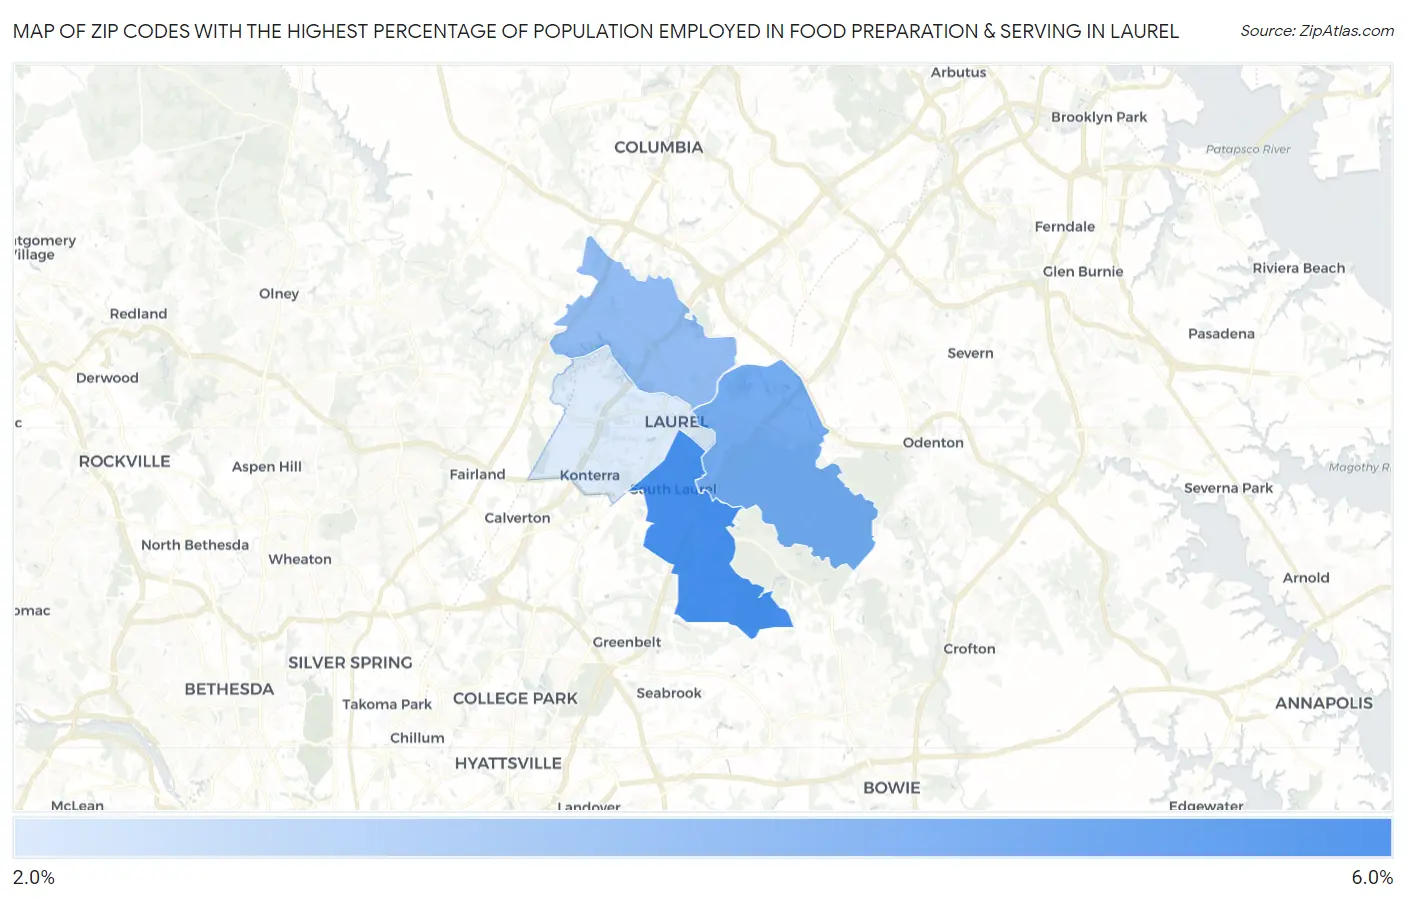
Map of Zip Codes with the Highest Percentage of Population Employed in Food Preparation & Serving in Laurel
2.8%
5.6%
Zip Codes with the Highest Percentage of Population Employed in Food Preparation & Serving in Laurel, MD
| Zip Code | % Employed | vs State | vs National | |
| 1. | 20708 | 5.6% | 4.4%(+1.23)#109 | 5.3%(+0.326)#10,668 |
| 2. | 20724 | 4.7% | 4.4%(+0.360)#162 | 5.3%(-0.546)#13,991 |
| 3. | 20723 | 4.2% | 4.4%(-0.195)#200 | 5.3%(-1.10)#16,380 |
| 4. | 20707 | 2.8% | 4.4%(-1.60)#303 | 5.3%(-2.51)#22,131 |
1
Common Questions
What are the Top 3 Zip Codes with the Highest Percentage of Population Employed in Food Preparation & Serving in Laurel, MD?
Top 3 Zip Codes with the Highest Percentage of Population Employed in Food Preparation & Serving in Laurel, MD are:
What zip code has the Highest Percentage of Population Employed in Food Preparation & Serving in Laurel, MD?
20708 has the Highest Percentage of Population Employed in Food Preparation & Serving in Laurel, MD with 5.6%.
What is the Percentage of Population Employed in Food Preparation & Serving in Laurel, MD?
Percentage of Population Employed in Food Preparation & Serving in Laurel is 3.3%.
What is the Percentage of Population Employed in Food Preparation & Serving in Maryland?
Percentage of Population Employed in Food Preparation & Serving in Maryland is 4.4%.
What is the Percentage of Population Employed in Food Preparation & Serving in the United States?
Percentage of Population Employed in Food Preparation & Serving in the United States is 5.3%.