Zip Codes with the Highest Percentage of Population Employed in Agriculture, Fishing & Hunting in Springfield, MA
RELATED REPORTS & OPTIONS
Agriculture, Fishing & Hunting
Springfield
Compare Zip Codes
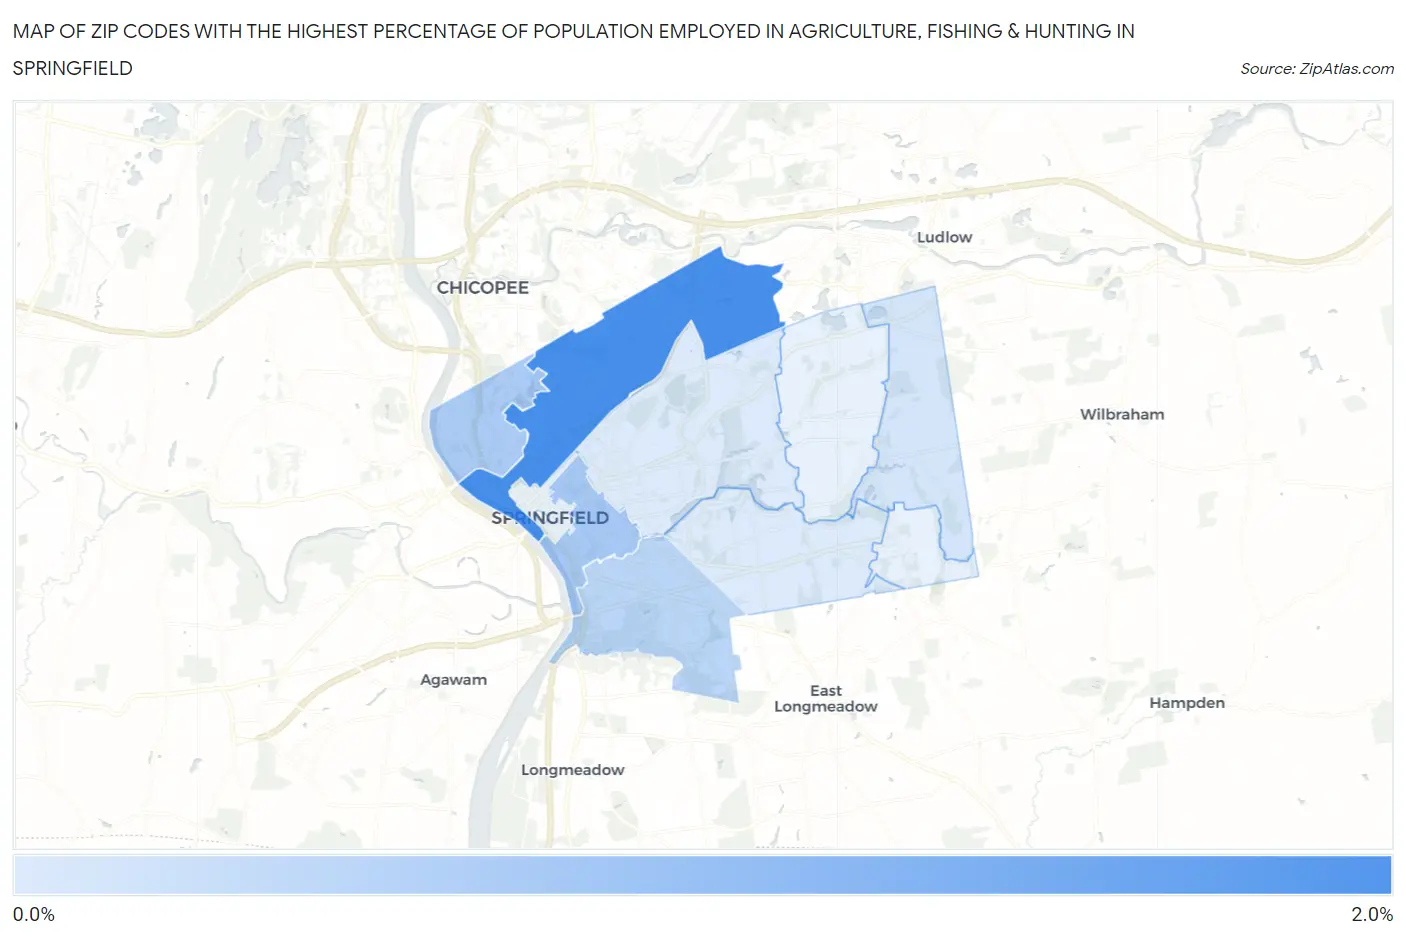
Map of Zip Codes with the Highest Percentage of Population Employed in Agriculture, Fishing & Hunting in Springfield
0.0%
2.0%
Zip Codes with the Highest Percentage of Population Employed in Agriculture, Fishing & Hunting in Springfield, MA
| Zip Code | % Employed | vs State | vs National | |
| 1. | 01104 | 1.7% | 0.39%(+1.32)#64 | 1.2%(+0.519)#13,595 |
| 2. | 01105 | 0.69% | 0.39%(+0.299)#155 | 1.2%(-0.505)#17,872 |
| 3. | 01107 | 0.64% | 0.39%(+0.244)#163 | 1.2%(-0.560)#18,205 |
| 4. | 01108 | 0.45% | 0.39%(+0.057)#201 | 1.2%(-0.748)#19,688 |
| 5. | 01129 | 0.19% | 0.39%(-0.209)#285 | 1.2%(-1.01)#22,519 |
| 6. | 01109 | 0.080% | 0.39%(-0.315)#332 | 1.2%(-1.12)#23,961 |
| 7. | 01118 | 0.080% | 0.39%(-0.315)#333 | 1.2%(-1.12)#23,962 |
1
Common Questions
What are the Top 5 Zip Codes with the Highest Percentage of Population Employed in Agriculture, Fishing & Hunting in Springfield, MA?
Top 5 Zip Codes with the Highest Percentage of Population Employed in Agriculture, Fishing & Hunting in Springfield, MA are:
What zip code has the Highest Percentage of Population Employed in Agriculture, Fishing & Hunting in Springfield, MA?
01104 has the Highest Percentage of Population Employed in Agriculture, Fishing & Hunting in Springfield, MA with 1.7%.
What is the Percentage of Population Employed in Agriculture, Fishing & Hunting in Springfield, MA?
Percentage of Population Employed in Agriculture, Fishing & Hunting in Springfield is 0.46%.
What is the Percentage of Population Employed in Agriculture, Fishing & Hunting in Massachusetts?
Percentage of Population Employed in Agriculture, Fishing & Hunting in Massachusetts is 0.39%.
What is the Percentage of Population Employed in Agriculture, Fishing & Hunting in the United States?
Percentage of Population Employed in Agriculture, Fishing & Hunting in the United States is 1.2%.