Zip Codes with the Highest Percentage of Population Employed in Farming, Fishing & Forestry in Springfield, MA
RELATED REPORTS & OPTIONS
Farming, Fishing & Forestry
Springfield
Compare Zip Codes
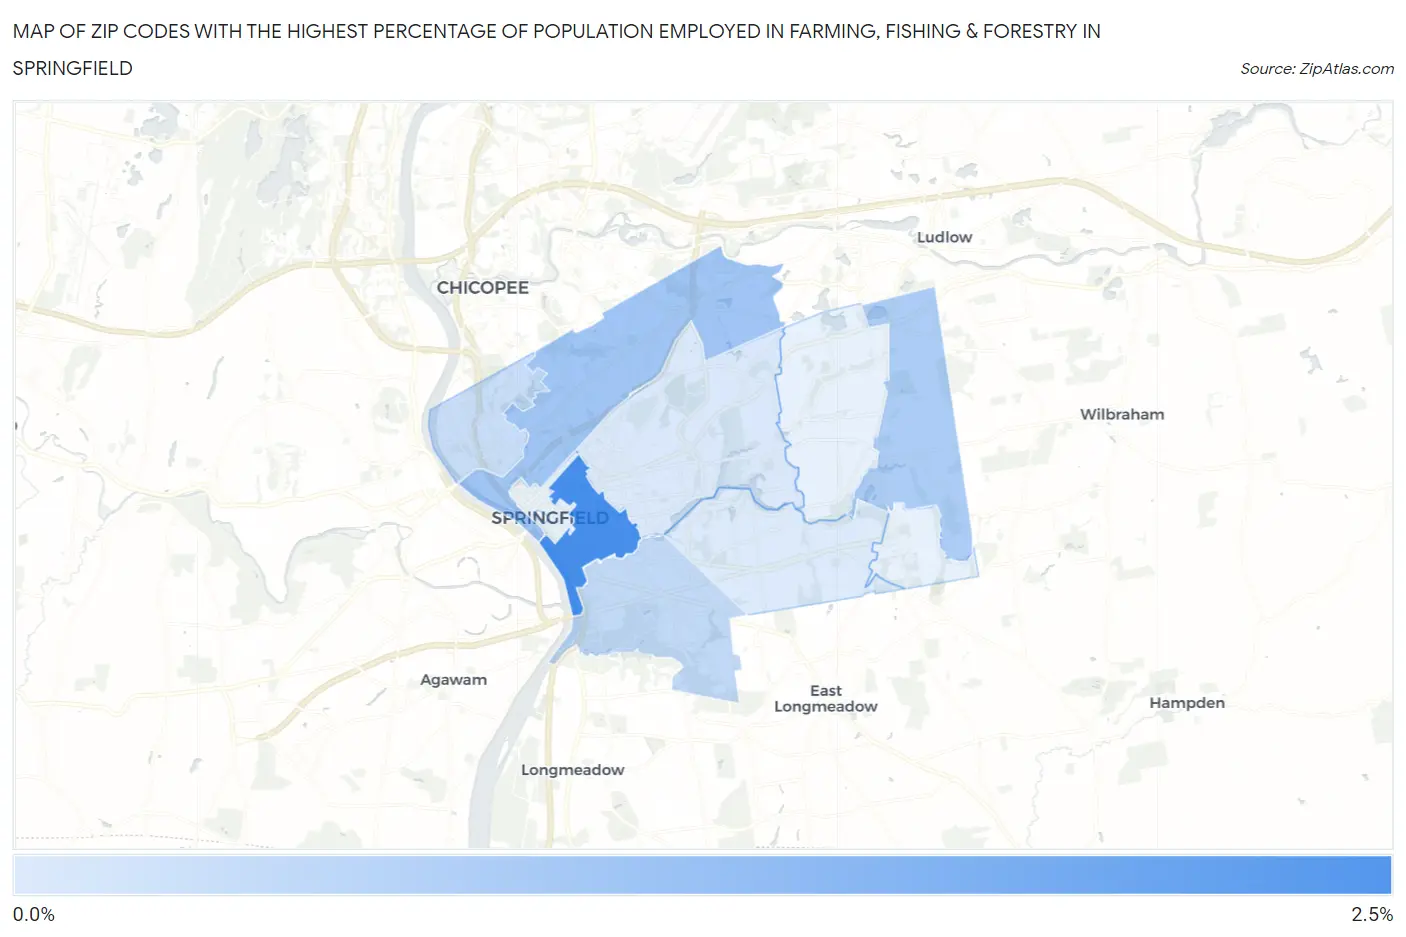
Map of Zip Codes with the Highest Percentage of Population Employed in Farming, Fishing & Forestry in Springfield
0.0%
2.5%
Zip Codes with the Highest Percentage of Population Employed in Farming, Fishing & Forestry in Springfield, MA
| Zip Code | % Employed | vs State | vs National | |
| 1. | 01105 | 2.2% | 0.22%(+1.98)#23 | 0.61%(+1.59)#6,144 |
| 2. | 01104 | 0.92% | 0.22%(+0.706)#60 | 0.61%(+0.316)#10,121 |
| 3. | 01129 | 0.74% | 0.22%(+0.529)#78 | 0.61%(+0.139)#11,107 |
| 4. | 01108 | 0.45% | 0.22%(+0.236)#118 | 0.61%(-0.154)#13,274 |
| 5. | 01107 | 0.37% | 0.22%(+0.153)#133 | 0.61%(-0.237)#14,058 |
| 6. | 01109 | 0.12% | 0.22%(-0.099)#216 | 0.61%(-0.490)#17,493 |
| 7. | 01118 | 0.080% | 0.22%(-0.135)#226 | 0.61%(-0.525)#18,118 |
1
Common Questions
What are the Top 5 Zip Codes with the Highest Percentage of Population Employed in Farming, Fishing & Forestry in Springfield, MA?
Top 5 Zip Codes with the Highest Percentage of Population Employed in Farming, Fishing & Forestry in Springfield, MA are:
What zip code has the Highest Percentage of Population Employed in Farming, Fishing & Forestry in Springfield, MA?
01105 has the Highest Percentage of Population Employed in Farming, Fishing & Forestry in Springfield, MA with 2.2%.
What is the Percentage of Population Employed in Farming, Fishing & Forestry in Springfield, MA?
Percentage of Population Employed in Farming, Fishing & Forestry in Springfield is 0.44%.
What is the Percentage of Population Employed in Farming, Fishing & Forestry in Massachusetts?
Percentage of Population Employed in Farming, Fishing & Forestry in Massachusetts is 0.22%.
What is the Percentage of Population Employed in Farming, Fishing & Forestry in the United States?
Percentage of Population Employed in Farming, Fishing & Forestry in the United States is 0.61%.