Zip Codes with the Highest Percentage of Population Employed in Arts, Entertainment & Recreation in Quincy, MA
RELATED REPORTS & OPTIONS
Arts, Entertainment & Recreation
Quincy
Compare Zip Codes
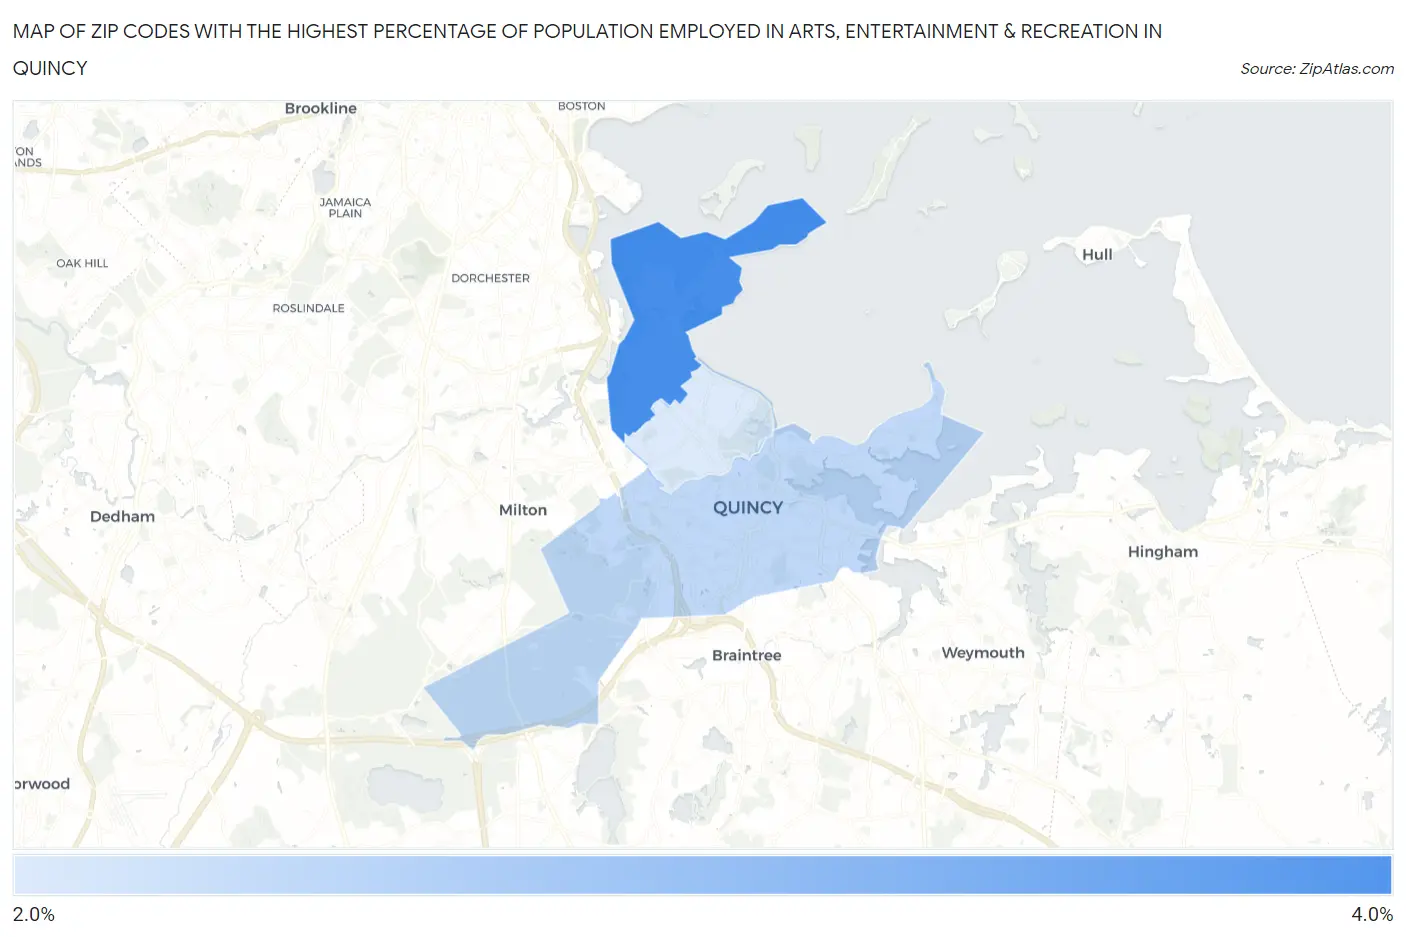
Map of Zip Codes with the Highest Percentage of Population Employed in Arts, Entertainment & Recreation in Quincy
0.0%
4.0%
Zip Codes with the Highest Percentage of Population Employed in Arts, Entertainment & Recreation in Quincy, MA
| Zip Code | % Employed | vs State | vs National | |
| 1. | 02171 | 3.0% | 2.0%(+1.06)#117 | 2.1%(+0.952)#5,248 |
| 2. | 02169 | 2.3% | 2.0%(+0.304)#197 | 2.1%(+0.199)#8,215 |
| 3. | 02170 | 2.1% | 2.0%(+0.113)#222 | 2.1%(+0.008)#9,270 |
1
Common Questions
What are the Top Zip Codes with the Highest Percentage of Population Employed in Arts, Entertainment & Recreation in Quincy, MA?
Top Zip Codes with the Highest Percentage of Population Employed in Arts, Entertainment & Recreation in Quincy, MA are:
What zip code has the Highest Percentage of Population Employed in Arts, Entertainment & Recreation in Quincy, MA?
02171 has the Highest Percentage of Population Employed in Arts, Entertainment & Recreation in Quincy, MA with 3.0%.
What is the Percentage of Population Employed in Arts, Entertainment & Recreation in Quincy, MA?
Percentage of Population Employed in Arts, Entertainment & Recreation in Quincy is 2.4%.
What is the Percentage of Population Employed in Arts, Entertainment & Recreation in Massachusetts?
Percentage of Population Employed in Arts, Entertainment & Recreation in Massachusetts is 2.0%.
What is the Percentage of Population Employed in Arts, Entertainment & Recreation in the United States?
Percentage of Population Employed in Arts, Entertainment & Recreation in the United States is 2.1%.