Zip Codes with the Highest Percentage of Population Employed in Transportation & Warehousing in Louisville, KY
RELATED REPORTS & OPTIONS
Transportation & Warehousing
Louisville
Compare Zip Codes
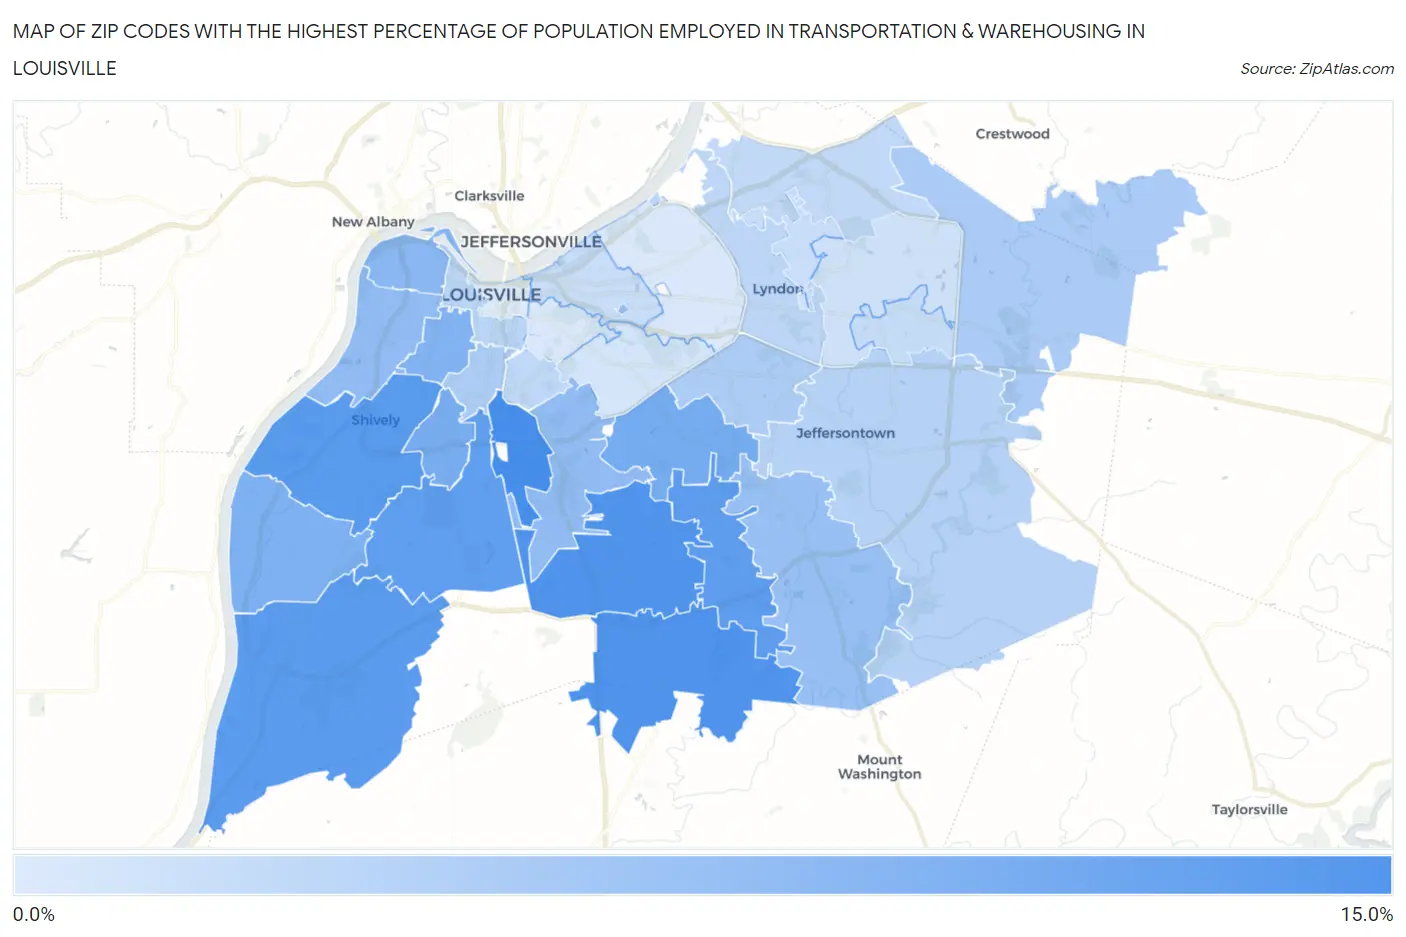
Map of Zip Codes with the Highest Percentage of Population Employed in Transportation & Warehousing in Louisville
3.2%
14.5%
Zip Codes with the Highest Percentage of Population Employed in Transportation & Warehousing in Louisville, KY
| Zip Code | % Employed | vs State | vs National | |
| 1. | 40209 | 14.5% | 5.7%(+8.79)#52 | 4.9%(+9.59)#1,158 |
| 2. | 40219 | 13.9% | 5.7%(+8.11)#56 | 4.9%(+8.91)#1,311 |
| 3. | 40229 | 13.7% | 5.7%(+7.97)#58 | 4.9%(+8.77)#1,340 |
| 4. | 40216 | 13.2% | 5.7%(+7.44)#64 | 4.9%(+8.24)#1,490 |
| 5. | 40272 | 12.8% | 5.7%(+7.10)#66 | 4.9%(+7.90)#1,577 |
| 6. | 40228 | 12.8% | 5.7%(+7.02)#68 | 4.9%(+7.82)#1,605 |
| 7. | 40214 | 12.5% | 5.7%(+6.71)#71 | 4.9%(+7.51)#1,700 |
| 8. | 40218 | 11.0% | 5.7%(+5.21)#84 | 4.9%(+6.01)#2,341 |
| 9. | 40215 | 10.8% | 5.7%(+5.09)#86 | 4.9%(+5.89)#2,401 |
| 10. | 40258 | 10.3% | 5.7%(+4.54)#94 | 4.9%(+5.34)#2,715 |
| 11. | 40210 | 10.0% | 5.7%(+4.26)#97 | 4.9%(+5.05)#2,881 |
| 12. | 40212 | 9.3% | 5.7%(+3.52)#109 | 4.9%(+4.32)#3,427 |
| 13. | 40213 | 8.9% | 5.7%(+3.15)#123 | 4.9%(+3.95)#3,812 |
| 14. | 40211 | 8.8% | 5.7%(+3.05)#129 | 4.9%(+3.84)#3,939 |
| 15. | 40291 | 8.3% | 5.7%(+2.58)#139 | 4.9%(+3.37)#4,492 |
| 16. | 40280 | 8.2% | 5.7%(+2.48)#140 | 4.9%(+3.28)#4,606 |
| 17. | 40245 | 6.9% | 5.7%(+1.16)#175 | 4.9%(+1.96)#6,750 |
| 18. | 40208 | 6.7% | 5.7%(+0.963)#185 | 4.9%(+1.76)#7,132 |
| 19. | 40220 | 6.7% | 5.7%(+0.933)#187 | 4.9%(+1.73)#7,200 |
| 20. | 40299 | 6.1% | 5.7%(+0.316)#219 | 4.9%(+1.12)#8,642 |
| 21. | 40203 | 5.7% | 5.7%(-0.071)#245 | 4.9%(+0.728)#9,736 |
| 22. | 40222 | 5.6% | 5.7%(-0.172)#251 | 4.9%(+0.626)#10,025 |
| 23. | 40217 | 5.4% | 5.7%(-0.385)#261 | 4.9%(+0.414)#10,713 |
| 24. | 40241 | 5.3% | 5.7%(-0.459)#266 | 4.9%(+0.340)#10,955 |
| 25. | 40243 | 4.9% | 5.7%(-0.832)#283 | 4.9%(-0.033)#12,227 |
| 26. | 40206 | 4.7% | 5.7%(-1.01)#296 | 4.9%(-0.216)#12,915 |
| 27. | 40242 | 4.7% | 5.7%(-1.03)#299 | 4.9%(-0.230)#12,975 |
| 28. | 40223 | 4.2% | 5.7%(-1.59)#343 | 4.9%(-0.796)#15,251 |
| 29. | 40205 | 4.0% | 5.7%(-1.78)#355 | 4.9%(-0.978)#16,044 |
| 30. | 40204 | 3.4% | 5.7%(-2.38)#406 | 4.9%(-1.58)#18,629 |
| 31. | 40207 | 3.4% | 5.7%(-2.39)#409 | 4.9%(-1.60)#18,714 |
| 32. | 40202 | 3.2% | 5.7%(-2.52)#416 | 4.9%(-1.72)#19,249 |
1
Common Questions
What are the Top 10 Zip Codes with the Highest Percentage of Population Employed in Transportation & Warehousing in Louisville, KY?
Top 10 Zip Codes with the Highest Percentage of Population Employed in Transportation & Warehousing in Louisville, KY are:
What zip code has the Highest Percentage of Population Employed in Transportation & Warehousing in Louisville, KY?
40209 has the Highest Percentage of Population Employed in Transportation & Warehousing in Louisville, KY with 14.5%.
What is the Percentage of Population Employed in Transportation & Warehousing in Louisville, KY?
Percentage of Population Employed in Transportation & Warehousing in Louisville is 9.1%.
What is the Percentage of Population Employed in Transportation & Warehousing in Kentucky?
Percentage of Population Employed in Transportation & Warehousing in Kentucky is 5.7%.
What is the Percentage of Population Employed in Transportation & Warehousing in the United States?
Percentage of Population Employed in Transportation & Warehousing in the United States is 4.9%.