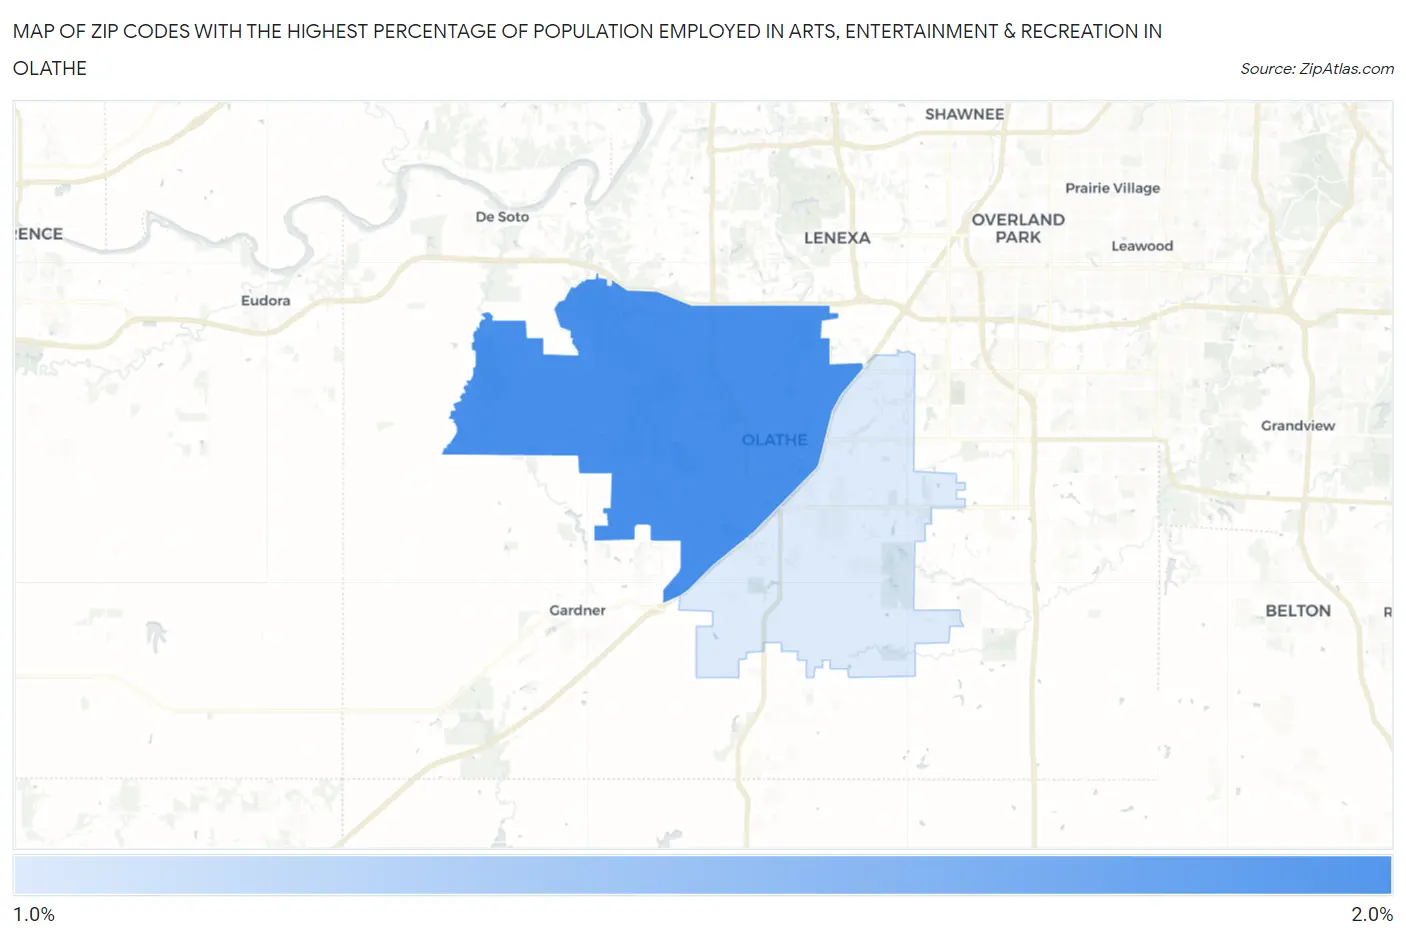
Zip Codes with the Highest Percentage of Population Employed in Arts, Entertainment & Recreation in Olathe, KS
RELATED REPORTS & OPTIONS
Arts, Entertainment & Recreation
Olathe
Compare Zip Codes
Map of Zip Codes with the Highest Percentage of Population Employed in Arts, Entertainment & Recreation in Olathe
0.0%
2.0%
Zip Codes with the Highest Percentage of Population Employed in Arts, Entertainment & Recreation in Olathe, KS
| Zip Code | % Employed | vs State | vs National | |
| 1. | 66061 | 1.9% | 1.7%(+0.171)#148 | 2.1%(-0.164)#10,274 |
| 2. | 66062 | 1.7% | 1.7%(-0.067)#187 | 2.1%(-0.402)#11,873 |
1
Common Questions
What are the Top Zip Codes with the Highest Percentage of Population Employed in Arts, Entertainment & Recreation in Olathe, KS?
Top Zip Codes with the Highest Percentage of Population Employed in Arts, Entertainment & Recreation in Olathe, KS are:
What zip code has the Highest Percentage of Population Employed in Arts, Entertainment & Recreation in Olathe, KS?
66061 has the Highest Percentage of Population Employed in Arts, Entertainment & Recreation in Olathe, KS with 1.9%.
What is the Percentage of Population Employed in Arts, Entertainment & Recreation in Olathe, KS?
Percentage of Population Employed in Arts, Entertainment & Recreation in Olathe is 1.8%.
What is the Percentage of Population Employed in Arts, Entertainment & Recreation in Kansas?
Percentage of Population Employed in Arts, Entertainment & Recreation in Kansas is 1.7%.
What is the Percentage of Population Employed in Arts, Entertainment & Recreation in the United States?
Percentage of Population Employed in Arts, Entertainment & Recreation in the United States is 2.1%.