Zip Codes with the Highest Percentage of Population Employed in Agriculture, Fishing & Hunting in Indiana
RELATED REPORTS & OPTIONS
Agriculture, Fishing & Hunting
Indiana
Compare Zip Codes
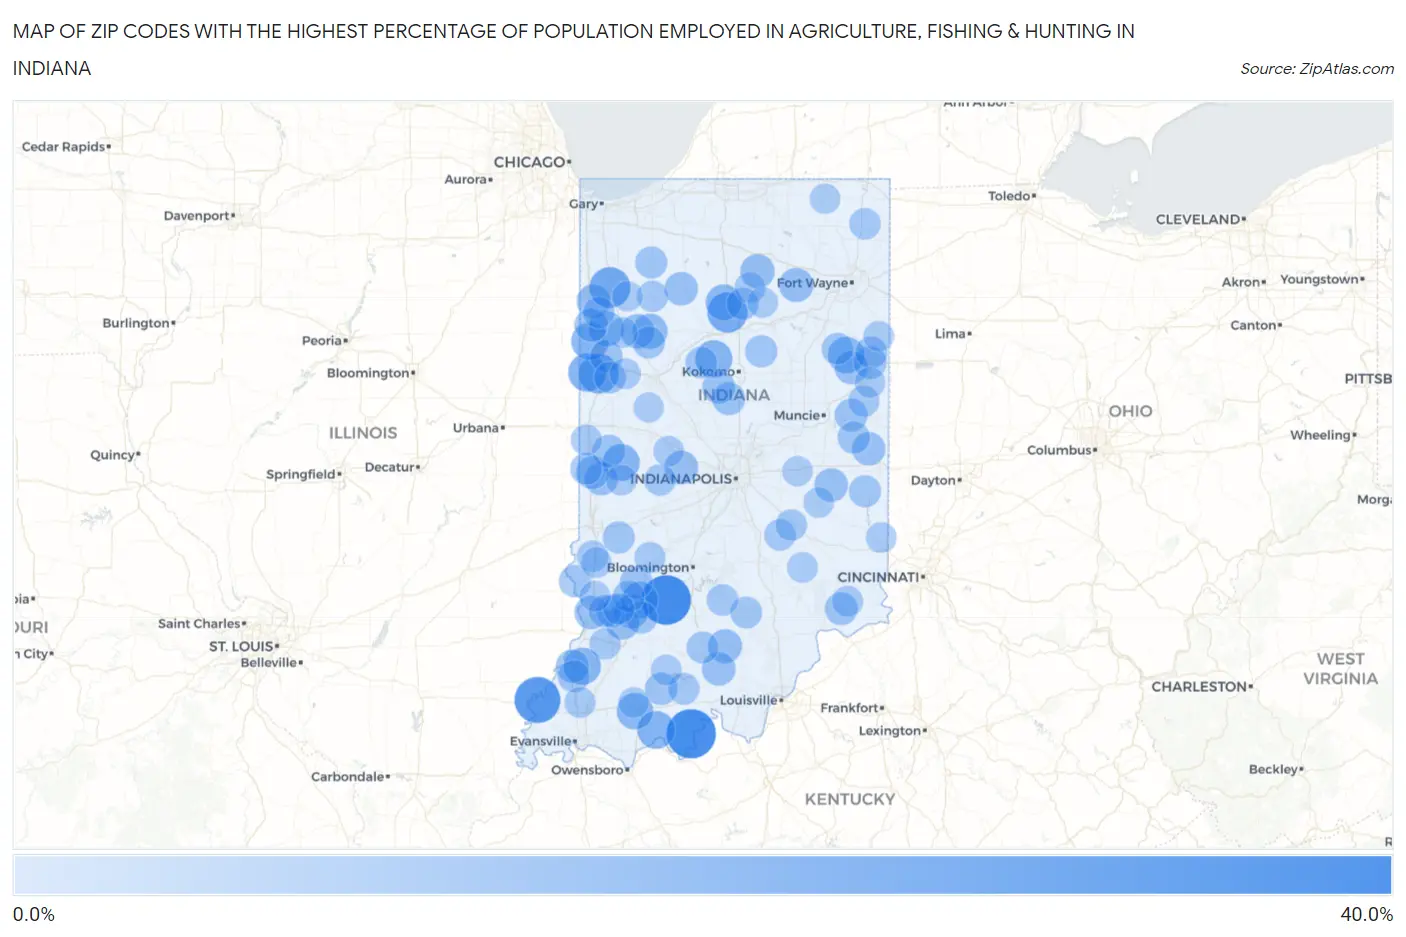
Map of Zip Codes with the Highest Percentage of Population Employed in Agriculture, Fishing & Hunting in Indiana
0.0%
40.0%
Zip Codes with the Highest Percentage of Population Employed in Agriculture, Fishing & Hunting in Indiana
| Zip Code | % Employed | vs State | vs National | |
| 1. | 47453 | 36.5% | 1.1%(+35.5)#1 | 1.2%(+35.3)#614 |
| 2. | 47525 | 36.1% | 1.1%(+35.0)#2 | 1.2%(+34.9)#636 |
| 3. | 47616 | 30.4% | 1.1%(+29.4)#3 | 1.2%(+29.2)#887 |
| 4. | 47943 | 22.2% | 1.1%(+21.2)#4 | 1.2%(+21.0)#1,518 |
| 5. | 46988 | 21.3% | 1.1%(+20.2)#5 | 1.2%(+20.1)#1,635 |
| 6. | 47921 | 20.4% | 1.1%(+19.3)#6 | 1.2%(+19.2)#1,724 |
| 7. | 47917 | 18.5% | 1.1%(+17.4)#7 | 1.2%(+17.3)#1,988 |
| 8. | 47531 | 17.3% | 1.1%(+16.2)#8 | 1.2%(+16.1)#2,178 |
| 9. | 47942 | 16.9% | 1.1%(+15.8)#9 | 1.2%(+15.7)#2,241 |
| 10. | 46998 | 16.4% | 1.1%(+15.4)#10 | 1.2%(+15.2)#2,333 |
| 11. | 47640 | 16.0% | 1.1%(+15.0)#11 | 1.2%(+14.8)#2,420 |
| 12. | 47859 | 15.8% | 1.1%(+14.7)#12 | 1.2%(+14.6)#2,476 |
| 13. | 46759 | 15.3% | 1.1%(+14.2)#13 | 1.2%(+14.1)#2,577 |
| 14. | 47523 | 15.1% | 1.1%(+14.1)#14 | 1.2%(+13.9)#2,603 |
| 15. | 47449 | 14.9% | 1.1%(+13.8)#15 | 1.2%(+13.7)#2,667 |
| 16. | 46931 | 14.5% | 1.1%(+13.4)#16 | 1.2%(+13.3)#2,761 |
| 17. | 47948 | 13.2% | 1.1%(+12.1)#17 | 1.2%(+12.0)#3,113 |
| 18. | 47980 | 13.2% | 1.1%(+12.1)#18 | 1.2%(+12.0)#3,119 |
| 19. | 47995 | 11.9% | 1.1%(+10.8)#19 | 1.2%(+10.7)#3,538 |
| 20. | 46508 | 11.8% | 1.1%(+10.7)#20 | 1.2%(+10.6)#3,589 |
| 21. | 47529 | 11.7% | 1.1%(+10.6)#21 | 1.2%(+10.5)#3,628 |
| 22. | 47568 | 11.6% | 1.1%(+10.6)#22 | 1.2%(+10.4)#3,636 |
| 23. | 46787 | 11.5% | 1.1%(+10.5)#23 | 1.2%(+10.3)#3,672 |
| 24. | 47108 | 11.5% | 1.1%(+10.4)#24 | 1.2%(+10.3)#3,689 |
| 25. | 47963 | 11.3% | 1.1%(+10.2)#25 | 1.2%(+10.1)#3,782 |
| 26. | 46165 | 10.9% | 1.1%(+9.82)#26 | 1.2%(+9.68)#3,924 |
| 27. | 46127 | 10.7% | 1.1%(+9.66)#27 | 1.2%(+9.51)#3,994 |
| 28. | 47125 | 10.7% | 1.1%(+9.63)#28 | 1.2%(+9.49)#4,005 |
| 29. | 47561 | 10.5% | 1.1%(+9.49)#29 | 1.2%(+9.34)#4,079 |
| 30. | 47951 | 10.5% | 1.1%(+9.43)#30 | 1.2%(+9.29)#4,103 |
| 31. | 46996 | 10.5% | 1.1%(+9.40)#31 | 1.2%(+9.26)#4,112 |
| 32. | 47862 | 10.2% | 1.1%(+9.17)#32 | 1.2%(+9.03)#4,205 |
| 33. | 47393 | 10.2% | 1.1%(+9.17)#33 | 1.2%(+9.03)#4,210 |
| 34. | 47369 | 10.2% | 1.1%(+9.16)#34 | 1.2%(+9.02)#4,217 |
| 35. | 47524 | 10.1% | 1.1%(+9.07)#35 | 1.2%(+8.93)#4,255 |
| 36. | 47854 | 9.7% | 1.1%(+8.68)#36 | 1.2%(+8.54)#4,458 |
| 37. | 47952 | 9.7% | 1.1%(+8.65)#37 | 1.2%(+8.51)#4,473 |
| 38. | 47340 | 9.7% | 1.1%(+8.62)#38 | 1.2%(+8.48)#4,485 |
| 39. | 47326 | 9.6% | 1.1%(+8.56)#39 | 1.2%(+8.42)#4,511 |
| 40. | 46049 | 9.6% | 1.1%(+8.49)#40 | 1.2%(+8.35)#4,544 |
| 41. | 46039 | 9.5% | 1.1%(+8.49)#41 | 1.2%(+8.34)#4,551 |
| 42. | 47465 | 9.3% | 1.1%(+8.28)#42 | 1.2%(+8.13)#4,663 |
| 43. | 47224 | 9.3% | 1.1%(+8.21)#43 | 1.2%(+8.07)#4,693 |
| 44. | 47575 | 9.1% | 1.1%(+8.01)#44 | 1.2%(+7.87)#4,800 |
| 45. | 47596 | 9.0% | 1.1%(+7.92)#45 | 1.2%(+7.78)#4,845 |
| 46. | 47944 | 8.9% | 1.1%(+7.86)#46 | 1.2%(+7.72)#4,880 |
| 47. | 47535 | 8.7% | 1.1%(+7.62)#47 | 1.2%(+7.48)#5,011 |
| 48. | 47358 | 8.6% | 1.1%(+7.57)#48 | 1.2%(+7.43)#5,038 |
| 49. | 47929 | 8.5% | 1.1%(+7.44)#49 | 1.2%(+7.30)#5,116 |
| 50. | 46951 | 8.5% | 1.1%(+7.41)#50 | 1.2%(+7.27)#5,131 |
| 51. | 46740 | 8.4% | 1.1%(+7.38)#51 | 1.2%(+7.24)#5,151 |
| 52. | 47562 | 8.4% | 1.1%(+7.37)#52 | 1.2%(+7.23)#5,158 |
| 53. | 46374 | 8.4% | 1.1%(+7.33)#53 | 1.2%(+7.19)#5,168 |
| 54. | 46911 | 8.4% | 1.1%(+7.31)#54 | 1.2%(+7.16)#5,185 |
| 55. | 47846 | 8.4% | 1.1%(+7.30)#55 | 1.2%(+7.16)#5,189 |
| 56. | 47861 | 8.3% | 1.1%(+7.22)#56 | 1.2%(+7.07)#5,243 |
| 57. | 47325 | 8.2% | 1.1%(+7.15)#57 | 1.2%(+7.01)#5,283 |
| 58. | 47666 | 8.1% | 1.1%(+7.03)#58 | 1.2%(+6.89)#5,358 |
| 59. | 47443 | 7.8% | 1.1%(+6.74)#59 | 1.2%(+6.60)#5,551 |
| 60. | 47847 | 7.8% | 1.1%(+6.73)#60 | 1.2%(+6.59)#5,557 |
| 61. | 47452 | 7.8% | 1.1%(+6.73)#61 | 1.2%(+6.58)#5,561 |
| 62. | 47220 | 7.8% | 1.1%(+6.70)#62 | 1.2%(+6.56)#5,578 |
| 63. | 47975 | 7.7% | 1.1%(+6.66)#63 | 1.2%(+6.52)#5,605 |
| 64. | 46929 | 7.7% | 1.1%(+6.63)#64 | 1.2%(+6.49)#5,630 |
| 65. | 46781 | 7.7% | 1.1%(+6.59)#65 | 1.2%(+6.45)#5,647 |
| 66. | 47922 | 7.6% | 1.1%(+6.58)#66 | 1.2%(+6.43)#5,660 |
| 67. | 47264 | 7.5% | 1.1%(+6.41)#67 | 1.2%(+6.27)#5,765 |
| 68. | 47116 | 7.4% | 1.1%(+6.35)#68 | 1.2%(+6.21)#5,816 |
| 69. | 47234 | 7.4% | 1.1%(+6.34)#69 | 1.2%(+6.19)#5,826 |
| 70. | 46105 | 7.4% | 1.1%(+6.33)#70 | 1.2%(+6.19)#5,833 |
| 71. | 46793 | 7.3% | 1.1%(+6.19)#71 | 1.2%(+6.05)#5,923 |
| 72. | 46182 | 7.2% | 1.1%(+6.11)#72 | 1.2%(+5.96)#5,983 |
| 73. | 47850 | 7.1% | 1.1%(+6.05)#73 | 1.2%(+5.90)#6,024 |
| 74. | 47946 | 7.1% | 1.1%(+6.03)#74 | 1.2%(+5.89)#6,033 |
| 75. | 47578 | 7.0% | 1.1%(+5.98)#75 | 1.2%(+5.84)#6,070 |
| 76. | 47380 | 6.9% | 1.1%(+5.82)#76 | 1.2%(+5.68)#6,182 |
| 77. | 47597 | 6.8% | 1.1%(+5.74)#77 | 1.2%(+5.60)#6,255 |
| 78. | 47017 | 6.6% | 1.1%(+5.56)#78 | 1.2%(+5.42)#6,389 |
| 79. | 47431 | 6.5% | 1.1%(+5.45)#79 | 1.2%(+5.30)#6,474 |
| 80. | 47974 | 6.5% | 1.1%(+5.41)#80 | 1.2%(+5.27)#6,513 |
| 81. | 47648 | 6.5% | 1.1%(+5.40)#81 | 1.2%(+5.26)#6,527 |
| 82. | 47970 | 6.3% | 1.1%(+5.29)#82 | 1.2%(+5.15)#6,609 |
| 83. | 47283 | 6.3% | 1.1%(+5.25)#83 | 1.2%(+5.11)#6,642 |
| 84. | 46910 | 6.3% | 1.1%(+5.22)#84 | 1.2%(+5.08)#6,670 |
| 85. | 47527 | 6.2% | 1.1%(+5.10)#85 | 1.2%(+4.96)#6,763 |
| 86. | 47879 | 6.2% | 1.1%(+5.10)#86 | 1.2%(+4.95)#6,767 |
| 87. | 47872 | 6.1% | 1.1%(+5.07)#87 | 1.2%(+4.93)#6,786 |
| 88. | 47838 | 6.1% | 1.1%(+5.05)#88 | 1.2%(+4.90)#6,817 |
| 89. | 47977 | 6.1% | 1.1%(+5.02)#89 | 1.2%(+4.88)#6,839 |
| 90. | 47016 | 6.1% | 1.1%(+4.99)#90 | 1.2%(+4.85)#6,864 |
| 91. | 47371 | 6.0% | 1.1%(+4.90)#91 | 1.2%(+4.76)#6,944 |
| 92. | 47968 | 5.9% | 1.1%(+4.89)#92 | 1.2%(+4.74)#6,958 |
| 93. | 46974 | 5.9% | 1.1%(+4.84)#93 | 1.2%(+4.70)#7,009 |
| 94. | 46173 | 5.9% | 1.1%(+4.80)#94 | 1.2%(+4.65)#7,042 |
| 95. | 47541 | 5.8% | 1.1%(+4.75)#95 | 1.2%(+4.61)#7,086 |
| 96. | 47978 | 5.8% | 1.1%(+4.70)#96 | 1.2%(+4.56)#7,124 |
| 97. | 46117 | 5.7% | 1.1%(+4.67)#97 | 1.2%(+4.53)#7,155 |
| 98. | 46772 | 5.6% | 1.1%(+4.57)#98 | 1.2%(+4.43)#7,244 |
| 99. | 46761 | 5.5% | 1.1%(+4.44)#99 | 1.2%(+4.30)#7,362 |
| 100. | 47981 | 5.5% | 1.1%(+4.41)#100 | 1.2%(+4.26)#7,393 |
Common Questions
What are the Top 10 Zip Codes with the Highest Percentage of Population Employed in Agriculture, Fishing & Hunting in Indiana?
Top 10 Zip Codes with the Highest Percentage of Population Employed in Agriculture, Fishing & Hunting in Indiana are:
What zip code has the Highest Percentage of Population Employed in Agriculture, Fishing & Hunting in Indiana?
47453 has the Highest Percentage of Population Employed in Agriculture, Fishing & Hunting in Indiana with 36.5%.
What is the Percentage of Population Employed in Agriculture, Fishing & Hunting in the State of Indiana?
Percentage of Population Employed in Agriculture, Fishing & Hunting in Indiana is 1.1%.
What is the Percentage of Population Employed in Agriculture, Fishing & Hunting in the United States?
Percentage of Population Employed in Agriculture, Fishing & Hunting in the United States is 1.2%.