Yorktown, IN Map & Demographics
Yorktown Map
Yorktown Overview
$41,219
PER CAPITA INCOME
$83,870
AVG FAMILY INCOME
$76,915
AVG HOUSEHOLD INCOME
6.4%
WAGE / INCOME GAP [ % ]
93.6¢/ $1
WAGE / INCOME GAP [ $ ]
0.39
INEQUALITY / GINI INDEX
11,560
TOTAL POPULATION
5,920
MALE POPULATION
5,640
FEMALE POPULATION
104.96
MALES / 100 FEMALES
95.27
FEMALES / 100 MALES
41.7
MEDIAN AGE
2.8
AVG FAMILY SIZE
2.5
AVG HOUSEHOLD SIZE
5,940
LABOR FORCE [ PEOPLE ]
66.5%
PERCENT IN LABOR FORCE
1.0%
UNEMPLOYMENT RATE
Yorktown Zip Codes
Yorktown Area Codes
Income in Yorktown
Income Overview in Yorktown
Per Capita Income in Yorktown is $41,219, while median incomes of families and households are $83,870 and $76,915 respectively.
| Characteristic | Number | Measure |
| Per Capita Income | 11,560 | $41,219 |
| Median Family Income | 3,447 | $83,870 |
| Mean Family Income | 3,447 | $112,003 |
| Median Household Income | 4,653 | $76,915 |
| Mean Household Income | 4,653 | $101,098 |
| Income Deficit | 3,447 | $0 |
| Wage / Income Gap (%) | 11,560 | 6.44% |
| Wage / Income Gap ($) | 11,560 | 93.56¢ per $1 |
| Gini / Inequality Index | 11,560 | 0.39 |
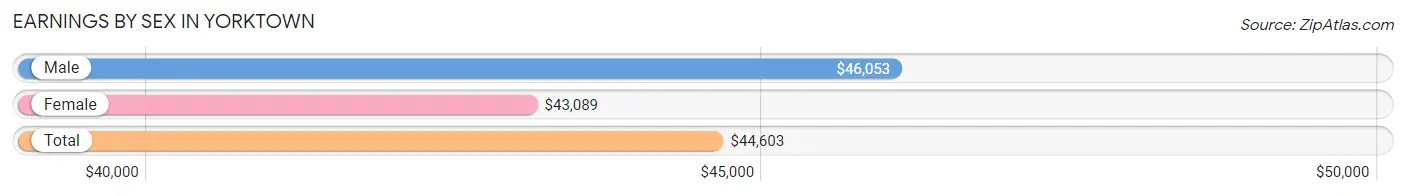
Earnings by Sex in Yorktown
Average Earnings in Yorktown are $44,603, $46,053 for men and $43,089 for women, a difference of 6.4%.
| Sex | Number | Average Earnings |
| Male | 3,604 (56.7%) | $46,053 |
| Female | 2,754 (43.3%) | $43,089 |
| Total | 6,358 (100.0%) | $44,603 |
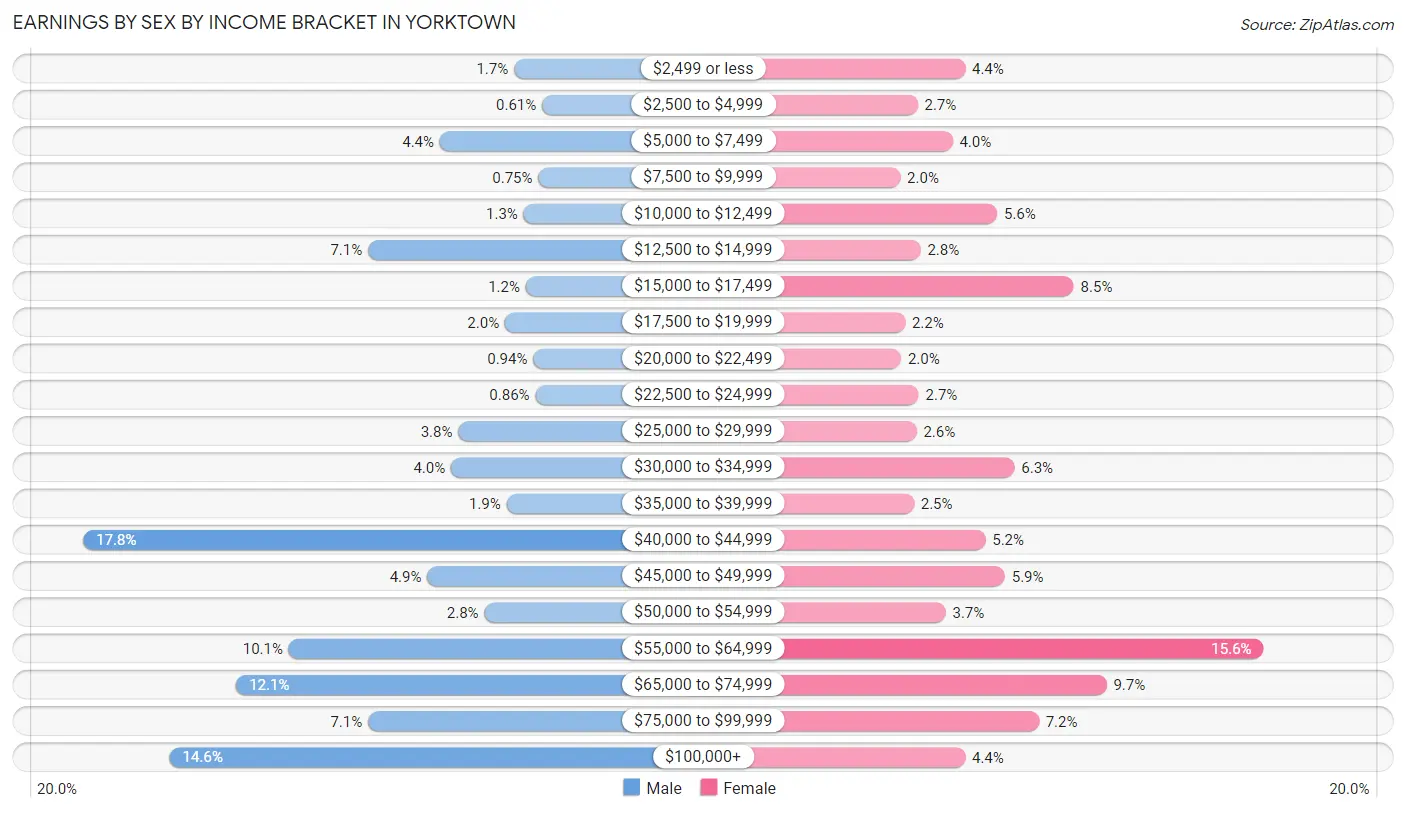
Earnings by Sex by Income Bracket in Yorktown
The most common earnings brackets in Yorktown are $40,000 to $44,999 for men (642 | 17.8%) and $55,000 to $64,999 for women (430 | 15.6%).
| Income | Male | Female |
| $2,499 or less | 60 (1.7%) | 122 (4.4%) |
| $2,500 to $4,999 | 22 (0.6%) | 73 (2.6%) |
| $5,000 to $7,499 | 160 (4.4%) | 109 (4.0%) |
| $7,500 to $9,999 | 27 (0.7%) | 55 (2.0%) |
| $10,000 to $12,499 | 47 (1.3%) | 155 (5.6%) |
| $12,500 to $14,999 | 257 (7.1%) | 76 (2.8%) |
| $15,000 to $17,499 | 44 (1.2%) | 234 (8.5%) |
| $17,500 to $19,999 | 72 (2.0%) | 60 (2.2%) |
| $20,000 to $22,499 | 34 (0.9%) | 56 (2.0%) |
| $22,500 to $24,999 | 31 (0.9%) | 74 (2.7%) |
| $25,000 to $29,999 | 135 (3.7%) | 72 (2.6%) |
| $30,000 to $34,999 | 145 (4.0%) | 173 (6.3%) |
| $35,000 to $39,999 | 70 (1.9%) | 69 (2.5%) |
| $40,000 to $44,999 | 642 (17.8%) | 143 (5.2%) |
| $45,000 to $49,999 | 177 (4.9%) | 163 (5.9%) |
| $50,000 to $54,999 | 100 (2.8%) | 102 (3.7%) |
| $55,000 to $64,999 | 364 (10.1%) | 430 (15.6%) |
| $65,000 to $74,999 | 435 (12.1%) | 268 (9.7%) |
| $75,000 to $99,999 | 257 (7.1%) | 198 (7.2%) |
| $100,000+ | 525 (14.6%) | 122 (4.4%) |
| Total | 3,604 (100.0%) | 2,754 (100.0%) |
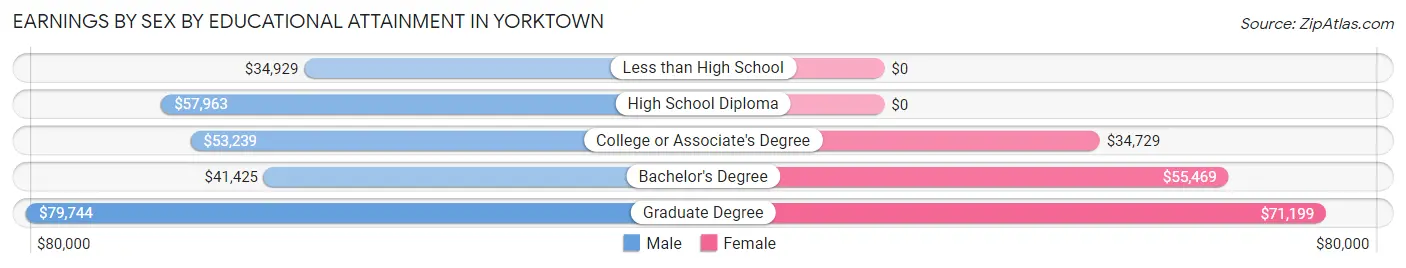
Earnings by Sex by Educational Attainment in Yorktown
Average earnings in Yorktown are $52,951 for men and $45,354 for women, a difference of 14.3%. Men with an educational attainment of graduate degree enjoy the highest average annual earnings of $79,744, while those with less than high school education earn the least with $34,929. Women with an educational attainment of graduate degree earn the most with the average annual earnings of $71,199, while those with college or associate's degree education have the smallest earnings of $34,729.
| Educational Attainment | Male Income | Female Income |
| Less than High School | $34,929 | $0 |
| High School Diploma | $57,963 | $0 |
| College or Associate's Degree | $53,239 | $34,729 |
| Bachelor's Degree | $41,425 | $55,469 |
| Graduate Degree | $79,744 | $71,199 |
| Total | $52,951 | $45,354 |
Family Income in Yorktown
Family Income Brackets in Yorktown
According to the Yorktown family income data, there are 1,048 families falling into the $50,000 to $74,999 income range, which is the most common income bracket and makes up 30.4% of all families.
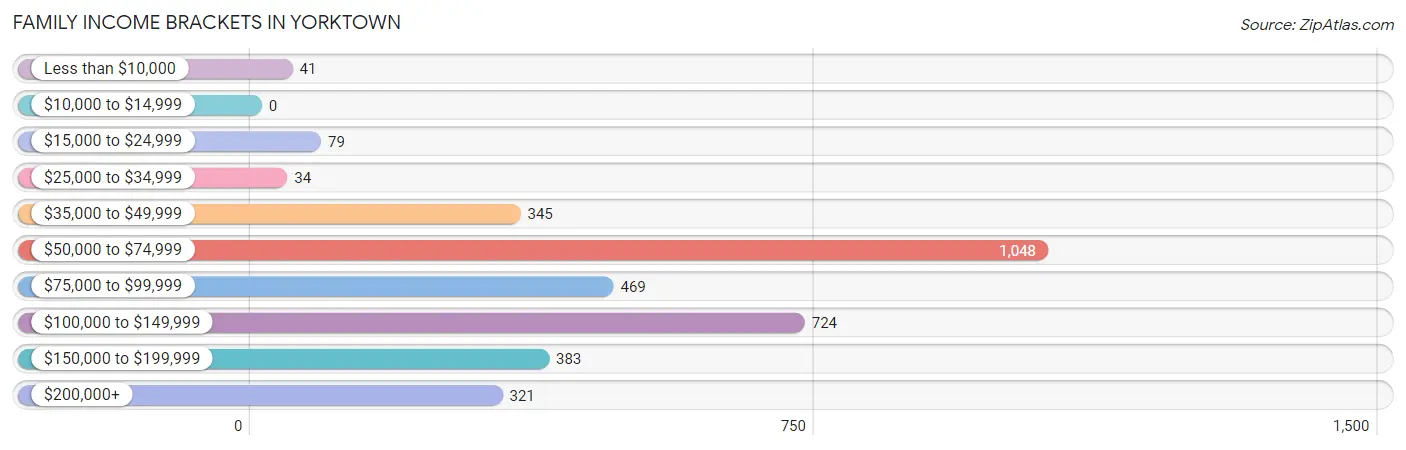
| Income Bracket | # Families | % Families |
| Less than $10,000 | 41 | 1.2% |
| $10,000 to $14,999 | 0 | 0.0% |
| $15,000 to $24,999 | 79 | 2.3% |
| $25,000 to $34,999 | 34 | 1.0% |
| $35,000 to $49,999 | 345 | 10.0% |
| $50,000 to $74,999 | 1,048 | 30.4% |
| $75,000 to $99,999 | 469 | 13.6% |
| $100,000 to $149,999 | 724 | 21.0% |
| $150,000 to $199,999 | 383 | 11.1% |
| $200,000+ | 321 | 9.3% |
Family Income by Famaliy Size in Yorktown
3-person families (1,131 | 32.8%) account for the highest median family income in Yorktown with $95,710 per family, while 2-person families (1,570 | 45.6%) have the highest median income of $41,682 per family member.
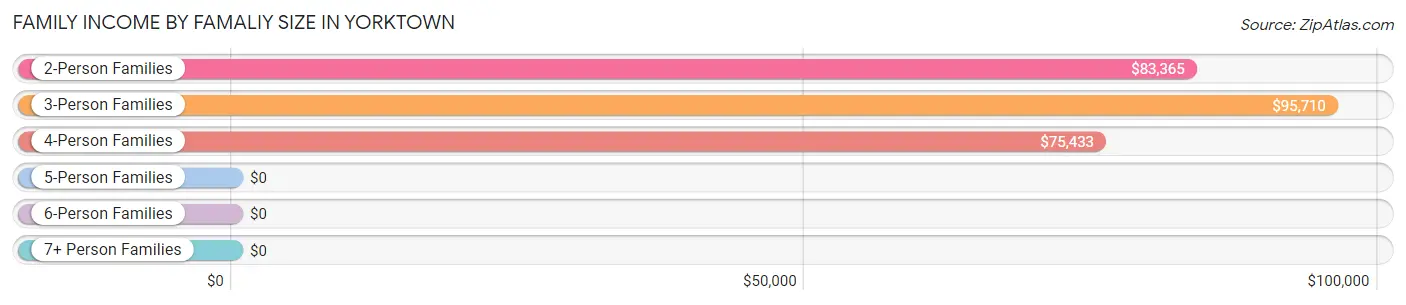
| Income Bracket | # Families | Median Income |
| 2-Person Families | 1,570 (45.6%) | $83,365 |
| 3-Person Families | 1,131 (32.8%) | $95,710 |
| 4-Person Families | 455 (13.2%) | $75,433 |
| 5-Person Families | 230 (6.7%) | $0 |
| 6-Person Families | 61 (1.8%) | $0 |
| 7+ Person Families | 0 (0.0%) | $0 |
| Total | 3,447 (100.0%) | $83,870 |
Family Income by Number of Earners in Yorktown
The median family income in Yorktown is $83,870, with families comprising 3+ earners (206) having the highest median family income of $161,058, while families with no earners (387) have the lowest median family income of $58,188, accounting for 6.0% and 11.2% of families, respectively.
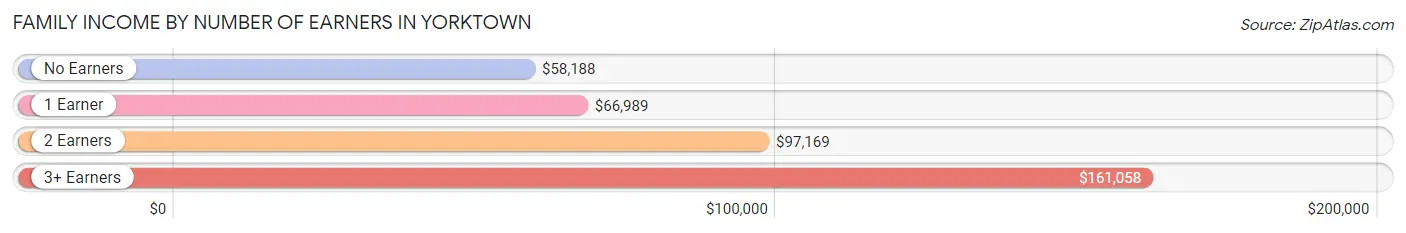
| Number of Earners | # Families | Median Income |
| No Earners | 387 (11.2%) | $58,188 |
| 1 Earner | 1,124 (32.6%) | $66,989 |
| 2 Earners | 1,730 (50.2%) | $97,169 |
| 3+ Earners | 206 (6.0%) | $161,058 |
| Total | 3,447 (100.0%) | $83,870 |
Household Income in Yorktown
Household Income Brackets in Yorktown
With 1,247 households falling in the category, the $50,000 to $74,999 income range is the most frequent in Yorktown, accounting for 26.8% of all households. In contrast, only 70 households (1.5%) fall into the $10,000 to $14,999 income bracket, making it the least populous group.
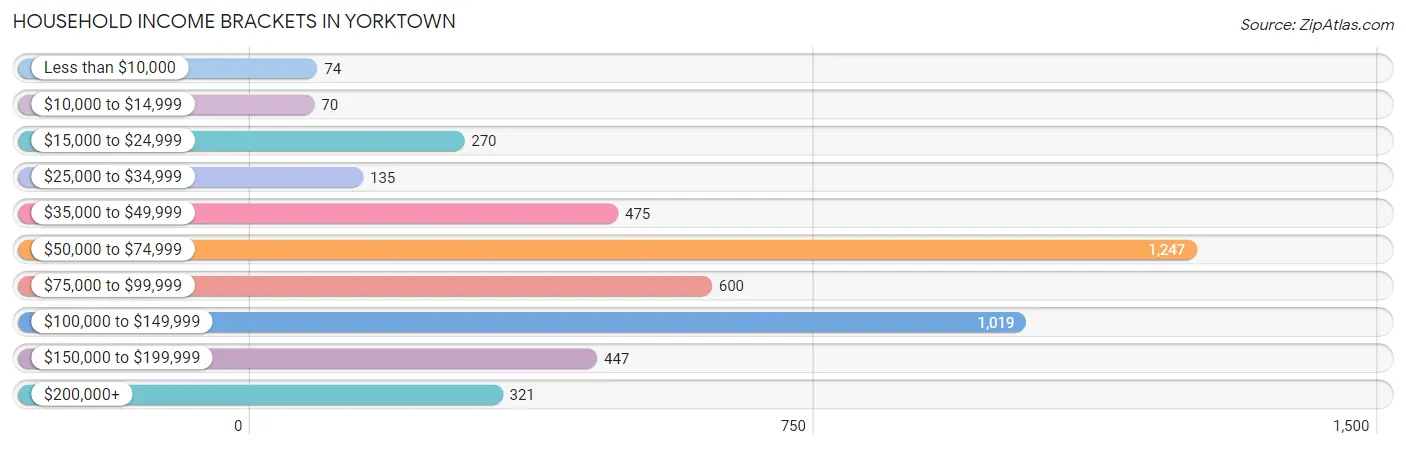
| Income Bracket | # Households | % Households |
| Less than $10,000 | 74 | 1.6% |
| $10,000 to $14,999 | 70 | 1.5% |
| $15,000 to $24,999 | 270 | 5.8% |
| $25,000 to $34,999 | 135 | 2.9% |
| $35,000 to $49,999 | 475 | 10.2% |
| $50,000 to $74,999 | 1,247 | 26.8% |
| $75,000 to $99,999 | 600 | 12.9% |
| $100,000 to $149,999 | 1,019 | 21.9% |
| $150,000 to $199,999 | 447 | 9.6% |
| $200,000+ | 321 | 6.9% |
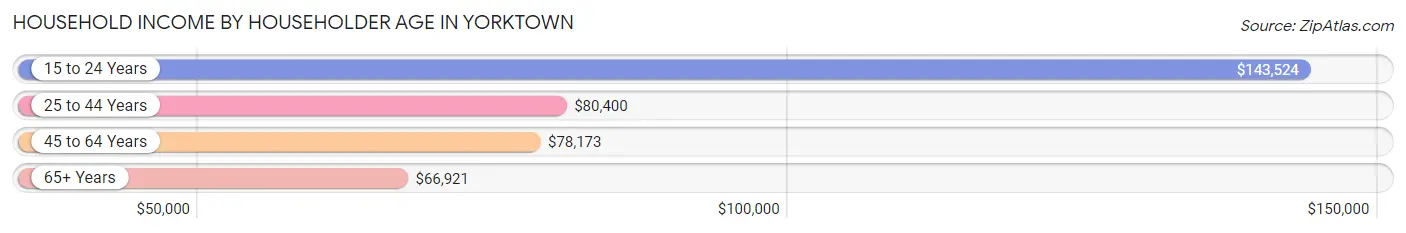
Household Income by Householder Age in Yorktown
The median household income in Yorktown is $76,915, with the highest median household income of $143,524 found in the 15 to 24 years age bracket for the primary householder. A total of 85 households (1.8%) fall into this category. Meanwhile, the 65+ years age bracket for the primary householder has the lowest median household income of $66,921, with 1,352 households (29.1%) in this group.
| Income Bracket | # Households | Median Income |
| 15 to 24 Years | 85 (1.8%) | $143,524 |
| 25 to 44 Years | 1,544 (33.2%) | $80,400 |
| 45 to 64 Years | 1,672 (35.9%) | $78,173 |
| 65+ Years | 1,352 (29.1%) | $66,921 |
| Total | 4,653 (100.0%) | $76,915 |
Poverty in Yorktown
Income Below Poverty by Sex and Age in Yorktown
With 4.0% poverty level for males and 5.3% for females among the residents of Yorktown, 12 to 14 year old males and 15 year old females are the most vulnerable to poverty, with 49 males (45.8%) and 36 females (50.0%) in their respective age groups living below the poverty level.
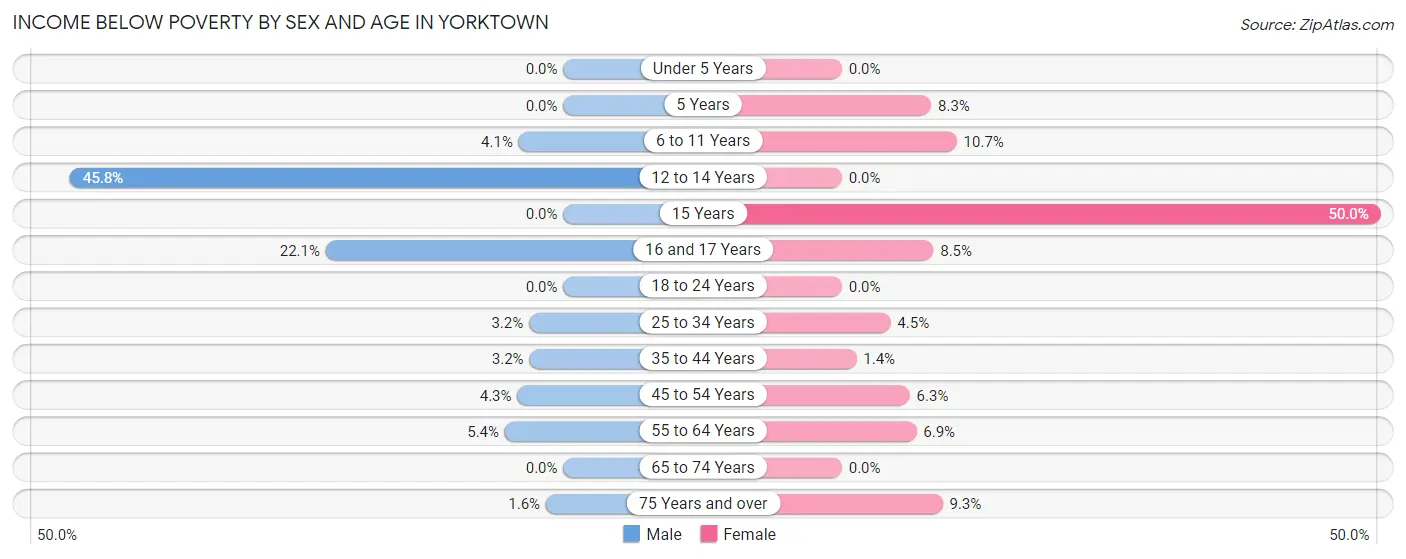
| Age Bracket | Male | Female |
| Under 5 Years | 0 (0.0%) | 0 (0.0%) |
| 5 Years | 0 (0.0%) | 16 (8.3%) |
| 6 to 11 Years | 22 (4.1%) | 53 (10.7%) |
| 12 to 14 Years | 49 (45.8%) | 0 (0.0%) |
| 15 Years | 0 (0.0%) | 36 (50.0%) |
| 16 and 17 Years | 28 (22.1%) | 9 (8.5%) |
| 18 to 24 Years | 0 (0.0%) | 0 (0.0%) |
| 25 to 34 Years | 20 (3.2%) | 24 (4.5%) |
| 35 to 44 Years | 28 (3.2%) | 12 (1.3%) |
| 45 to 54 Years | 40 (4.3%) | 31 (6.3%) |
| 55 to 64 Years | 33 (5.4%) | 66 (6.9%) |
| 65 to 74 Years | 0 (0.0%) | 0 (0.0%) |
| 75 Years and over | 7 (1.6%) | 48 (9.3%) |
| Total | 227 (4.0%) | 295 (5.3%) |
Income Above Poverty by Sex and Age in Yorktown
According to the poverty statistics in Yorktown, males aged under 5 years and females aged under 5 years are the age groups that are most secure financially, with 100.0% of males and 100.0% of females in these age groups living above the poverty line.
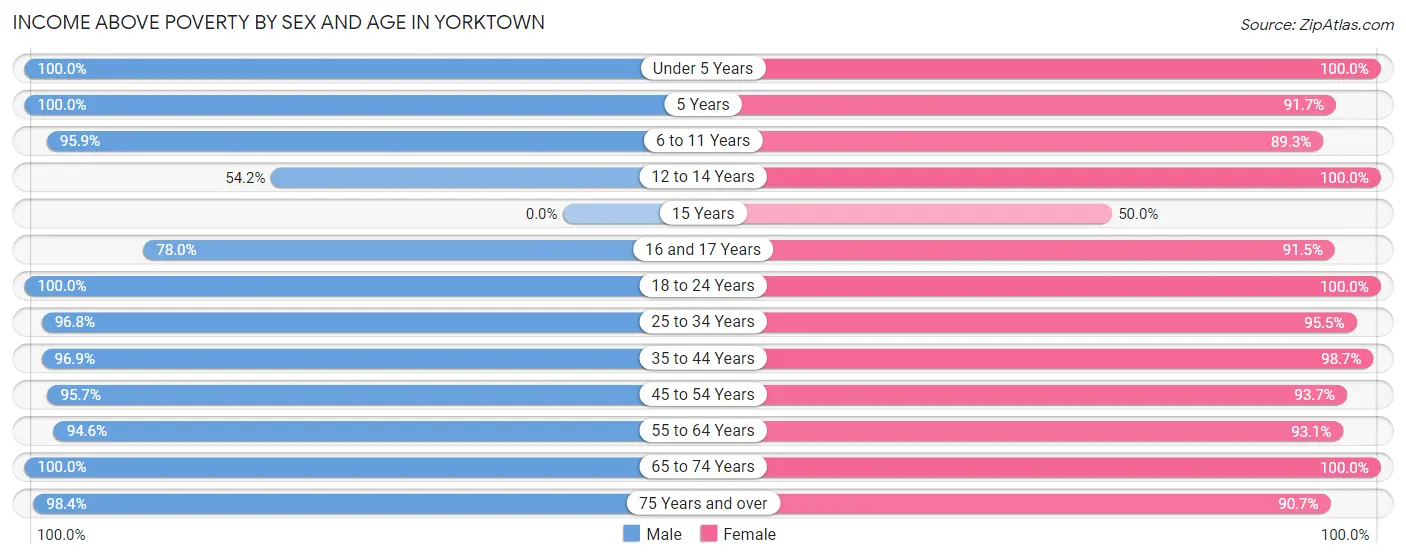
| Age Bracket | Male | Female |
| Under 5 Years | 399 (100.0%) | 302 (100.0%) |
| 5 Years | 103 (100.0%) | 177 (91.7%) |
| 6 to 11 Years | 510 (95.9%) | 444 (89.3%) |
| 12 to 14 Years | 58 (54.2%) | 240 (100.0%) |
| 15 Years | 0 (0.0%) | 36 (50.0%) |
| 16 and 17 Years | 99 (77.9%) | 97 (91.5%) |
| 18 to 24 Years | 350 (100.0%) | 155 (100.0%) |
| 25 to 34 Years | 609 (96.8%) | 508 (95.5%) |
| 35 to 44 Years | 861 (96.9%) | 875 (98.7%) |
| 45 to 54 Years | 897 (95.7%) | 461 (93.7%) |
| 55 to 64 Years | 575 (94.6%) | 888 (93.1%) |
| 65 to 74 Years | 639 (100.0%) | 602 (100.0%) |
| 75 Years and over | 426 (98.4%) | 466 (90.7%) |
| Total | 5,526 (96.1%) | 5,251 (94.7%) |
Income Below Poverty Among Married-Couple Families in Yorktown
The poverty statistics for married-couple families in Yorktown show that 1.1% or 31 of the total 2,844 families live below the poverty line. Families with no children have the highest poverty rate of 1.2%, comprising of 19 families. On the other hand, families with 3 or 4 children have the lowest poverty rate of 0.0%, which includes 0 families.
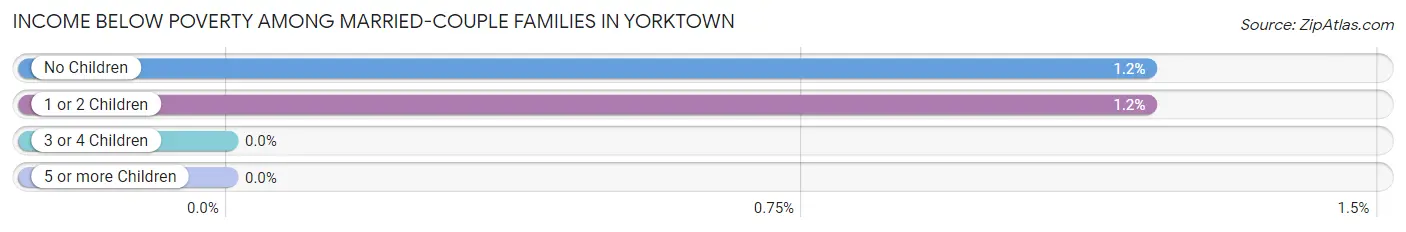
| Children | Above Poverty | Below Poverty |
| No Children | 1,558 (98.8%) | 19 (1.2%) |
| 1 or 2 Children | 986 (98.8%) | 12 (1.2%) |
| 3 or 4 Children | 269 (100.0%) | 0 (0.0%) |
| 5 or more Children | 0 (0.0%) | 0 (0.0%) |
| Total | 2,813 (98.9%) | 31 (1.1%) |
Income Below Poverty Among Single-Parent Households in Yorktown
According to the poverty data in Yorktown, 14.3% or 24 single-father households and 9.2% or 40 single-mother households are living below the poverty line. Among single-father households, those with 3 or 4 children have the highest poverty rate, with 24 households (100.0%) experiencing poverty. Likewise, among single-mother households, those with 1 or 2 children have the highest poverty rate, with 40 households (19.1%) falling below the poverty line.
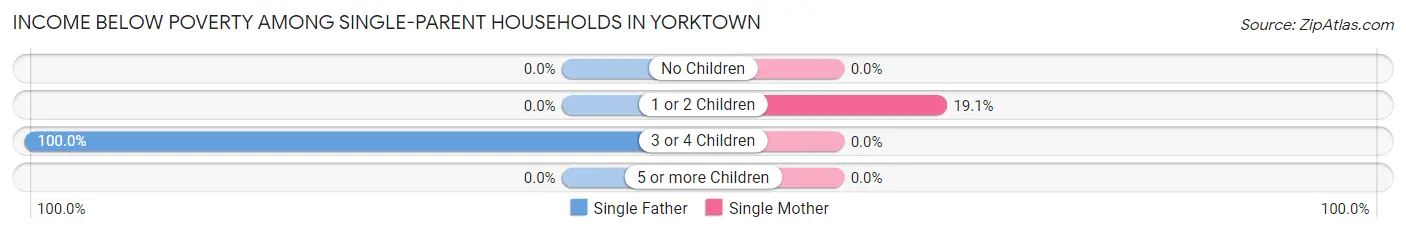
| Children | Single Father | Single Mother |
| No Children | 0 (0.0%) | 0 (0.0%) |
| 1 or 2 Children | 0 (0.0%) | 40 (19.1%) |
| 3 or 4 Children | 24 (100.0%) | 0 (0.0%) |
| 5 or more Children | 0 (0.0%) | 0 (0.0%) |
| Total | 24 (14.3%) | 40 (9.2%) |
Income Below Poverty Among Married-Couple vs Single-Parent Households in Yorktown
The poverty data for Yorktown shows that 31 of the married-couple family households (1.1%) and 64 of the single-parent households (10.6%) are living below the poverty level. Within the married-couple family households, those with no children have the highest poverty rate, with 19 households (1.2%) falling below the poverty line. Among the single-parent households, those with 3 or 4 children have the highest poverty rate, with 24 household (18.6%) living below poverty.
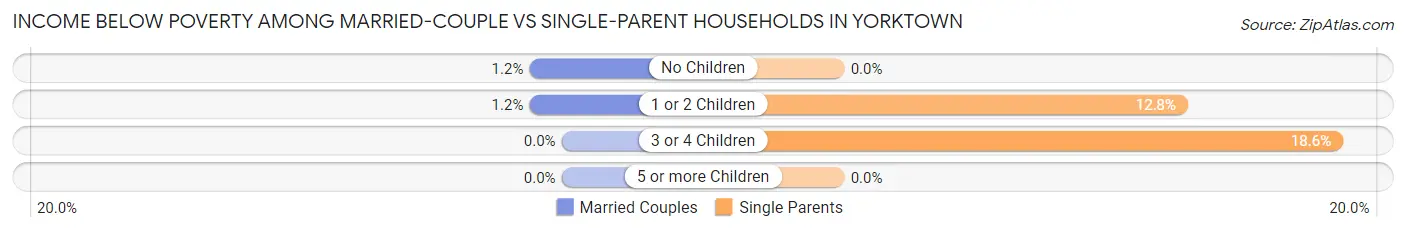
| Children | Married-Couple Families | Single-Parent Households |
| No Children | 19 (1.2%) | 0 (0.0%) |
| 1 or 2 Children | 12 (1.2%) | 40 (12.8%) |
| 3 or 4 Children | 0 (0.0%) | 24 (18.6%) |
| 5 or more Children | 0 (0.0%) | 0 (0.0%) |
| Total | 31 (1.1%) | 64 (10.6%) |
Race in Yorktown
The most populous races in Yorktown are White / Caucasian (10,695 | 92.5%), Two or more Races (469 | 4.1%), and Asian (250 | 2.2%).
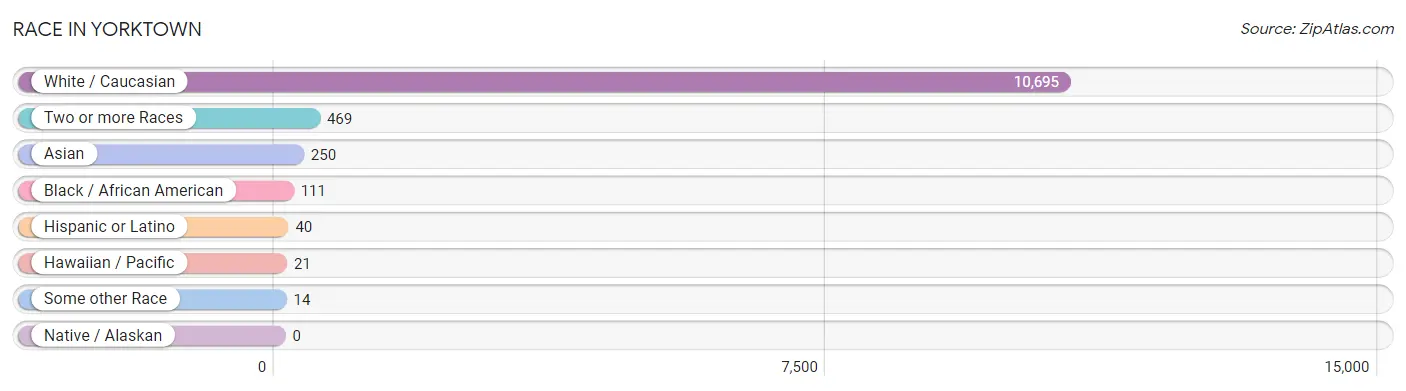
| Race | # Population | % Population |
| Asian | 250 | 2.2% |
| Black / African American | 111 | 1.0% |
| Hawaiian / Pacific | 21 | 0.2% |
| Hispanic or Latino | 40 | 0.4% |
| Native / Alaskan | 0 | 0.0% |
| White / Caucasian | 10,695 | 92.5% |
| Two or more Races | 469 | 4.1% |
| Some other Race | 14 | 0.1% |
| Total | 11,560 | 100.0% |
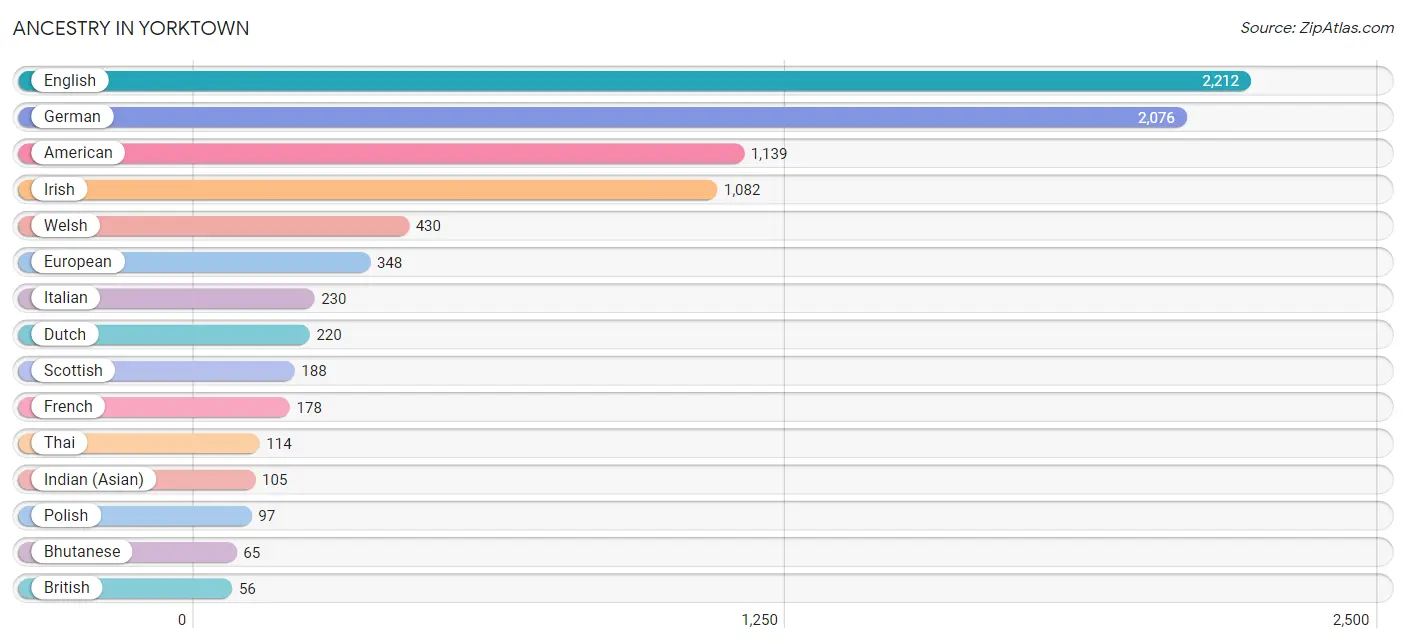
Ancestry in Yorktown
The most populous ancestries reported in Yorktown are English (2,212 | 19.1%), German (2,076 | 18.0%), American (1,139 | 9.9%), Irish (1,082 | 9.4%), and Welsh (430 | 3.7%), together accounting for 60.0% of all Yorktown residents.
| Ancestry | # Population | % Population |
| American | 1,139 | 9.9% |
| Austrian | 13 | 0.1% |
| Belgian | 14 | 0.1% |
| Bhutanese | 65 | 0.6% |
| British | 56 | 0.5% |
| Burmese | 22 | 0.2% |
| Canadian | 11 | 0.1% |
| Cherokee | 32 | 0.3% |
| Czech | 27 | 0.2% |
| Delaware | 1 | 0.0% |
| Dutch | 220 | 1.9% |
| Eastern European | 33 | 0.3% |
| English | 2,212 | 19.1% |
| European | 348 | 3.0% |
| French | 178 | 1.5% |
| German | 2,076 | 18.0% |
| Greek | 9 | 0.1% |
| Guamanian / Chamorro | 21 | 0.2% |
| Indian (Asian) | 105 | 0.9% |
| Irish | 1,082 | 9.4% |
| Italian | 230 | 2.0% |
| Lithuanian | 26 | 0.2% |
| Mexican | 40 | 0.4% |
| Norwegian | 51 | 0.4% |
| Polish | 97 | 0.8% |
| Romanian | 9 | 0.1% |
| Scandinavian | 11 | 0.1% |
| Scotch-Irish | 39 | 0.3% |
| Scottish | 188 | 1.6% |
| Slavic | 20 | 0.2% |
| Swedish | 55 | 0.5% |
| Swiss | 30 | 0.3% |
| Thai | 114 | 1.0% |
| Ukrainian | 19 | 0.2% |
| Welsh | 430 | 3.7% | View All 35 Rows |
Immigrants in Yorktown
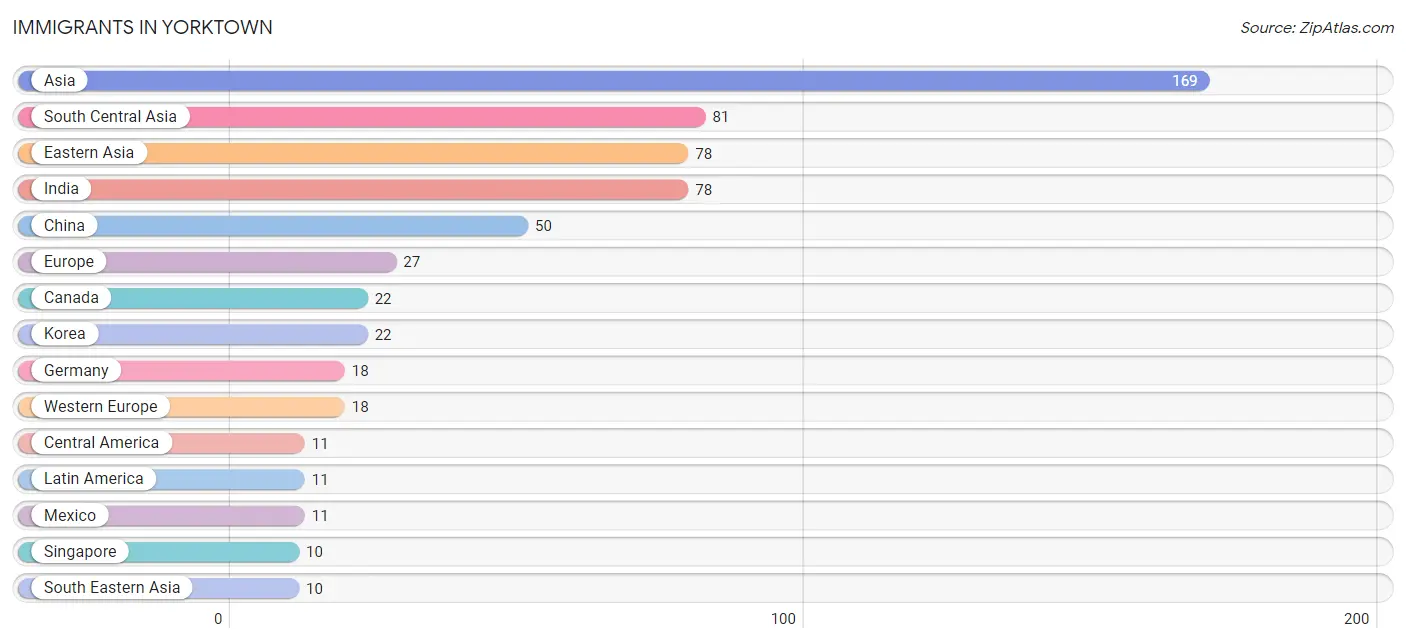
The most numerous immigrant groups reported in Yorktown came from Asia (169 | 1.5%), South Central Asia (81 | 0.7%), Eastern Asia (78 | 0.7%), India (78 | 0.7%), and China (50 | 0.4%), together accounting for 3.9% of all Yorktown residents.
| Immigration Origin | # Population | % Population |
| Asia | 169 | 1.5% |
| Canada | 22 | 0.2% |
| Central America | 11 | 0.1% |
| China | 50 | 0.4% |
| Eastern Asia | 78 | 0.7% |
| Eastern Europe | 9 | 0.1% |
| Europe | 27 | 0.2% |
| Germany | 18 | 0.2% |
| India | 78 | 0.7% |
| Japan | 6 | 0.1% |
| Korea | 22 | 0.2% |
| Latin America | 11 | 0.1% |
| Mexico | 11 | 0.1% |
| Nepal | 3 | 0.0% |
| Serbia | 9 | 0.1% |
| Singapore | 10 | 0.1% |
| South Central Asia | 81 | 0.7% |
| South Eastern Asia | 10 | 0.1% |
| Western Europe | 18 | 0.2% | View All 19 Rows |
Sex and Age in Yorktown
Sex and Age in Yorktown
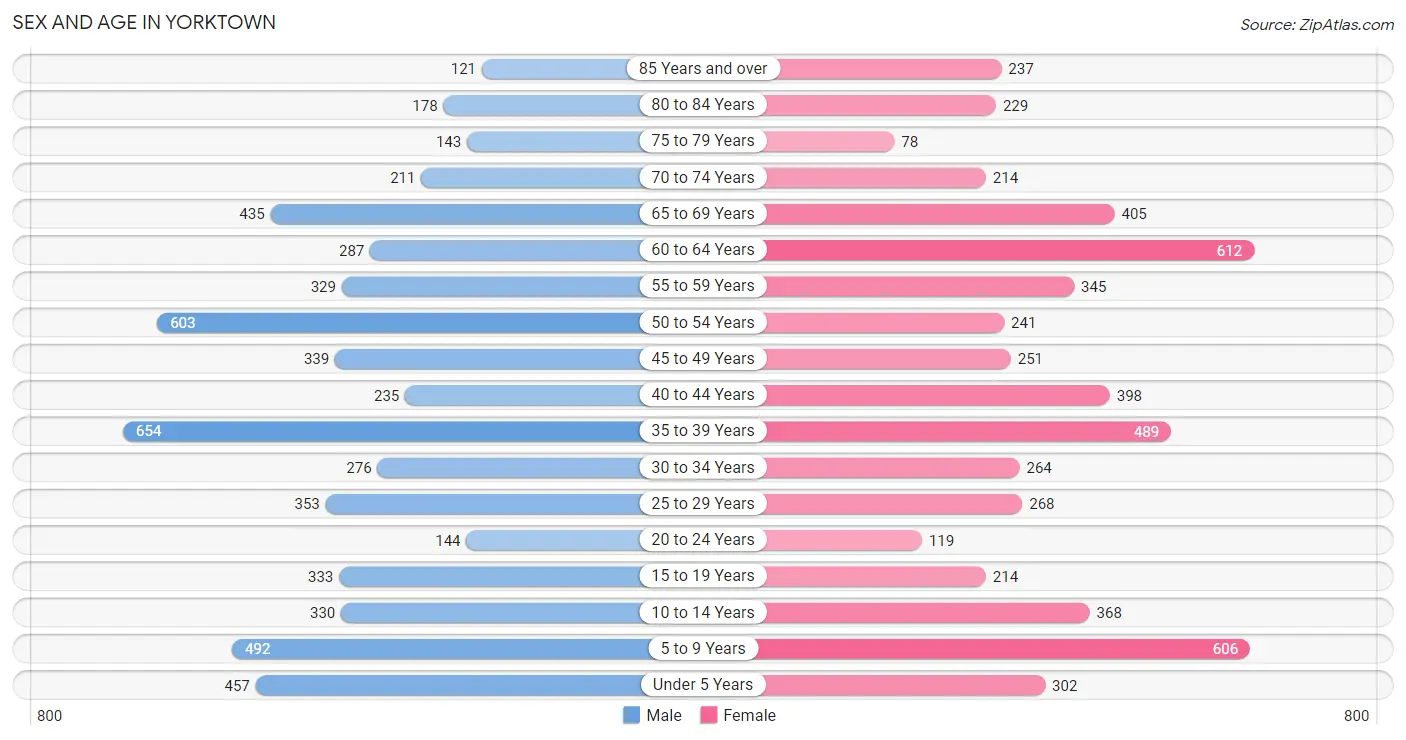
The most populous age groups in Yorktown are 35 to 39 Years (654 | 11.1%) for men and 60 to 64 Years (612 | 10.8%) for women.
| Age Bracket | Male | Female |
| Under 5 Years | 457 (7.7%) | 302 (5.3%) |
| 5 to 9 Years | 492 (8.3%) | 606 (10.7%) |
| 10 to 14 Years | 330 (5.6%) | 368 (6.5%) |
| 15 to 19 Years | 333 (5.6%) | 214 (3.8%) |
| 20 to 24 Years | 144 (2.4%) | 119 (2.1%) |
| 25 to 29 Years | 353 (6.0%) | 268 (4.8%) |
| 30 to 34 Years | 276 (4.7%) | 264 (4.7%) |
| 35 to 39 Years | 654 (11.1%) | 489 (8.7%) |
| 40 to 44 Years | 235 (4.0%) | 398 (7.1%) |
| 45 to 49 Years | 339 (5.7%) | 251 (4.4%) |
| 50 to 54 Years | 603 (10.2%) | 241 (4.3%) |
| 55 to 59 Years | 329 (5.6%) | 345 (6.1%) |
| 60 to 64 Years | 287 (4.9%) | 612 (10.8%) |
| 65 to 69 Years | 435 (7.3%) | 405 (7.2%) |
| 70 to 74 Years | 211 (3.6%) | 214 (3.8%) |
| 75 to 79 Years | 143 (2.4%) | 78 (1.4%) |
| 80 to 84 Years | 178 (3.0%) | 229 (4.1%) |
| 85 Years and over | 121 (2.0%) | 237 (4.2%) |
| Total | 5,920 (100.0%) | 5,640 (100.0%) |
Families and Households in Yorktown
Median Family Size in Yorktown
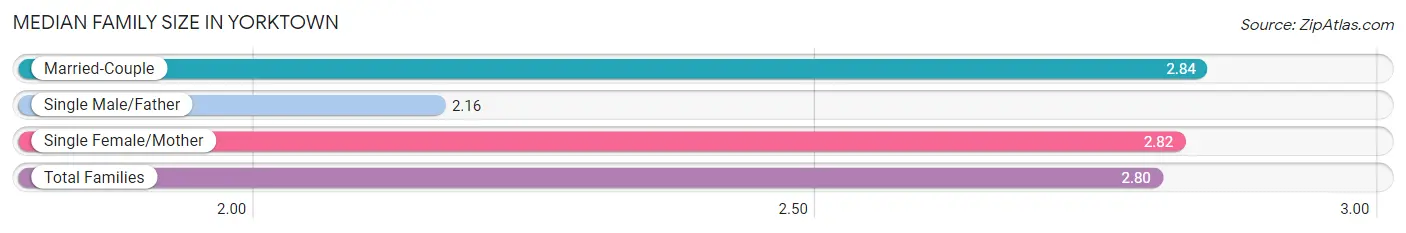
The median family size in Yorktown is 2.80 persons per family, with married-couple families (2,844 | 82.5%) accounting for the largest median family size of 2.84 persons per family. On the other hand, single male/father families (168 | 4.9%) represent the smallest median family size with 2.16 persons per family.
| Family Type | # Families | Family Size |
| Married-Couple | 2,844 (82.5%) | 2.84 |
| Single Male/Father | 168 (4.9%) | 2.16 |
| Single Female/Mother | 435 (12.6%) | 2.82 |
| Total Families | 3,447 (100.0%) | 2.80 |
Median Household Size in Yorktown
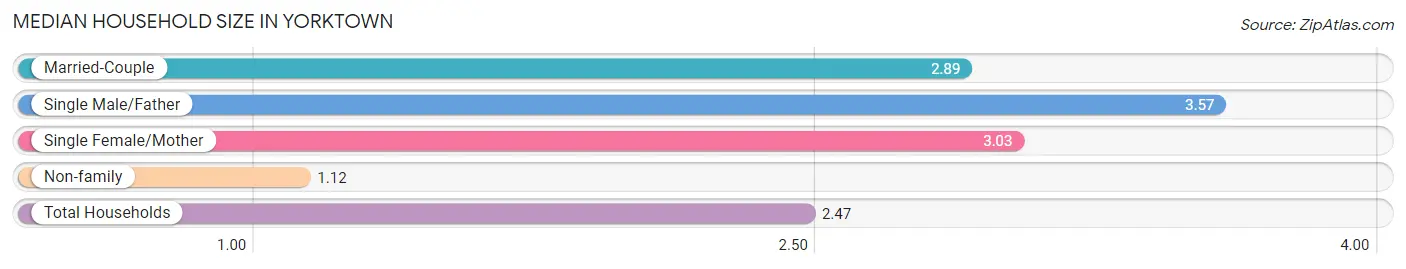
The median household size in Yorktown is 2.47 persons per household, with single male/father households (168 | 3.6%) accounting for the largest median household size of 3.57 persons per household. non-family households (1,206 | 25.9%) represent the smallest median household size with 1.12 persons per household.
| Household Type | # Households | Household Size |
| Married-Couple | 2,844 (61.1%) | 2.89 |
| Single Male/Father | 168 (3.6%) | 3.57 |
| Single Female/Mother | 435 (9.3%) | 3.03 |
| Non-family | 1,206 (25.9%) | 1.12 |
| Total Households | 4,653 (100.0%) | 2.47 |
Household Size by Marriage Status in Yorktown
Out of a total of 4,653 households in Yorktown, 3,447 (74.1%) are family households, while 1,206 (25.9%) are nonfamily households. The most numerous type of family households are 2-person households, comprising 1,438, and the most common type of nonfamily households are 1-person households, comprising 1,043.
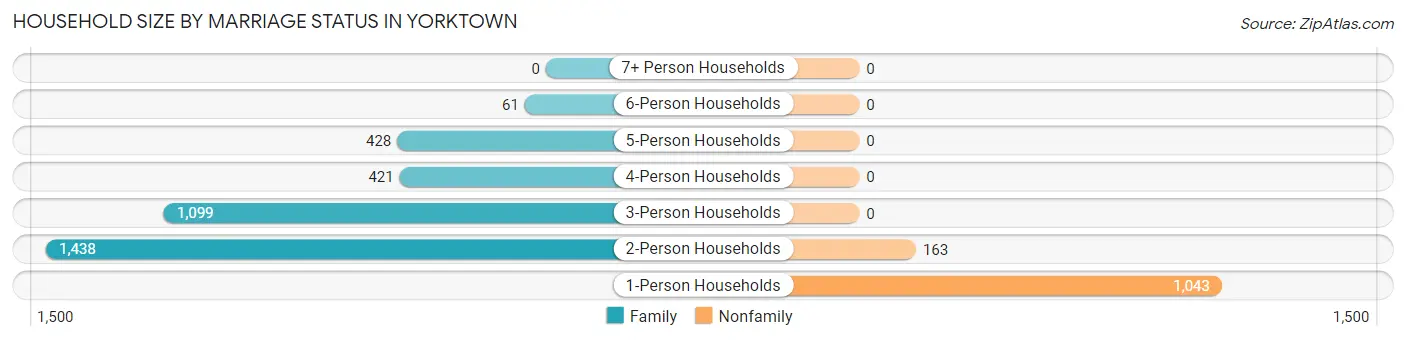
| Household Size | Family Households | Nonfamily Households |
| 1-Person Households | - | 1,043 (22.4%) |
| 2-Person Households | 1,438 (30.9%) | 163 (3.5%) |
| 3-Person Households | 1,099 (23.6%) | 0 (0.0%) |
| 4-Person Households | 421 (9.0%) | 0 (0.0%) |
| 5-Person Households | 428 (9.2%) | 0 (0.0%) |
| 6-Person Households | 61 (1.3%) | 0 (0.0%) |
| 7+ Person Households | 0 (0.0%) | 0 (0.0%) |
| Total | 3,447 (74.1%) | 1,206 (25.9%) |
Female Fertility in Yorktown
Fertility by Age in Yorktown
Average fertility rate in Yorktown is 17.0 births per 1,000 women. Women in the age bracket of 20 to 34 years have the highest fertility rate with 54.0 births per 1,000 women. Women in the age bracket of 20 to 34 years acount for 100.0% of all women with births.
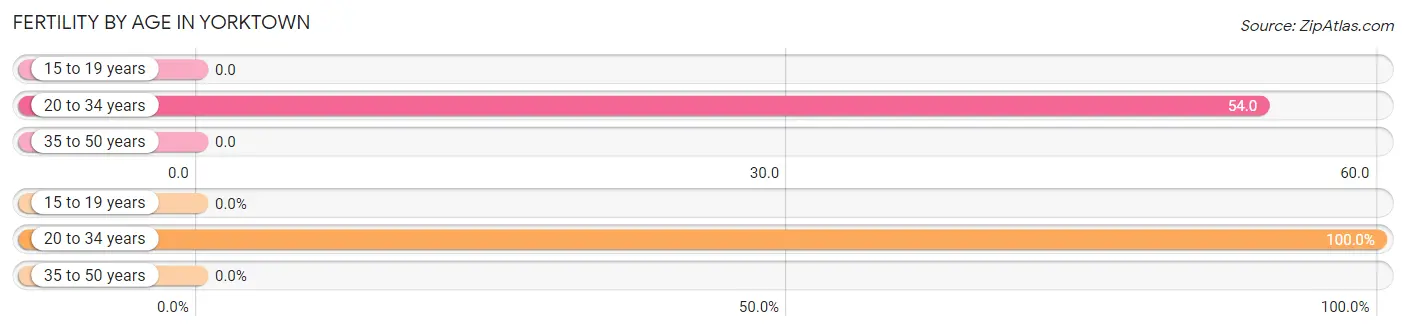
| Age Bracket | Women with Births | Births / 1,000 Women |
| 15 to 19 years | 0 (0.0%) | 0.0 |
| 20 to 34 years | 35 (100.0%) | 54.0 |
| 35 to 50 years | 0 (0.0%) | 0.0 |
| Total | 35 (100.0%) | 17.0 |
Fertility by Age by Marriage Status in Yorktown
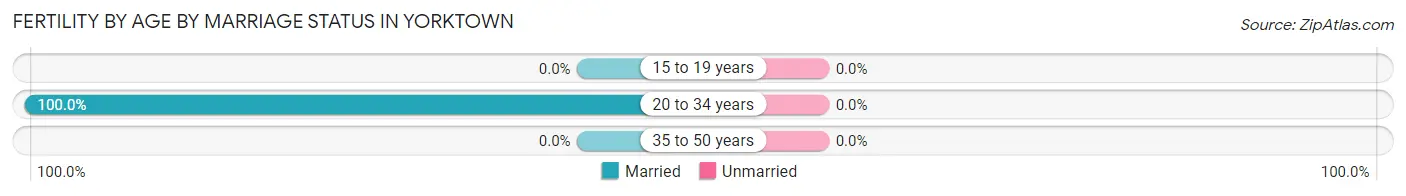
| Age Bracket | Married | Unmarried |
| 15 to 19 years | 0 (0.0%) | 0 (0.0%) |
| 20 to 34 years | 35 (100.0%) | 0 (0.0%) |
| 35 to 50 years | 0 (0.0%) | 0 (0.0%) |
| Total | 35 (100.0%) | 0 (0.0%) |
Fertility by Education in Yorktown
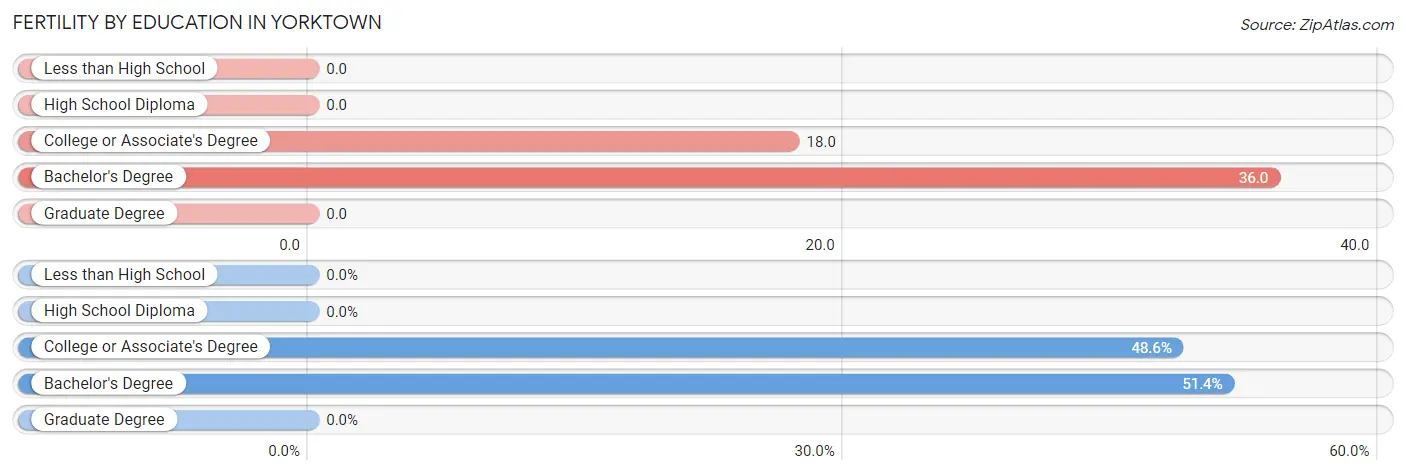
| Educational Attainment | Women with Births | Births / 1,000 Women |
| Less than High School | 0 (0.0%) | 0.0 |
| High School Diploma | 0 (0.0%) | 0.0 |
| College or Associate's Degree | 17 (48.6%) | 18.0 |
| Bachelor's Degree | 18 (51.4%) | 36.0 |
| Graduate Degree | 0 (0.0%) | 0.0 |
| Total | 35 (100.0%) | 17.0 |
Fertility by Education by Marriage Status in Yorktown
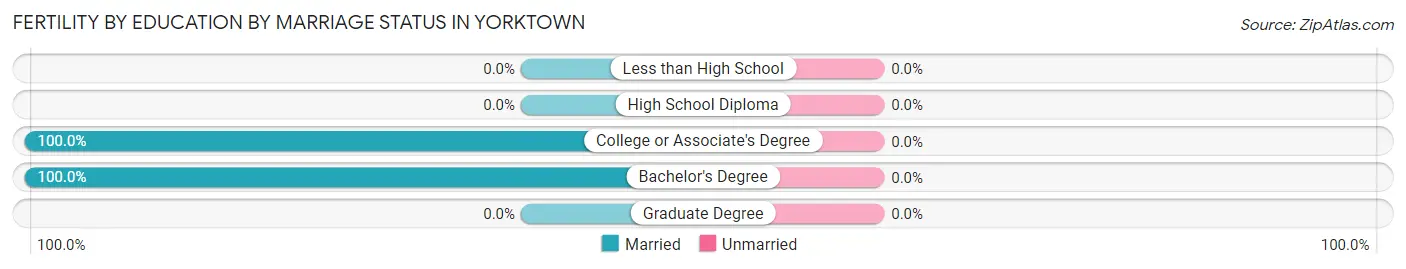
| Educational Attainment | Married | Unmarried |
| Less than High School | 0 (0.0%) | 0 (0.0%) |
| High School Diploma | 0 (0.0%) | 0 (0.0%) |
| College or Associate's Degree | 17 (100.0%) | 0 (0.0%) |
| Bachelor's Degree | 18 (100.0%) | 0 (0.0%) |
| Graduate Degree | 0 (0.0%) | 0 (0.0%) |
| Total | 35 (100.0%) | 0 (0.0%) |
Employment Characteristics in Yorktown
Employment by Class of Employer in Yorktown
Among the 5,767 employed individuals in Yorktown, private company employees (3,385 | 58.7%), not-for-profit organizations (1,050 | 18.2%), and local government employees (678 | 11.8%) make up the most common classes of employment.
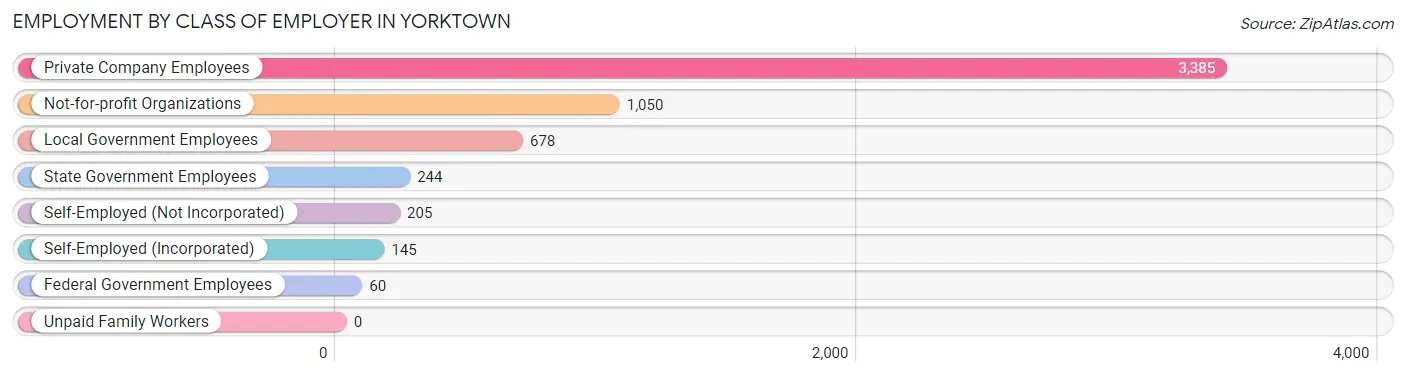
| Employer Class | # Employees | % Employees |
| Private Company Employees | 3,385 | 58.7% |
| Self-Employed (Incorporated) | 145 | 2.5% |
| Self-Employed (Not Incorporated) | 205 | 3.5% |
| Not-for-profit Organizations | 1,050 | 18.2% |
| Local Government Employees | 678 | 11.8% |
| State Government Employees | 244 | 4.2% |
| Federal Government Employees | 60 | 1.0% |
| Unpaid Family Workers | 0 | 0.0% |
| Total | 5,767 | 100.0% |
Employment Status by Age in Yorktown
According to the labor force statistics for Yorktown, out of the total population over 16 years of age (8,933), 66.5% or 5,940 individuals are in the labor force, with 1.0% or 59 of them unemployed. The age group with the highest labor force participation rate is 30 to 34 years, with 96.9% or 523 individuals in the labor force. Within the labor force, the 60 to 64 years age range has the highest percentage of unemployed individuals, with 5.9% or 29 of them being unemployed.
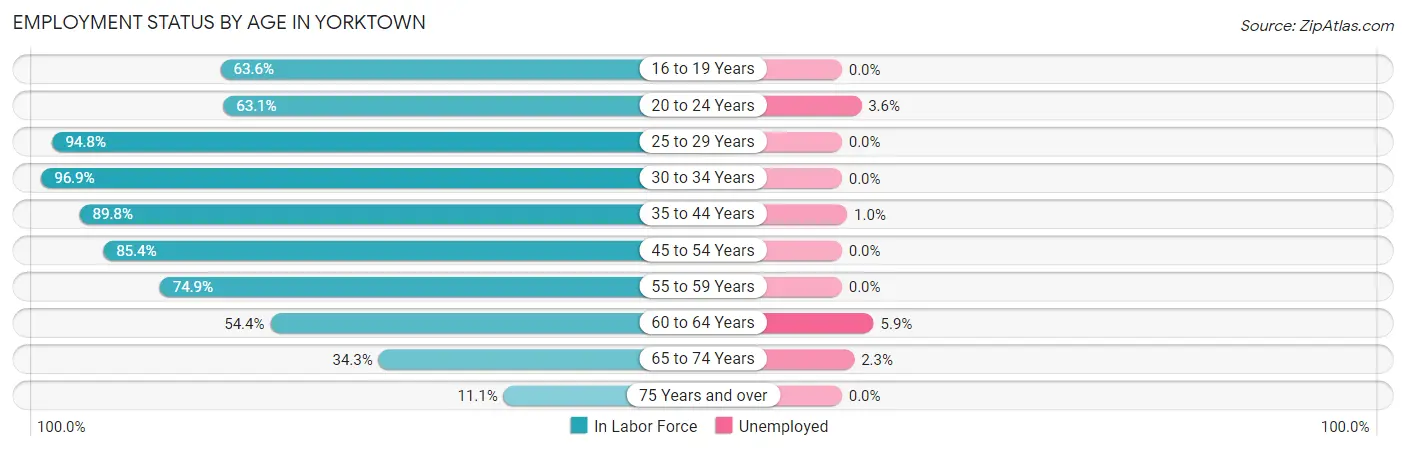
| Age Bracket | In Labor Force | Unemployed |
| 16 to 19 Years | 302 (63.6%) | 0 (0.0%) |
| 20 to 24 Years | 166 (63.1%) | 6 (3.6%) |
| 25 to 29 Years | 589 (94.8%) | 0 (0.0%) |
| 30 to 34 Years | 523 (96.9%) | 0 (0.0%) |
| 35 to 44 Years | 1,595 (89.8%) | 16 (1.0%) |
| 45 to 54 Years | 1,225 (85.4%) | 0 (0.0%) |
| 55 to 59 Years | 505 (74.9%) | 0 (0.0%) |
| 60 to 64 Years | 489 (54.4%) | 29 (5.9%) |
| 65 to 74 Years | 434 (34.3%) | 10 (2.3%) |
| 75 Years and over | 109 (11.1%) | 0 (0.0%) |
| Total | 5,940 (66.5%) | 59 (1.0%) |
Employment Status by Educational Attainment in Yorktown
According to labor force statistics for Yorktown, 82.9% of individuals (4,928) out of the total population between 25 and 64 years of age (5,944) are in the labor force, with 0.9% or 44 of them being unemployed. The group with the highest labor force participation rate are those with the educational attainment of bachelor's degree or higher, with 89.8% or 1,995 individuals in the labor force. Within the labor force, individuals with college / associate degree education have the highest percentage of unemployment, with 1.7% or 37 of them being unemployed.
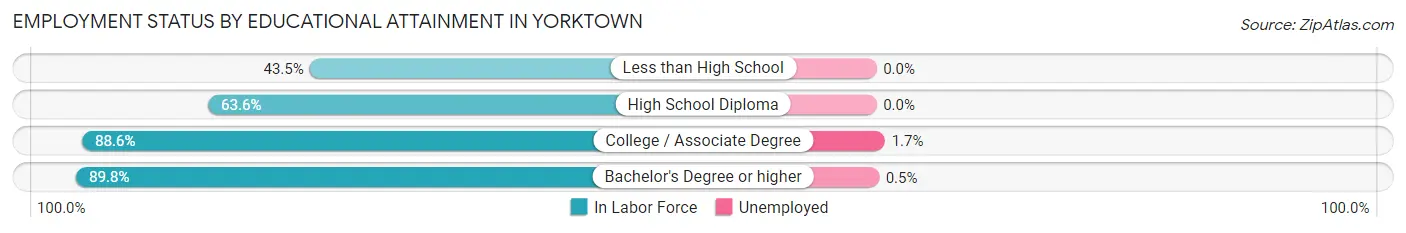
| Educational Attainment | In Labor Force | Unemployed |
| Less than High School | 111 (43.5%) | 0 (0.0%) |
| High School Diploma | 646 (63.6%) | 0 (0.0%) |
| College / Associate Degree | 2,172 (88.6%) | 42 (1.7%) |
| Bachelor's Degree or higher | 1,995 (89.8%) | 11 (0.5%) |
| Total | 4,928 (82.9%) | 53 (0.9%) |
Employment Occupations by Sex in Yorktown
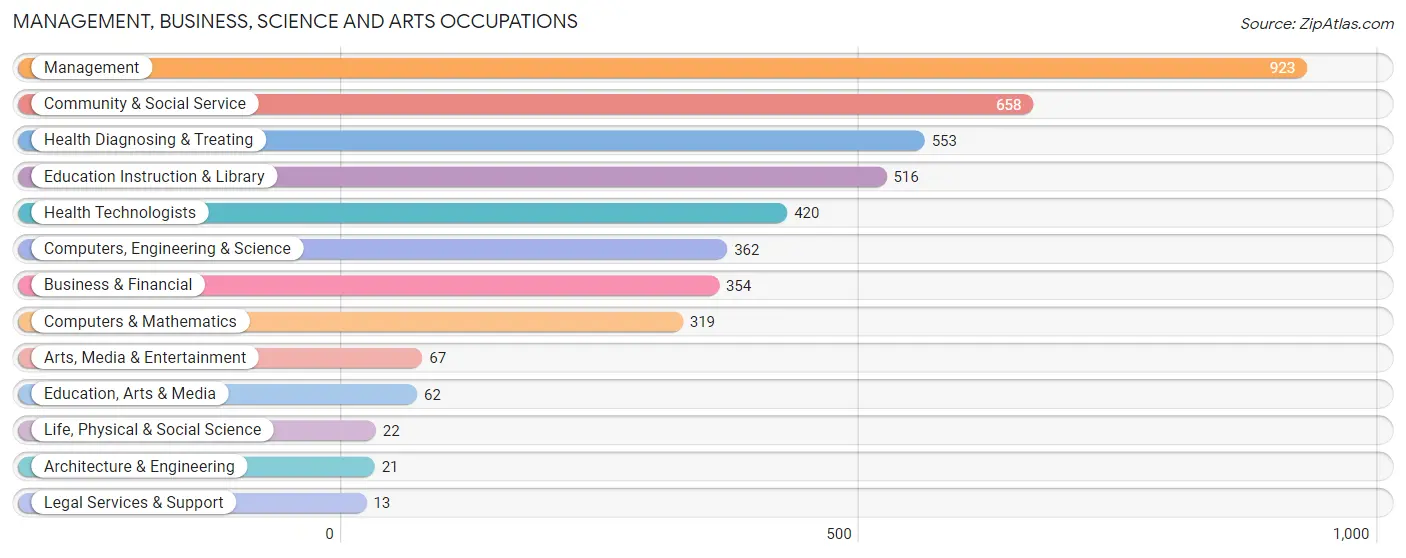
Management, Business, Science and Arts Occupations
The most common Management, Business, Science and Arts occupations in Yorktown are Management (923 | 15.8%), Community & Social Service (658 | 11.2%), Health Diagnosing & Treating (553 | 9.4%), Education Instruction & Library (516 | 8.8%), and Health Technologists (420 | 7.2%).
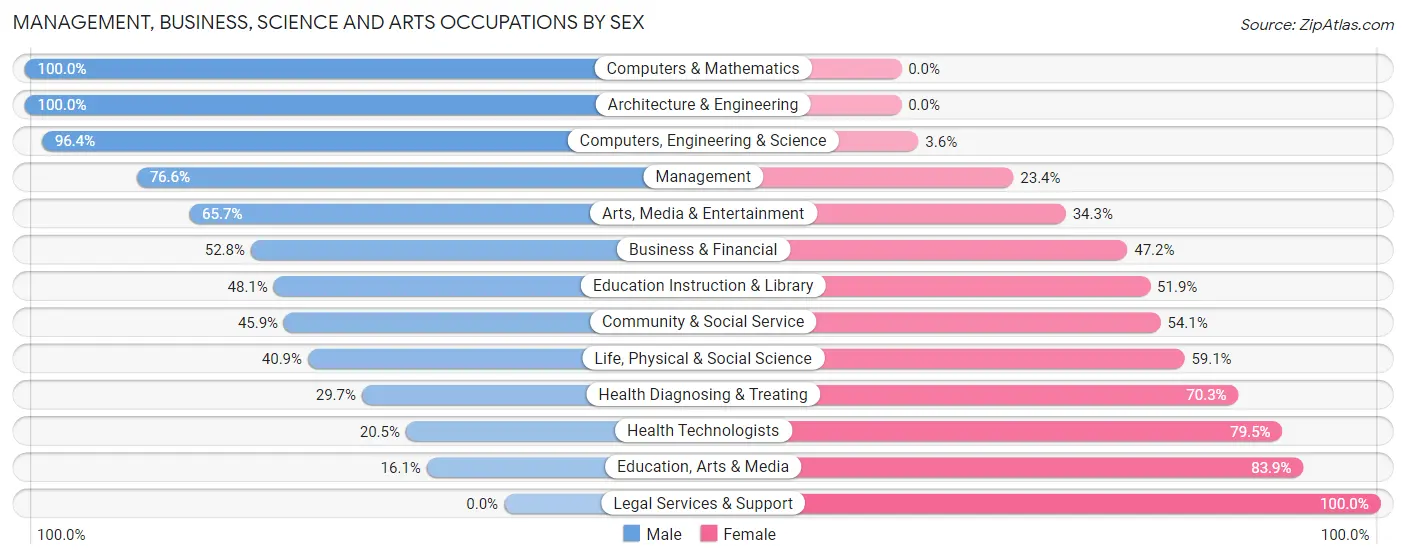
Management, Business, Science and Arts Occupations by Sex
Within the Management, Business, Science and Arts occupations in Yorktown, the most male-oriented occupations are Computers & Mathematics (100.0%), Architecture & Engineering (100.0%), and Computers, Engineering & Science (96.4%), while the most female-oriented occupations are Legal Services & Support (100.0%), Education, Arts & Media (83.9%), and Health Technologists (79.5%).
| Occupation | Male | Female |
| Management | 707 (76.6%) | 216 (23.4%) |
| Business & Financial | 187 (52.8%) | 167 (47.2%) |
| Computers, Engineering & Science | 349 (96.4%) | 13 (3.6%) |
| Computers & Mathematics | 319 (100.0%) | 0 (0.0%) |
| Architecture & Engineering | 21 (100.0%) | 0 (0.0%) |
| Life, Physical & Social Science | 9 (40.9%) | 13 (59.1%) |
| Community & Social Service | 302 (45.9%) | 356 (54.1%) |
| Education, Arts & Media | 10 (16.1%) | 52 (83.9%) |
| Legal Services & Support | 0 (0.0%) | 13 (100.0%) |
| Education Instruction & Library | 248 (48.1%) | 268 (51.9%) |
| Arts, Media & Entertainment | 44 (65.7%) | 23 (34.3%) |
| Health Diagnosing & Treating | 164 (29.7%) | 389 (70.3%) |
| Health Technologists | 86 (20.5%) | 334 (79.5%) |
| Total (Category) | 1,709 (60.0%) | 1,141 (40.0%) |
| Total (Overall) | 3,313 (56.6%) | 2,545 (43.4%) |
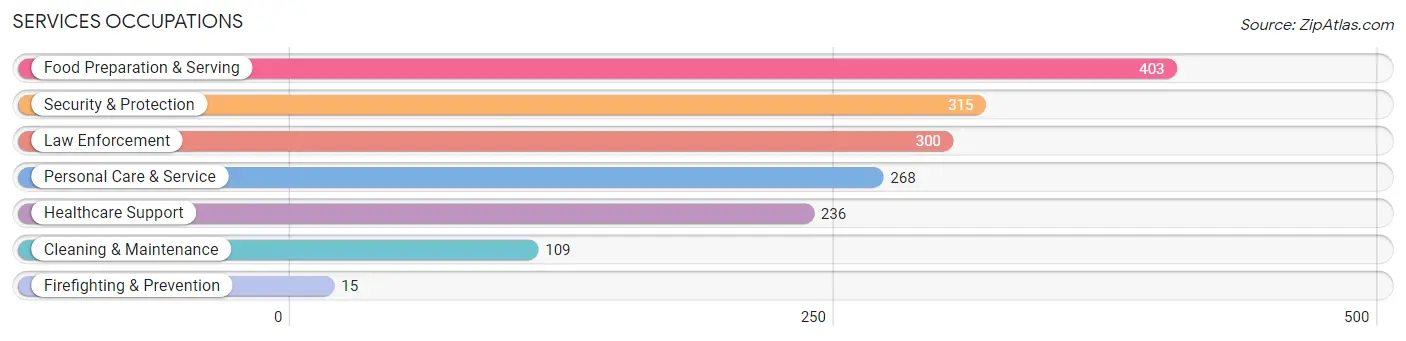
Services Occupations
The most common Services occupations in Yorktown are Food Preparation & Serving (403 | 6.9%), Security & Protection (315 | 5.4%), Law Enforcement (300 | 5.1%), Personal Care & Service (268 | 4.6%), and Healthcare Support (236 | 4.0%).
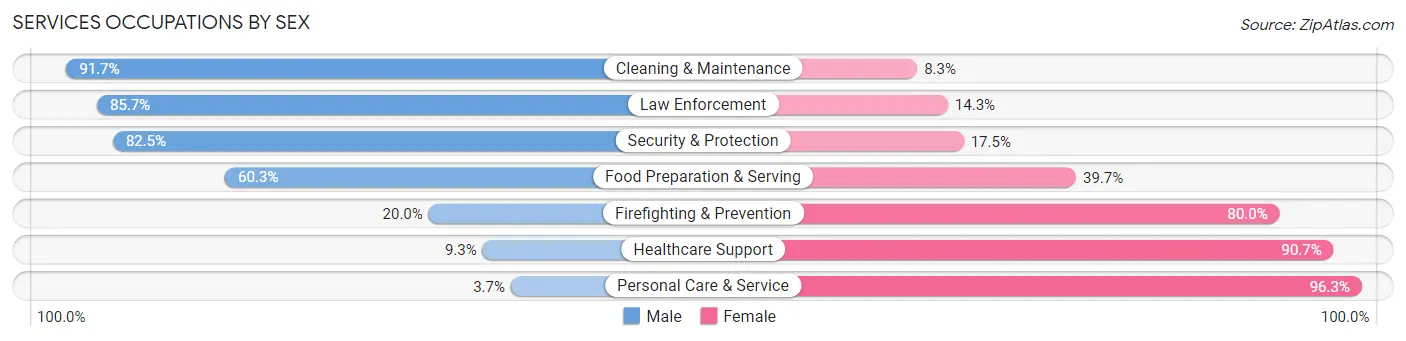
Services Occupations by Sex
Within the Services occupations in Yorktown, the most male-oriented occupations are Cleaning & Maintenance (91.7%), Law Enforcement (85.7%), and Security & Protection (82.5%), while the most female-oriented occupations are Personal Care & Service (96.3%), Healthcare Support (90.7%), and Firefighting & Prevention (80.0%).
| Occupation | Male | Female |
| Healthcare Support | 22 (9.3%) | 214 (90.7%) |
| Security & Protection | 260 (82.5%) | 55 (17.5%) |
| Firefighting & Prevention | 3 (20.0%) | 12 (80.0%) |
| Law Enforcement | 257 (85.7%) | 43 (14.3%) |
| Food Preparation & Serving | 243 (60.3%) | 160 (39.7%) |
| Cleaning & Maintenance | 100 (91.7%) | 9 (8.3%) |
| Personal Care & Service | 10 (3.7%) | 258 (96.3%) |
| Total (Category) | 635 (47.7%) | 696 (52.3%) |
| Total (Overall) | 3,313 (56.6%) | 2,545 (43.4%) |
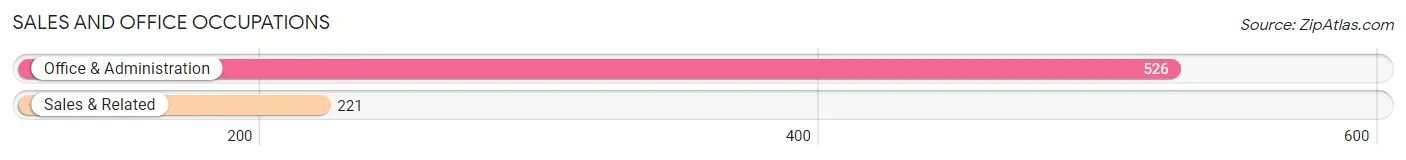
Sales and Office Occupations
The most common Sales and Office occupations in Yorktown are Office & Administration (526 | 9.0%), and Sales & Related (221 | 3.8%).
Sales and Office Occupations by Sex
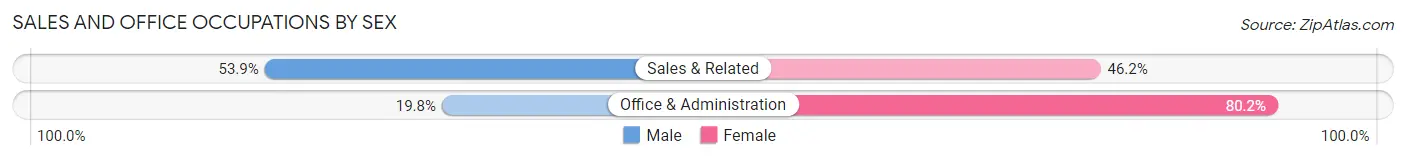
| Occupation | Male | Female |
| Sales & Related | 119 (53.8%) | 102 (46.2%) |
| Office & Administration | 104 (19.8%) | 422 (80.2%) |
| Total (Category) | 223 (29.8%) | 524 (70.2%) |
| Total (Overall) | 3,313 (56.6%) | 2,545 (43.4%) |
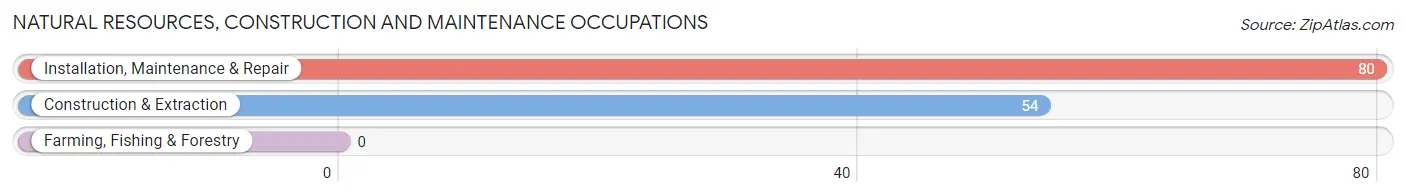
Natural Resources, Construction and Maintenance Occupations
The most common Natural Resources, Construction and Maintenance occupations in Yorktown are Installation, Maintenance & Repair (80 | 1.4%), and Construction & Extraction (54 | 0.9%).
Natural Resources, Construction and Maintenance Occupations by Sex
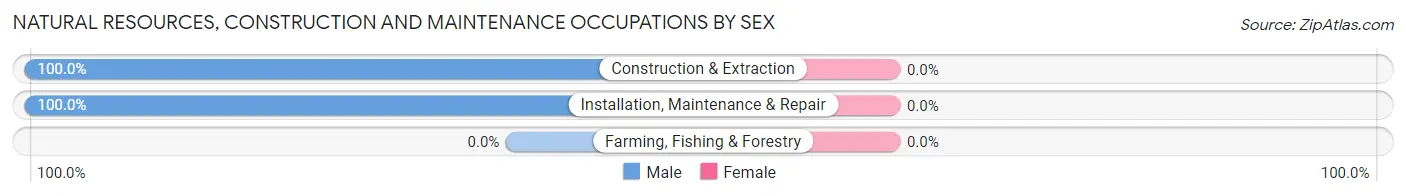
| Occupation | Male | Female |
| Farming, Fishing & Forestry | 0 (0.0%) | 0 (0.0%) |
| Construction & Extraction | 54 (100.0%) | 0 (0.0%) |
| Installation, Maintenance & Repair | 80 (100.0%) | 0 (0.0%) |
| Total (Category) | 134 (100.0%) | 0 (0.0%) |
| Total (Overall) | 3,313 (56.6%) | 2,545 (43.4%) |
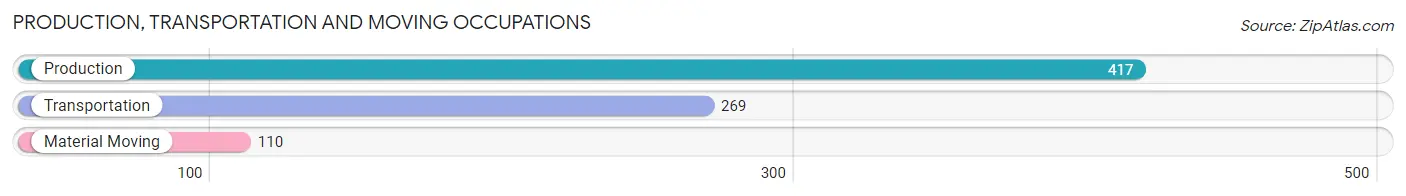
Production, Transportation and Moving Occupations
The most common Production, Transportation and Moving occupations in Yorktown are Production (417 | 7.1%), Transportation (269 | 4.6%), and Material Moving (110 | 1.9%).
Production, Transportation and Moving Occupations by Sex
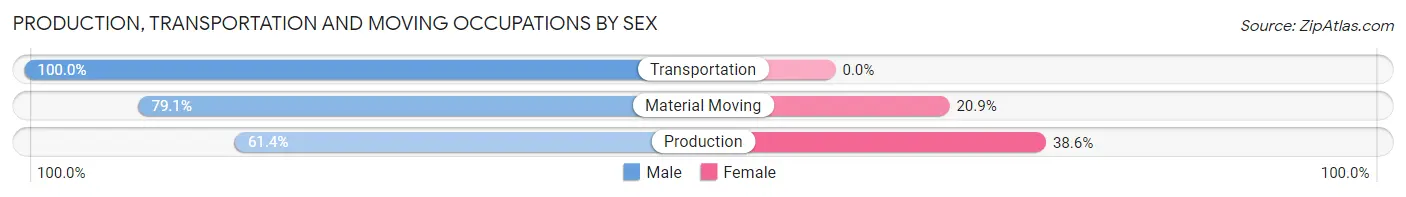
| Occupation | Male | Female |
| Production | 256 (61.4%) | 161 (38.6%) |
| Transportation | 269 (100.0%) | 0 (0.0%) |
| Material Moving | 87 (79.1%) | 23 (20.9%) |
| Total (Category) | 612 (76.9%) | 184 (23.1%) |
| Total (Overall) | 3,313 (56.6%) | 2,545 (43.4%) |
Employment Industries by Sex in Yorktown
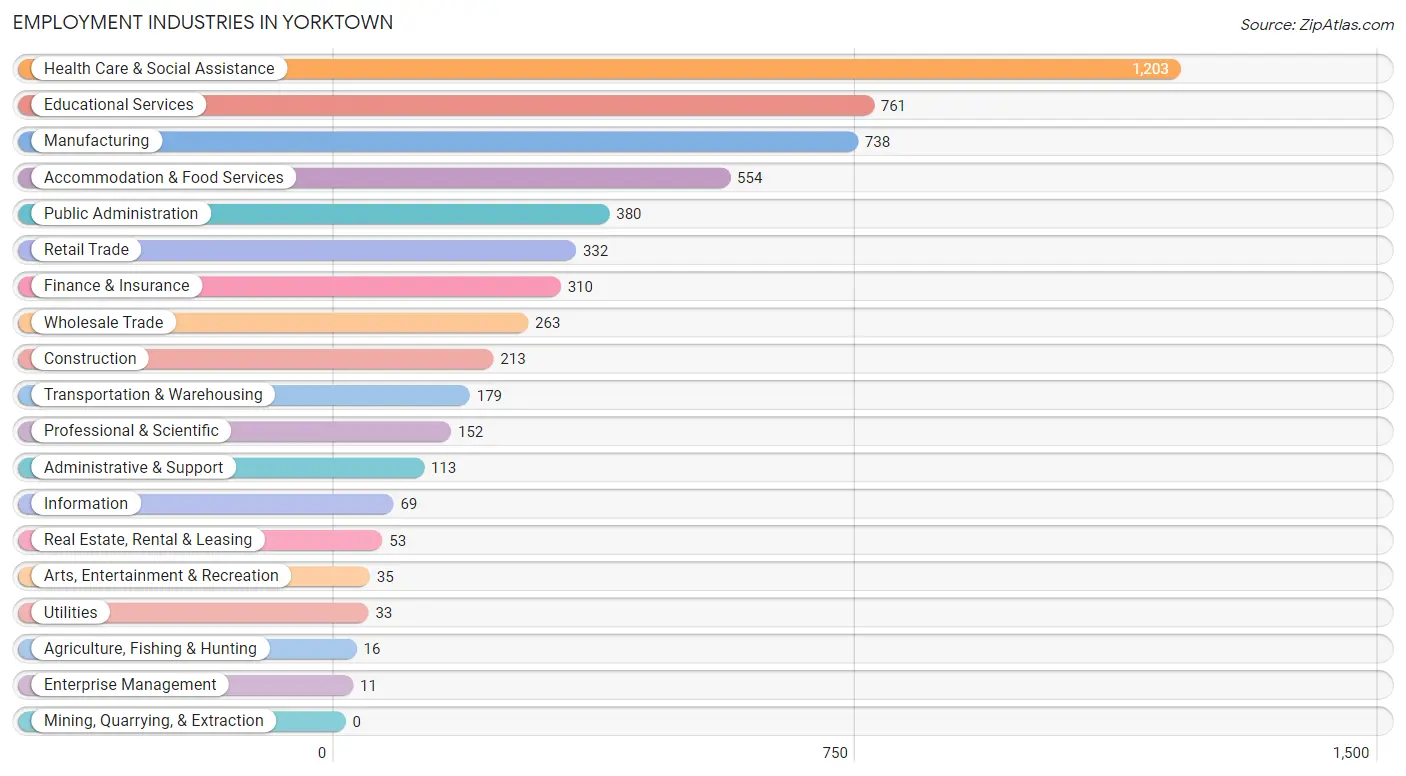
Employment Industries in Yorktown
The major employment industries in Yorktown include Health Care & Social Assistance (1,203 | 20.5%), Educational Services (761 | 13.0%), Manufacturing (738 | 12.6%), Accommodation & Food Services (554 | 9.5%), and Public Administration (380 | 6.5%).
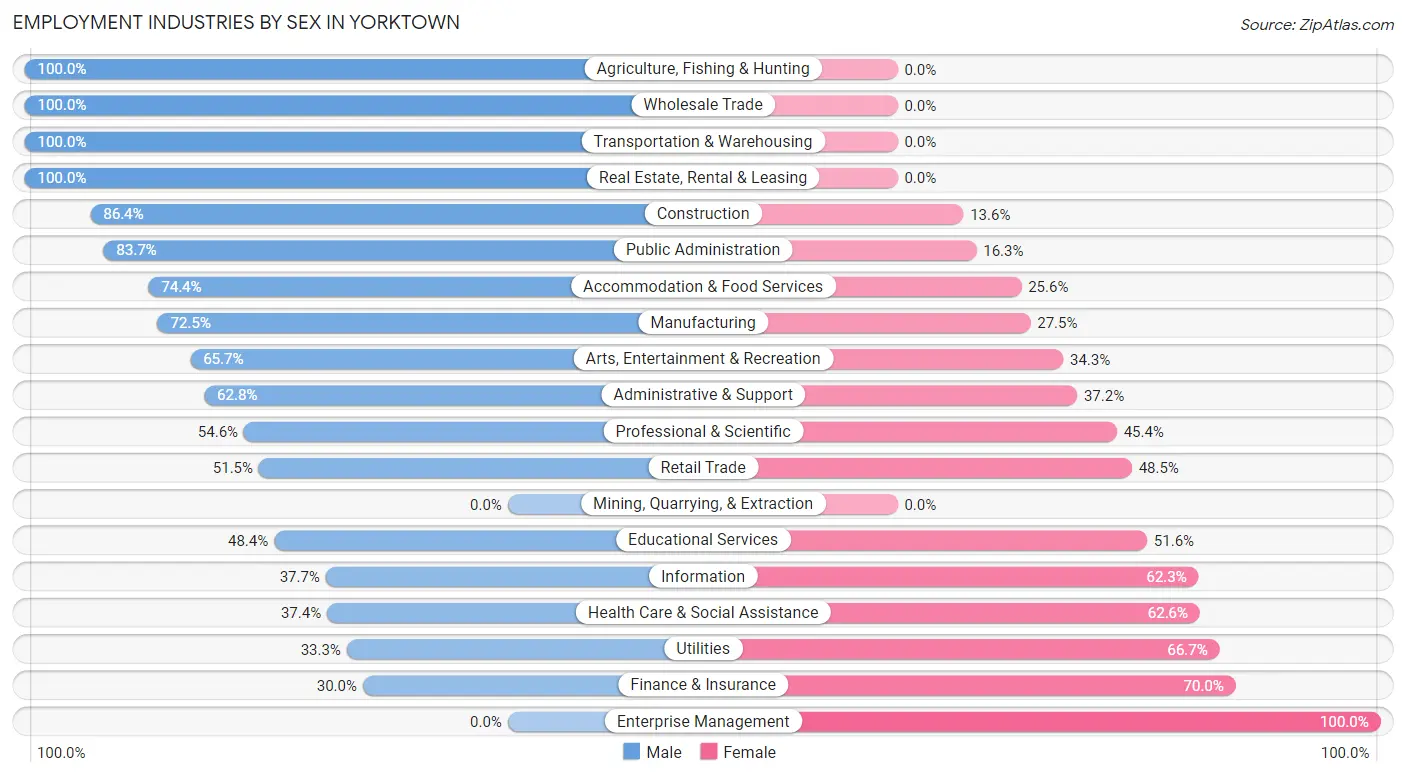
Employment Industries by Sex in Yorktown
The Yorktown industries that see more men than women are Agriculture, Fishing & Hunting (100.0%), Wholesale Trade (100.0%), and Transportation & Warehousing (100.0%), whereas the industries that tend to have a higher number of women are Enterprise Management (100.0%), Finance & Insurance (70.0%), and Utilities (66.7%).
| Industry | Male | Female |
| Agriculture, Fishing & Hunting | 16 (100.0%) | 0 (0.0%) |
| Mining, Quarrying, & Extraction | 0 (0.0%) | 0 (0.0%) |
| Construction | 184 (86.4%) | 29 (13.6%) |
| Manufacturing | 535 (72.5%) | 203 (27.5%) |
| Wholesale Trade | 263 (100.0%) | 0 (0.0%) |
| Retail Trade | 171 (51.5%) | 161 (48.5%) |
| Transportation & Warehousing | 179 (100.0%) | 0 (0.0%) |
| Utilities | 11 (33.3%) | 22 (66.7%) |
| Information | 26 (37.7%) | 43 (62.3%) |
| Finance & Insurance | 93 (30.0%) | 217 (70.0%) |
| Real Estate, Rental & Leasing | 53 (100.0%) | 0 (0.0%) |
| Professional & Scientific | 83 (54.6%) | 69 (45.4%) |
| Enterprise Management | 0 (0.0%) | 11 (100.0%) |
| Administrative & Support | 71 (62.8%) | 42 (37.2%) |
| Educational Services | 368 (48.4%) | 393 (51.6%) |
| Health Care & Social Assistance | 450 (37.4%) | 753 (62.6%) |
| Arts, Entertainment & Recreation | 23 (65.7%) | 12 (34.3%) |
| Accommodation & Food Services | 412 (74.4%) | 142 (25.6%) |
| Public Administration | 318 (83.7%) | 62 (16.3%) |
| Total | 3,313 (56.6%) | 2,545 (43.4%) |
Education in Yorktown
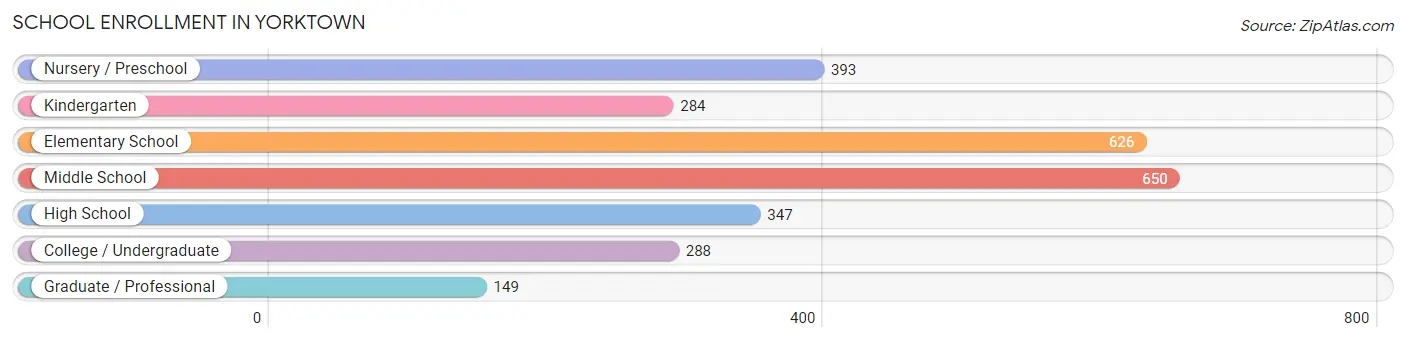
School Enrollment in Yorktown
The most common levels of schooling among the 2,737 students in Yorktown are middle school (650 | 23.7%), elementary school (626 | 22.9%), and nursery / preschool (393 | 14.4%).
| School Level | # Students | % Students |
| Nursery / Preschool | 393 | 14.4% |
| Kindergarten | 284 | 10.4% |
| Elementary School | 626 | 22.9% |
| Middle School | 650 | 23.7% |
| High School | 347 | 12.7% |
| College / Undergraduate | 288 | 10.5% |
| Graduate / Professional | 149 | 5.4% |
| Total | 2,737 | 100.0% |
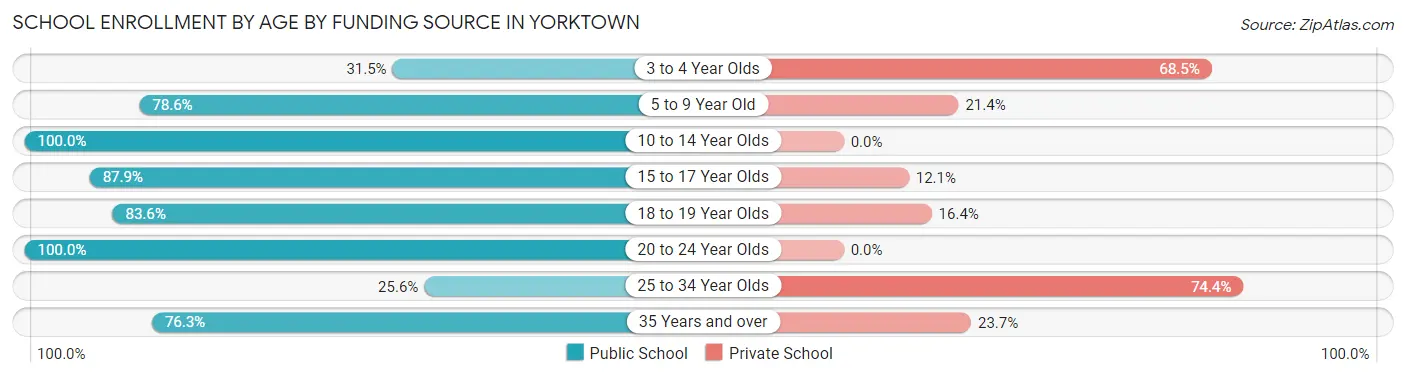
School Enrollment by Age by Funding Source in Yorktown
Out of a total of 2,737 students who are enrolled in schools in Yorktown, 594 (21.7%) attend a private institution, while the remaining 2,143 (78.3%) are enrolled in public schools. The age group of 25 to 34 year olds has the highest likelihood of being enrolled in private schools, with 128 (74.4% in the age bracket) enrolled. Conversely, the age group of 10 to 14 year olds has the lowest likelihood of being enrolled in a private school, with 698 (100.0% in the age bracket) attending a public institution.
| Age Bracket | Public School | Private School |
| 3 to 4 Year Olds | 68 (31.5%) | 148 (68.5%) |
| 5 to 9 Year Old | 838 (78.6%) | 228 (21.4%) |
| 10 to 14 Year Olds | 698 (100.0%) | 0 (0.0%) |
| 15 to 17 Year Olds | 268 (87.9%) | 37 (12.1%) |
| 18 to 19 Year Olds | 51 (83.6%) | 10 (16.4%) |
| 20 to 24 Year Olds | 42 (100.0%) | 0 (0.0%) |
| 25 to 34 Year Olds | 44 (25.6%) | 128 (74.4%) |
| 35 Years and over | 135 (76.3%) | 42 (23.7%) |
| Total | 2,143 (78.3%) | 594 (21.7%) |
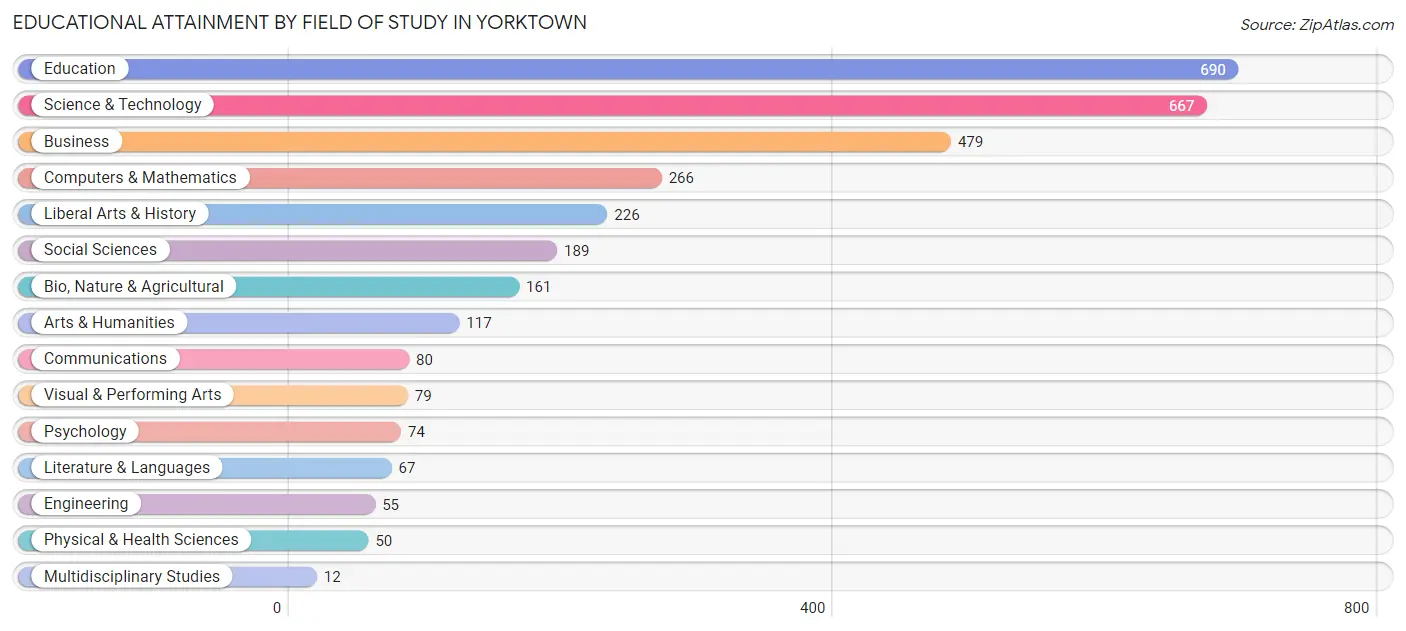
Educational Attainment by Field of Study in Yorktown
Education (690 | 21.5%), science & technology (667 | 20.8%), business (479 | 14.9%), computers & mathematics (266 | 8.3%), and liberal arts & history (226 | 7.0%) are the most common fields of study among 3,212 individuals in Yorktown who have obtained a bachelor's degree or higher.
| Field of Study | # Graduates | % Graduates |
| Computers & Mathematics | 266 | 8.3% |
| Bio, Nature & Agricultural | 161 | 5.0% |
| Physical & Health Sciences | 50 | 1.6% |
| Psychology | 74 | 2.3% |
| Social Sciences | 189 | 5.9% |
| Engineering | 55 | 1.7% |
| Multidisciplinary Studies | 12 | 0.4% |
| Science & Technology | 667 | 20.8% |
| Business | 479 | 14.9% |
| Education | 690 | 21.5% |
| Literature & Languages | 67 | 2.1% |
| Liberal Arts & History | 226 | 7.0% |
| Visual & Performing Arts | 79 | 2.5% |
| Communications | 80 | 2.5% |
| Arts & Humanities | 117 | 3.6% |
| Total | 3,212 | 100.0% |
Transportation & Commute in Yorktown
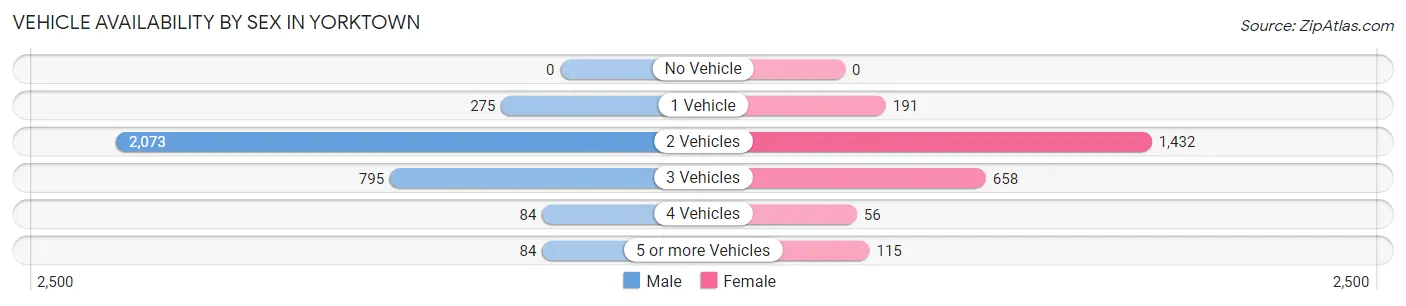
Vehicle Availability by Sex in Yorktown
The most prevalent vehicle ownership categories in Yorktown are males with 2 vehicles (2,073, accounting for 62.6%) and females with 2 vehicles (1,432, making up 84.5%).
| Vehicles Available | Male | Female |
| No Vehicle | 0 (0.0%) | 0 (0.0%) |
| 1 Vehicle | 275 (8.3%) | 191 (7.8%) |
| 2 Vehicles | 2,073 (62.6%) | 1,432 (58.4%) |
| 3 Vehicles | 795 (24.0%) | 658 (26.8%) |
| 4 Vehicles | 84 (2.5%) | 56 (2.3%) |
| 5 or more Vehicles | 84 (2.5%) | 115 (4.7%) |
| Total | 3,311 (100.0%) | 2,452 (100.0%) |
Commute Time in Yorktown
The most frequently occuring commute durations in Yorktown are 15 to 19 minutes (1,266 commuters, 23.4%), 10 to 14 minutes (1,172 commuters, 21.7%), and 5 to 9 minutes (683 commuters, 12.6%).
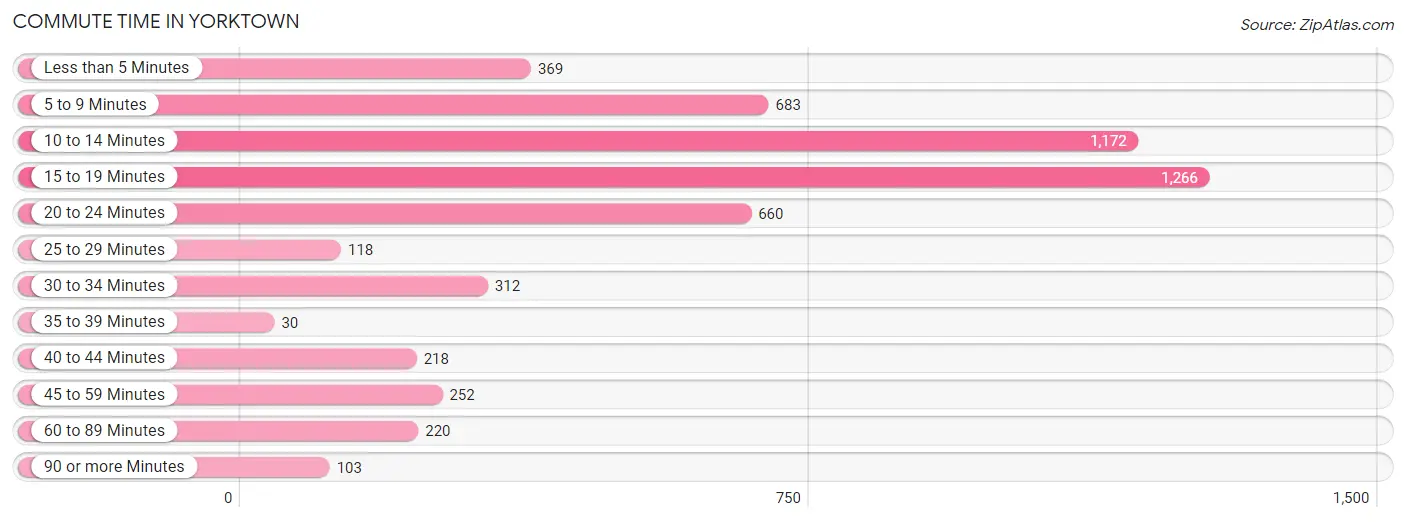
| Commute Time | # Commuters | % Commuters |
| Less than 5 Minutes | 369 | 6.8% |
| 5 to 9 Minutes | 683 | 12.6% |
| 10 to 14 Minutes | 1,172 | 21.7% |
| 15 to 19 Minutes | 1,266 | 23.4% |
| 20 to 24 Minutes | 660 | 12.2% |
| 25 to 29 Minutes | 118 | 2.2% |
| 30 to 34 Minutes | 312 | 5.8% |
| 35 to 39 Minutes | 30 | 0.6% |
| 40 to 44 Minutes | 218 | 4.0% |
| 45 to 59 Minutes | 252 | 4.7% |
| 60 to 89 Minutes | 220 | 4.1% |
| 90 or more Minutes | 103 | 1.9% |
Commute Time by Sex in Yorktown
The most common commute times in Yorktown are 10 to 14 minutes (700 commuters, 22.3%) for males and 15 to 19 minutes (676 commuters, 29.9%) for females.
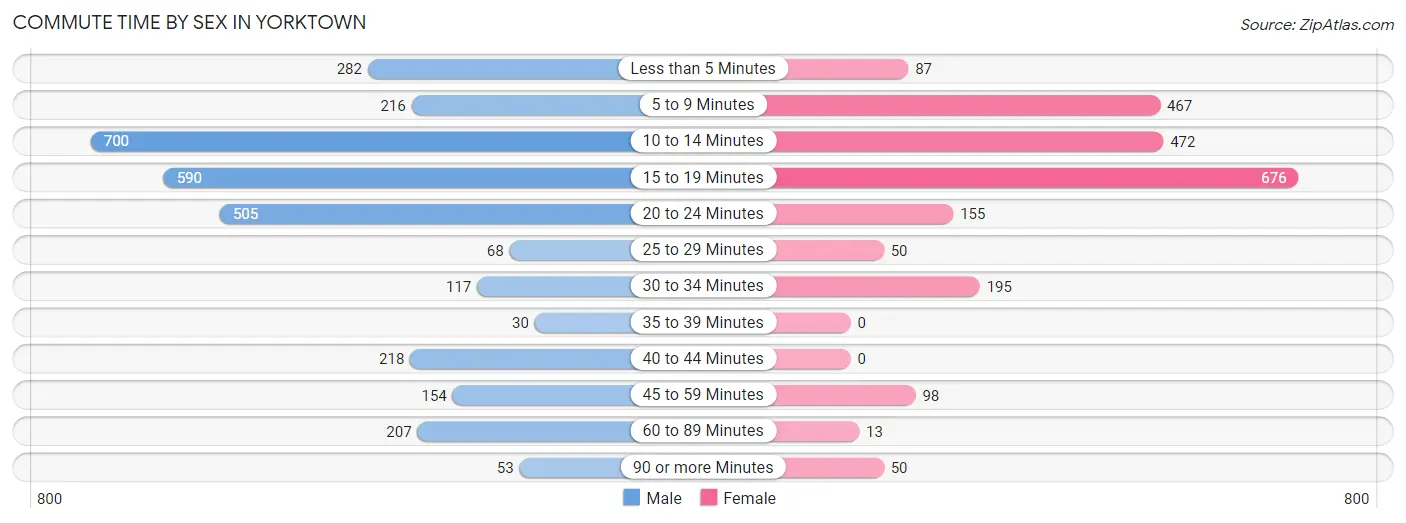
| Commute Time | Male | Female |
| Less than 5 Minutes | 282 (9.0%) | 87 (3.8%) |
| 5 to 9 Minutes | 216 (6.9%) | 467 (20.6%) |
| 10 to 14 Minutes | 700 (22.3%) | 472 (20.9%) |
| 15 to 19 Minutes | 590 (18.8%) | 676 (29.9%) |
| 20 to 24 Minutes | 505 (16.1%) | 155 (6.9%) |
| 25 to 29 Minutes | 68 (2.2%) | 50 (2.2%) |
| 30 to 34 Minutes | 117 (3.7%) | 195 (8.6%) |
| 35 to 39 Minutes | 30 (1.0%) | 0 (0.0%) |
| 40 to 44 Minutes | 218 (6.9%) | 0 (0.0%) |
| 45 to 59 Minutes | 154 (4.9%) | 98 (4.3%) |
| 60 to 89 Minutes | 207 (6.6%) | 13 (0.6%) |
| 90 or more Minutes | 53 (1.7%) | 50 (2.2%) |
Time of Departure to Work by Sex in Yorktown
The most frequent times of departure to work in Yorktown are 7:30 AM to 7:59 AM (744, 23.7%) for males and 8:00 AM to 8:29 AM (444, 19.6%) for females.
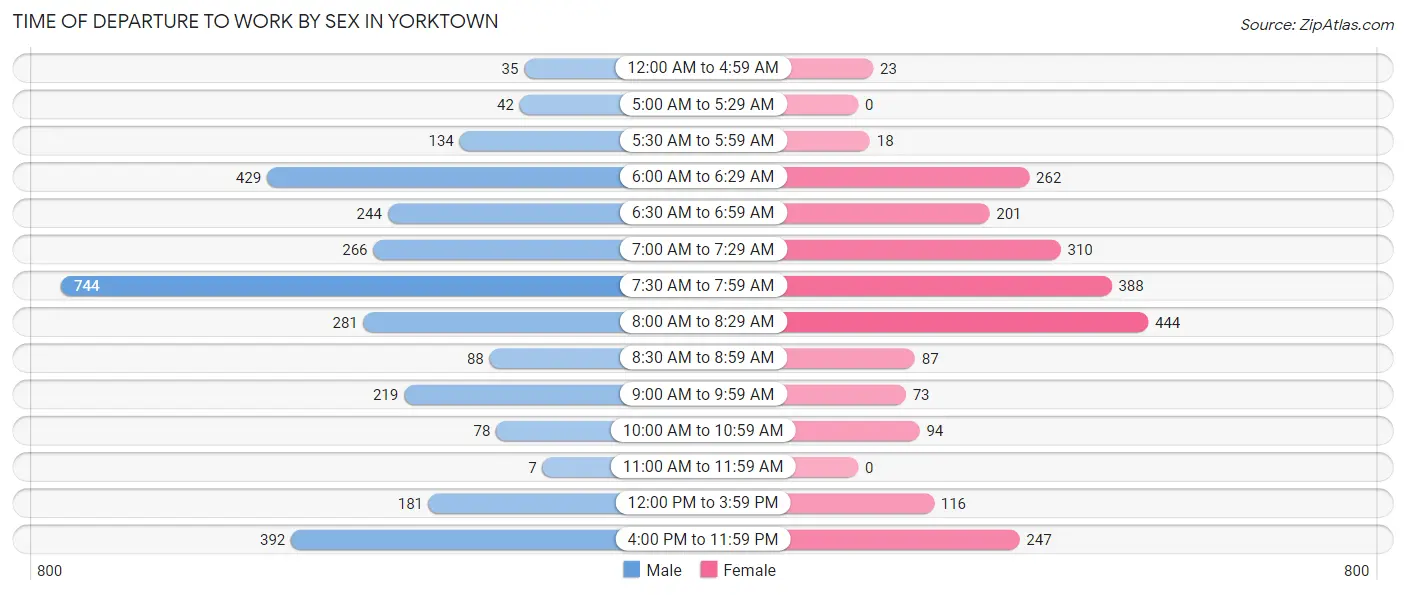
| Time of Departure | Male | Female |
| 12:00 AM to 4:59 AM | 35 (1.1%) | 23 (1.0%) |
| 5:00 AM to 5:29 AM | 42 (1.3%) | 0 (0.0%) |
| 5:30 AM to 5:59 AM | 134 (4.3%) | 18 (0.8%) |
| 6:00 AM to 6:29 AM | 429 (13.7%) | 262 (11.6%) |
| 6:30 AM to 6:59 AM | 244 (7.8%) | 201 (8.9%) |
| 7:00 AM to 7:29 AM | 266 (8.5%) | 310 (13.7%) |
| 7:30 AM to 7:59 AM | 744 (23.7%) | 388 (17.2%) |
| 8:00 AM to 8:29 AM | 281 (8.9%) | 444 (19.6%) |
| 8:30 AM to 8:59 AM | 88 (2.8%) | 87 (3.8%) |
| 9:00 AM to 9:59 AM | 219 (7.0%) | 73 (3.2%) |
| 10:00 AM to 10:59 AM | 78 (2.5%) | 94 (4.2%) |
| 11:00 AM to 11:59 AM | 7 (0.2%) | 0 (0.0%) |
| 12:00 PM to 3:59 PM | 181 (5.8%) | 116 (5.1%) |
| 4:00 PM to 11:59 PM | 392 (12.5%) | 247 (10.9%) |
| Total | 3,140 (100.0%) | 2,263 (100.0%) |
Housing Occupancy in Yorktown
Occupancy by Ownership in Yorktown
Of the total 4,653 dwellings in Yorktown, owner-occupied units account for 4,236 (91.0%), while renter-occupied units make up 417 (9.0%).
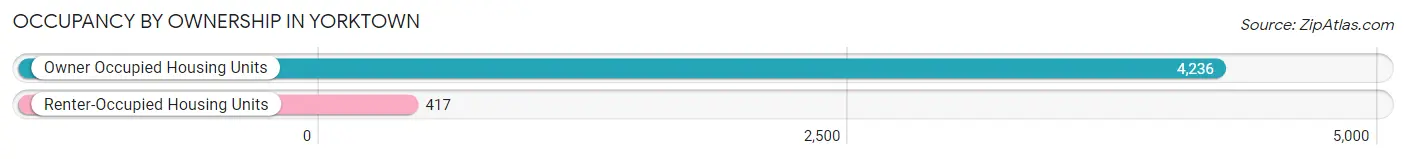
| Occupancy | # Housing Units | % Housing Units |
| Owner Occupied Housing Units | 4,236 | 91.0% |
| Renter-Occupied Housing Units | 417 | 9.0% |
| Total Occupied Housing Units | 4,653 | 100.0% |
Occupancy by Household Size in Yorktown
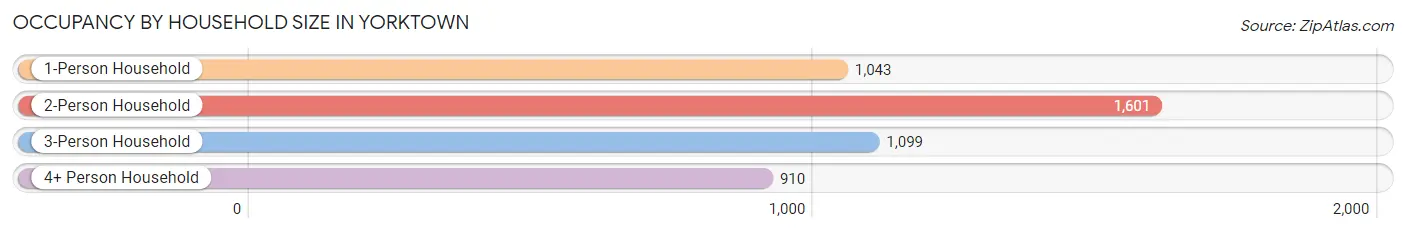
| Household Size | # Housing Units | % Housing Units |
| 1-Person Household | 1,043 | 22.4% |
| 2-Person Household | 1,601 | 34.4% |
| 3-Person Household | 1,099 | 23.6% |
| 4+ Person Household | 910 | 19.6% |
| Total Housing Units | 4,653 | 100.0% |
Occupancy by Ownership by Household Size in Yorktown
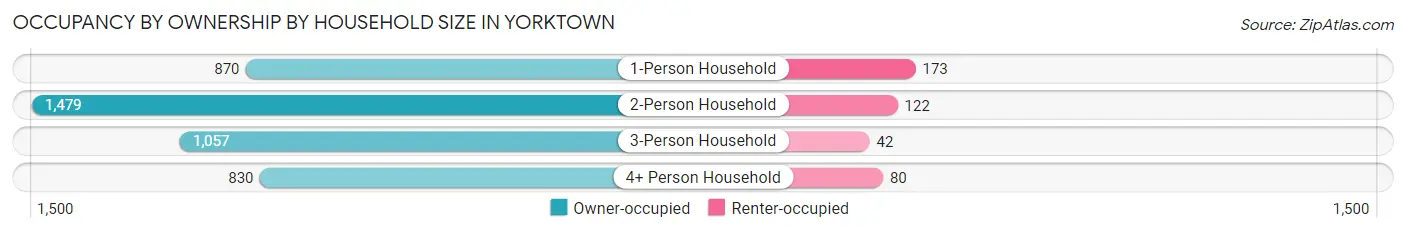
| Household Size | Owner-occupied | Renter-occupied |
| 1-Person Household | 870 (83.4%) | 173 (16.6%) |
| 2-Person Household | 1,479 (92.4%) | 122 (7.6%) |
| 3-Person Household | 1,057 (96.2%) | 42 (3.8%) |
| 4+ Person Household | 830 (91.2%) | 80 (8.8%) |
| Total Housing Units | 4,236 (91.0%) | 417 (9.0%) |
Occupancy by Educational Attainment in Yorktown
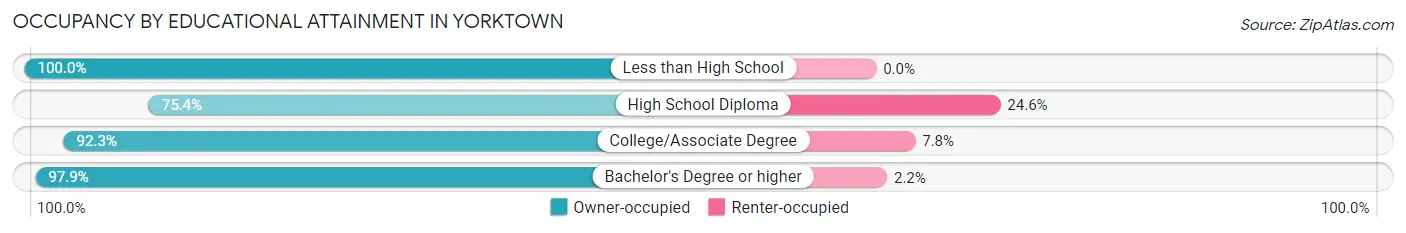
| Household Size | Owner-occupied | Renter-occupied |
| Less than High School | 86 (100.0%) | 0 (0.0%) |
| High School Diploma | 722 (75.4%) | 236 (24.6%) |
| College/Associate Degree | 1,702 (92.2%) | 143 (7.7%) |
| Bachelor's Degree or higher | 1,726 (97.9%) | 38 (2.1%) |
Occupancy by Age of Householder in Yorktown
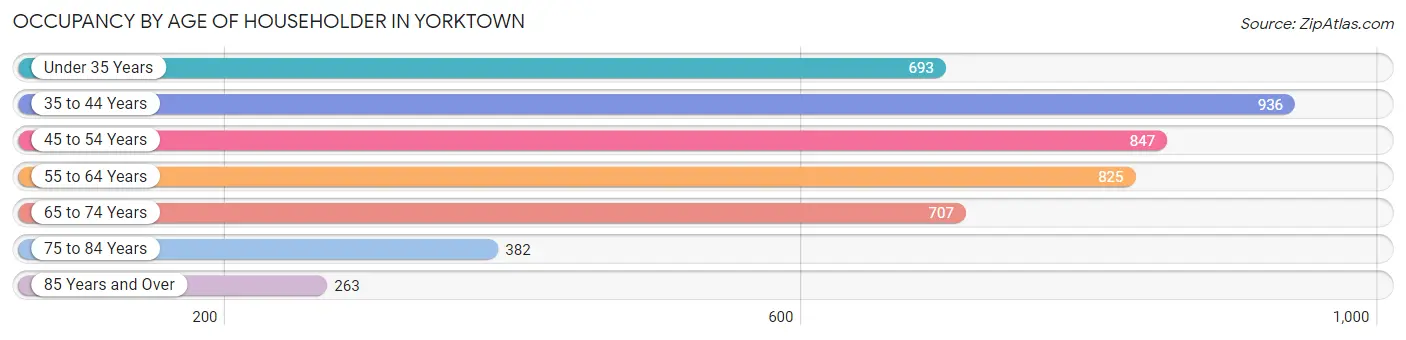
| Age Bracket | # Households | % Households |
| Under 35 Years | 693 | 14.9% |
| 35 to 44 Years | 936 | 20.1% |
| 45 to 54 Years | 847 | 18.2% |
| 55 to 64 Years | 825 | 17.7% |
| 65 to 74 Years | 707 | 15.2% |
| 75 to 84 Years | 382 | 8.2% |
| 85 Years and Over | 263 | 5.7% |
| Total | 4,653 | 100.0% |
Housing Finances in Yorktown
Median Income by Occupancy in Yorktown
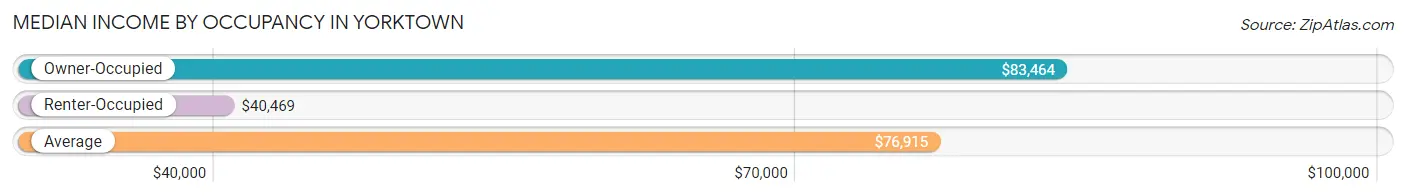
| Occupancy Type | # Households | Median Income |
| Owner-Occupied | 4,236 (91.0%) | $83,464 |
| Renter-Occupied | 417 (9.0%) | $40,469 |
| Average | 4,653 (100.0%) | $76,915 |
Occupancy by Householder Income Bracket in Yorktown
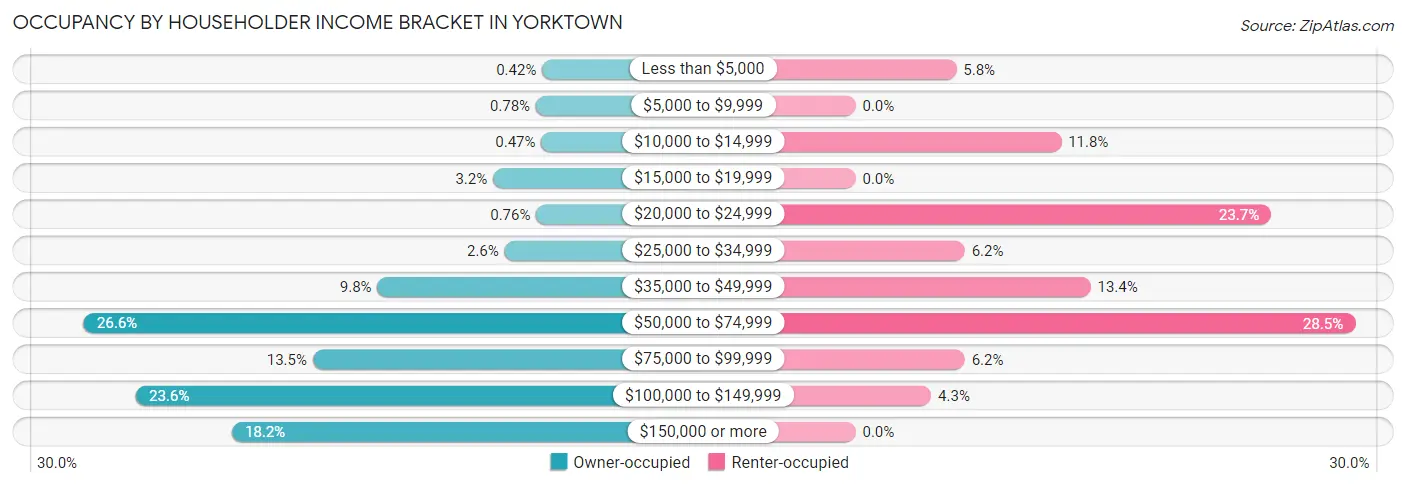
| Income Bracket | Owner-occupied | Renter-occupied |
| Less than $5,000 | 18 (0.4%) | 24 (5.8%) |
| $5,000 to $9,999 | 33 (0.8%) | 0 (0.0%) |
| $10,000 to $14,999 | 20 (0.5%) | 49 (11.7%) |
| $15,000 to $19,999 | 137 (3.2%) | 0 (0.0%) |
| $20,000 to $24,999 | 32 (0.8%) | 99 (23.7%) |
| $25,000 to $34,999 | 109 (2.6%) | 26 (6.2%) |
| $35,000 to $49,999 | 417 (9.8%) | 56 (13.4%) |
| $50,000 to $74,999 | 1,127 (26.6%) | 119 (28.5%) |
| $75,000 to $99,999 | 573 (13.5%) | 26 (6.2%) |
| $100,000 to $149,999 | 1,001 (23.6%) | 18 (4.3%) |
| $150,000 or more | 769 (18.1%) | 0 (0.0%) |
| Total | 4,236 (100.0%) | 417 (100.0%) |
Monthly Housing Cost Tiers in Yorktown
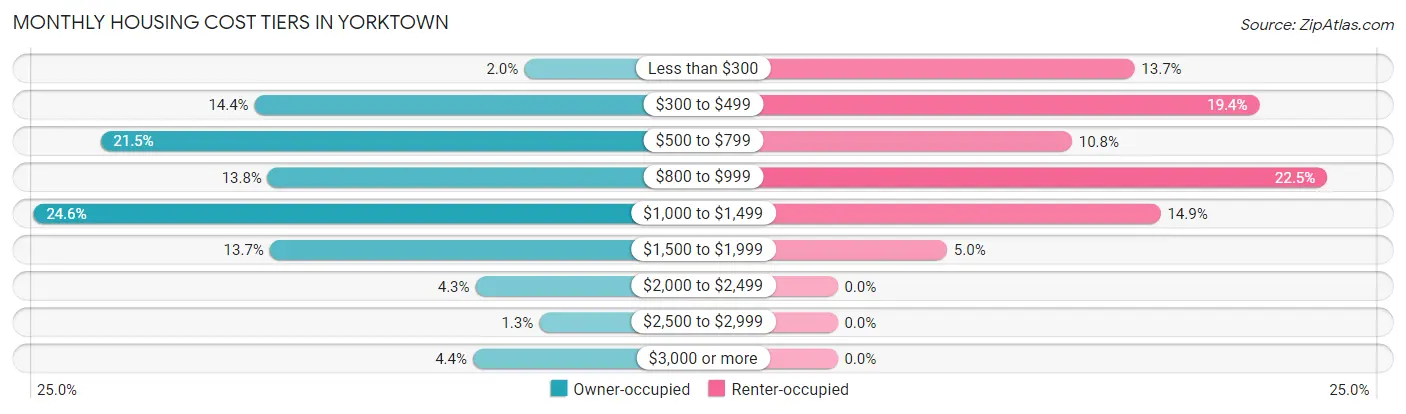
| Monthly Cost | Owner-occupied | Renter-occupied |
| Less than $300 | 85 (2.0%) | 57 (13.7%) |
| $300 to $499 | 611 (14.4%) | 81 (19.4%) |
| $500 to $799 | 911 (21.5%) | 45 (10.8%) |
| $800 to $999 | 585 (13.8%) | 94 (22.5%) |
| $1,000 to $1,499 | 1,042 (24.6%) | 62 (14.9%) |
| $1,500 to $1,999 | 581 (13.7%) | 21 (5.0%) |
| $2,000 to $2,499 | 180 (4.3%) | 0 (0.0%) |
| $2,500 to $2,999 | 56 (1.3%) | 0 (0.0%) |
| $3,000 or more | 185 (4.4%) | 0 (0.0%) |
| Total | 4,236 (100.0%) | 417 (100.0%) |
Physical Housing Characteristics in Yorktown
Housing Structures in Yorktown
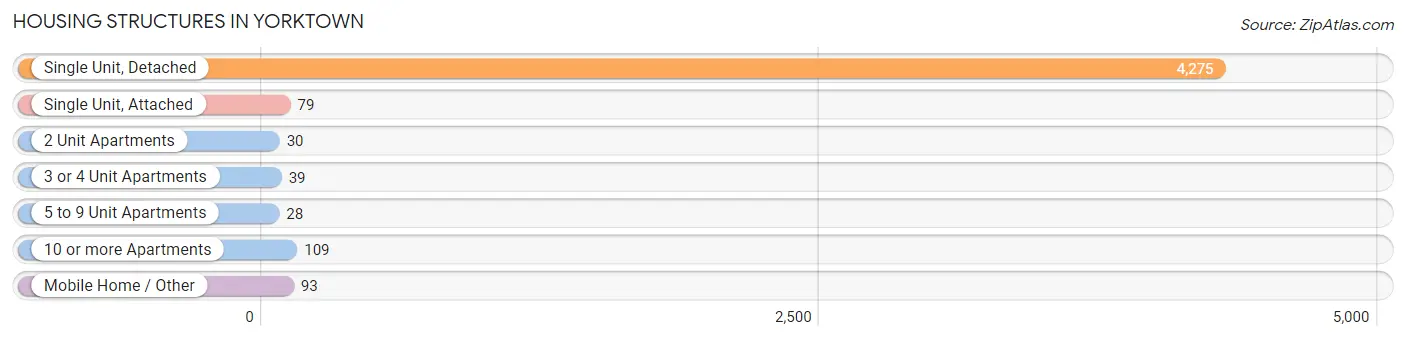
| Structure Type | # Housing Units | % Housing Units |
| Single Unit, Detached | 4,275 | 91.9% |
| Single Unit, Attached | 79 | 1.7% |
| 2 Unit Apartments | 30 | 0.6% |
| 3 or 4 Unit Apartments | 39 | 0.8% |
| 5 to 9 Unit Apartments | 28 | 0.6% |
| 10 or more Apartments | 109 | 2.3% |
| Mobile Home / Other | 93 | 2.0% |
| Total | 4,653 | 100.0% |
Housing Structures by Occupancy in Yorktown
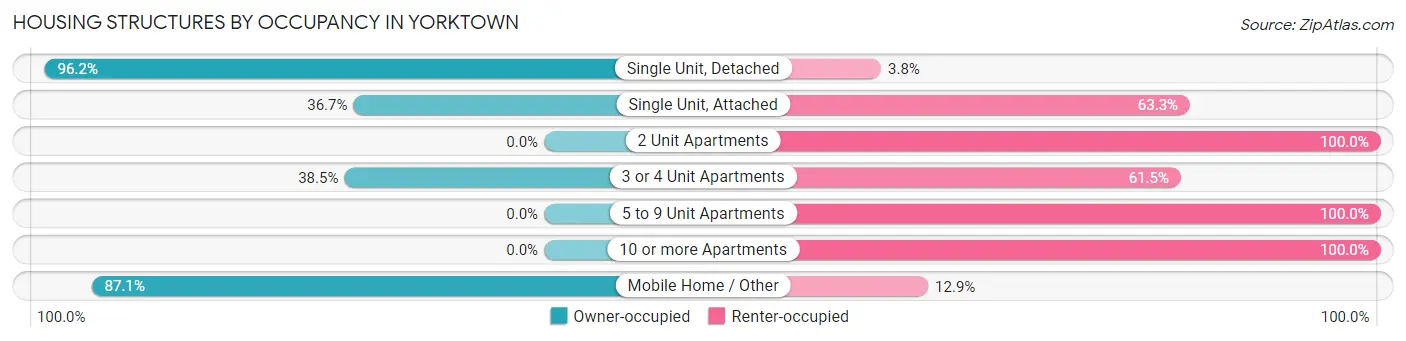
| Structure Type | Owner-occupied | Renter-occupied |
| Single Unit, Detached | 4,111 (96.2%) | 164 (3.8%) |
| Single Unit, Attached | 29 (36.7%) | 50 (63.3%) |
| 2 Unit Apartments | 0 (0.0%) | 30 (100.0%) |
| 3 or 4 Unit Apartments | 15 (38.5%) | 24 (61.5%) |
| 5 to 9 Unit Apartments | 0 (0.0%) | 28 (100.0%) |
| 10 or more Apartments | 0 (0.0%) | 109 (100.0%) |
| Mobile Home / Other | 81 (87.1%) | 12 (12.9%) |
| Total | 4,236 (91.0%) | 417 (9.0%) |
Housing Structures by Number of Rooms in Yorktown
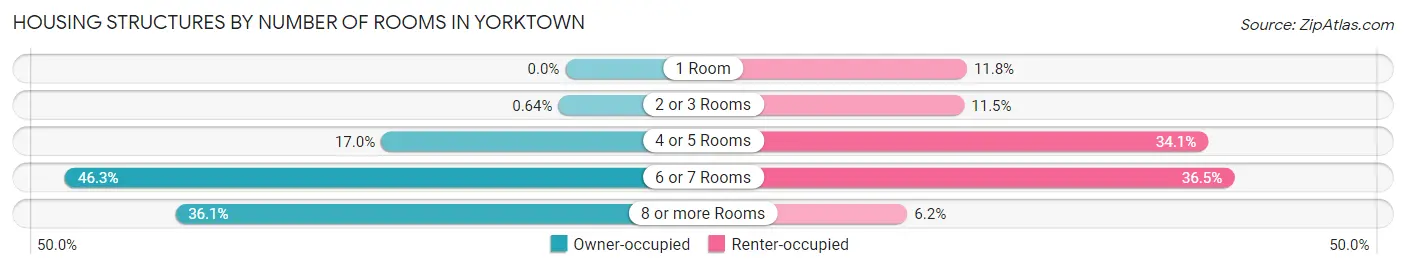
| Number of Rooms | Owner-occupied | Renter-occupied |
| 1 Room | 0 (0.0%) | 49 (11.7%) |
| 2 or 3 Rooms | 27 (0.6%) | 48 (11.5%) |
| 4 or 5 Rooms | 722 (17.0%) | 142 (34.1%) |
| 6 or 7 Rooms | 1,959 (46.3%) | 152 (36.4%) |
| 8 or more Rooms | 1,528 (36.1%) | 26 (6.2%) |
| Total | 4,236 (100.0%) | 417 (100.0%) |
Housing Structure by Heating Type in Yorktown
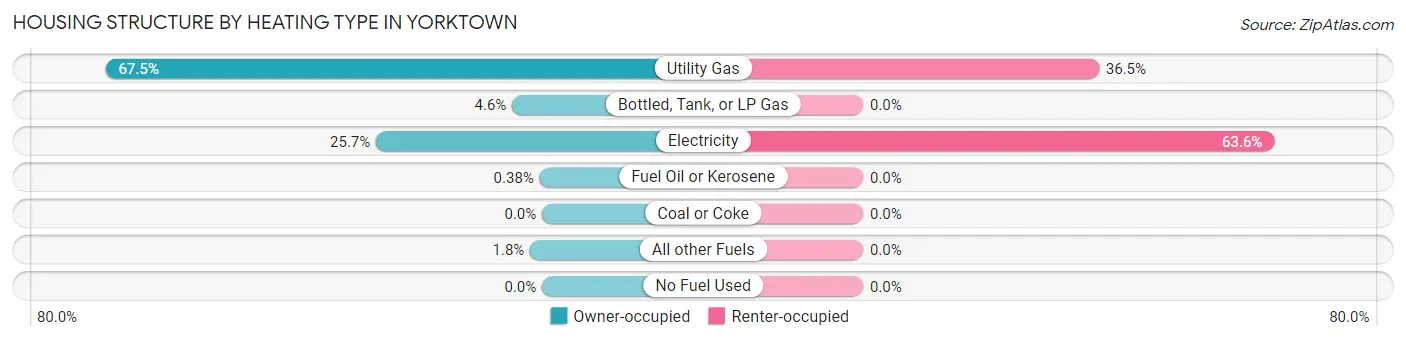
| Heating Type | Owner-occupied | Renter-occupied |
| Utility Gas | 2,859 (67.5%) | 152 (36.4%) |
| Bottled, Tank, or LP Gas | 196 (4.6%) | 0 (0.0%) |
| Electricity | 1,087 (25.7%) | 265 (63.5%) |
| Fuel Oil or Kerosene | 16 (0.4%) | 0 (0.0%) |
| Coal or Coke | 0 (0.0%) | 0 (0.0%) |
| All other Fuels | 78 (1.8%) | 0 (0.0%) |
| No Fuel Used | 0 (0.0%) | 0 (0.0%) |
| Total | 4,236 (100.0%) | 417 (100.0%) |
Household Vehicle Usage in Yorktown
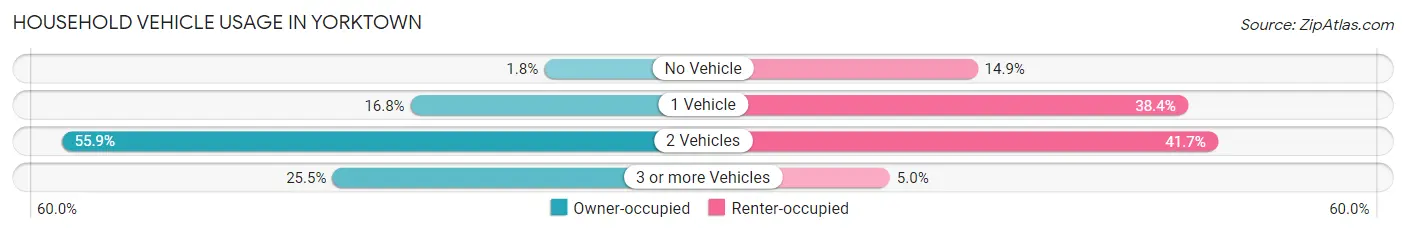
| Vehicles per Household | Owner-occupied | Renter-occupied |
| No Vehicle | 77 (1.8%) | 62 (14.9%) |
| 1 Vehicle | 711 (16.8%) | 160 (38.4%) |
| 2 Vehicles | 2,366 (55.8%) | 174 (41.7%) |
| 3 or more Vehicles | 1,082 (25.5%) | 21 (5.0%) |
| Total | 4,236 (100.0%) | 417 (100.0%) |
Real Estate & Mortgages in Yorktown
Real Estate and Mortgage Overview in Yorktown
| Characteristic | Without Mortgage | With Mortgage |
| Housing Units | 1,233 | 3,003 |
| Median Property Value | $164,400 | $166,300 |
| Median Household Income | $83,495 | $602 |
| Monthly Housing Costs | $477 | $185 |
| Real Estate Taxes | $1,641 | $147 |
Property Value by Mortgage Status in Yorktown
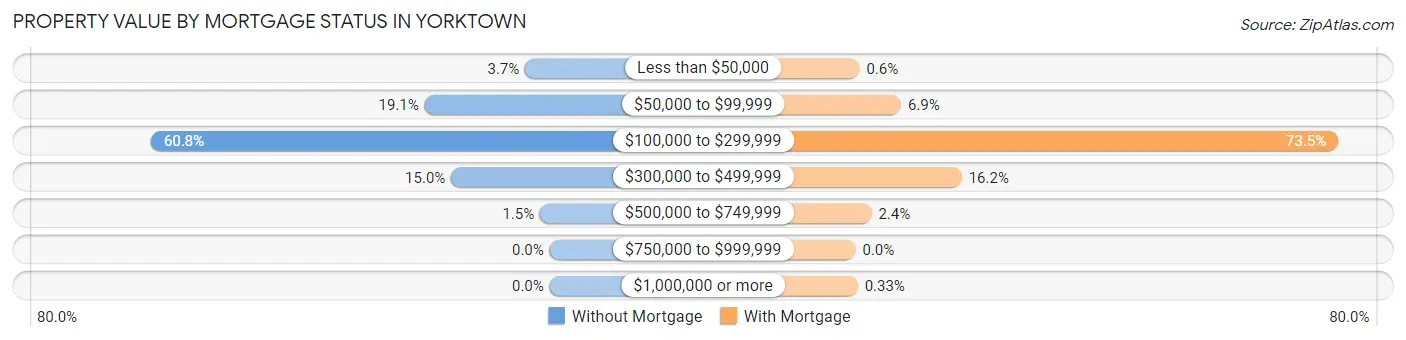
| Property Value | Without Mortgage | With Mortgage |
| Less than $50,000 | 46 (3.7%) | 18 (0.6%) |
| $50,000 to $99,999 | 235 (19.1%) | 208 (6.9%) |
| $100,000 to $299,999 | 749 (60.8%) | 2,208 (73.5%) |
| $300,000 to $499,999 | 185 (15.0%) | 486 (16.2%) |
| $500,000 to $749,999 | 18 (1.5%) | 73 (2.4%) |
| $750,000 to $999,999 | 0 (0.0%) | 0 (0.0%) |
| $1,000,000 or more | 0 (0.0%) | 10 (0.3%) |
| Total | 1,233 (100.0%) | 3,003 (100.0%) |
Household Income by Mortgage Status in Yorktown
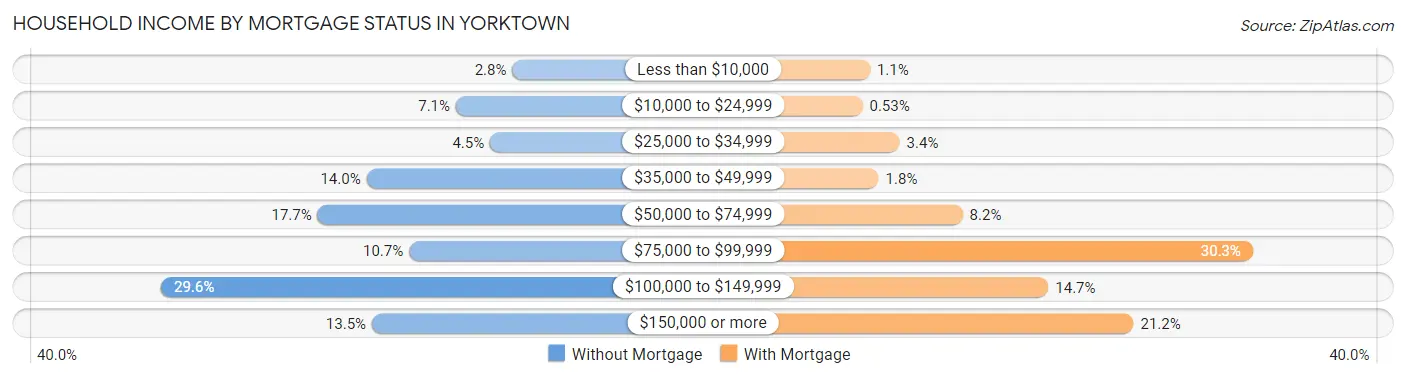
| Household Income | Without Mortgage | With Mortgage |
| Less than $10,000 | 35 (2.8%) | 33 (1.1%) |
| $10,000 to $24,999 | 88 (7.1%) | 16 (0.5%) |
| $25,000 to $34,999 | 56 (4.5%) | 101 (3.4%) |
| $35,000 to $49,999 | 172 (14.0%) | 53 (1.8%) |
| $50,000 to $74,999 | 218 (17.7%) | 245 (8.2%) |
| $75,000 to $99,999 | 132 (10.7%) | 909 (30.3%) |
| $100,000 to $149,999 | 365 (29.6%) | 441 (14.7%) |
| $150,000 or more | 167 (13.5%) | 636 (21.2%) |
| Total | 1,233 (100.0%) | 3,003 (100.0%) |
Property Value to Household Income Ratio in Yorktown
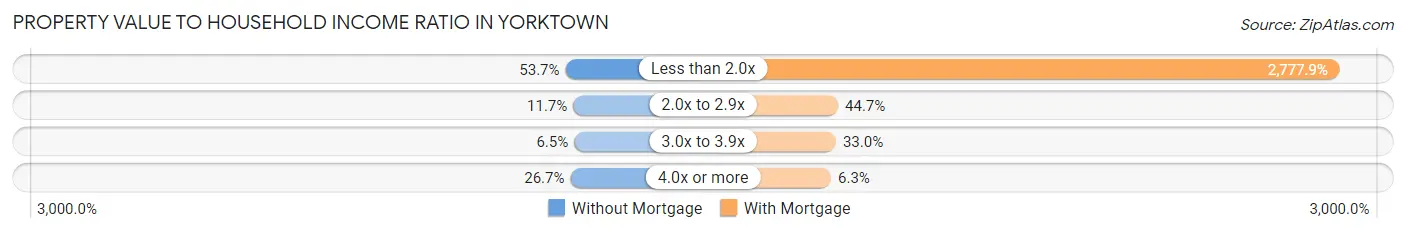
| Value-to-Income Ratio | Without Mortgage | With Mortgage |
| Less than 2.0x | 662 (53.7%) | 83,419 (2,777.9%) |
| 2.0x to 2.9x | 144 (11.7%) | 1,342 (44.7%) |
| 3.0x to 3.9x | 80 (6.5%) | 992 (33.0%) |
| 4.0x or more | 329 (26.7%) | 189 (6.3%) |
| Total | 1,233 (100.0%) | 3,003 (100.0%) |
Real Estate Taxes by Mortgage Status in Yorktown
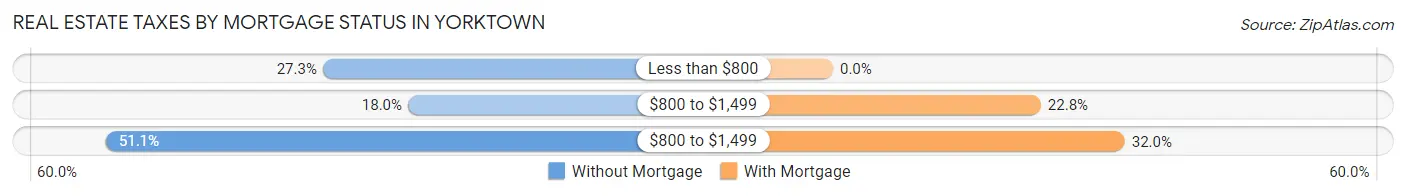
| Property Taxes | Without Mortgage | With Mortgage |
| Less than $800 | 337 (27.3%) | 0 (0.0%) |
| $800 to $1,499 | 222 (18.0%) | 684 (22.8%) |
| $800 to $1,499 | 630 (51.1%) | 960 (32.0%) |
| Total | 1,233 (100.0%) | 3,003 (100.0%) |
Health & Disability in Yorktown
Health Insurance Coverage by Age in Yorktown
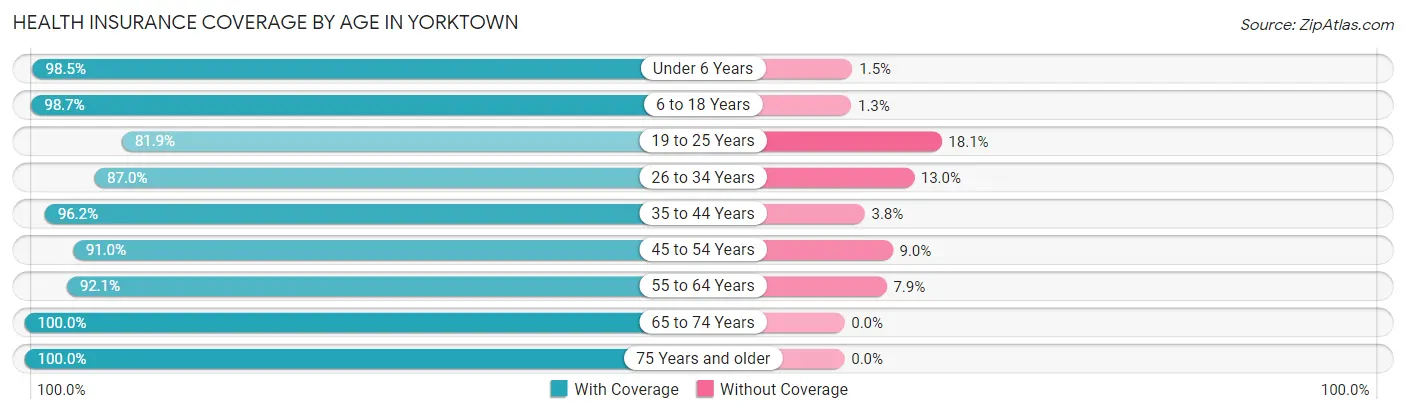
| Age Bracket | With Coverage | Without Coverage |
| Under 6 Years | 1,050 (98.5%) | 16 (1.5%) |
| 6 to 18 Years | 1,796 (98.7%) | 23 (1.3%) |
| 19 to 25 Years | 434 (81.9%) | 96 (18.1%) |
| 26 to 34 Years | 967 (87.0%) | 144 (13.0%) |
| 35 to 44 Years | 1,709 (96.2%) | 67 (3.8%) |
| 45 to 54 Years | 1,285 (91.0%) | 127 (9.0%) |
| 55 to 64 Years | 1,439 (92.1%) | 123 (7.9%) |
| 65 to 74 Years | 1,241 (100.0%) | 0 (0.0%) |
| 75 Years and older | 947 (100.0%) | 0 (0.0%) |
| Total | 10,868 (94.8%) | 596 (5.2%) |
Health Insurance Coverage by Citizenship Status in Yorktown
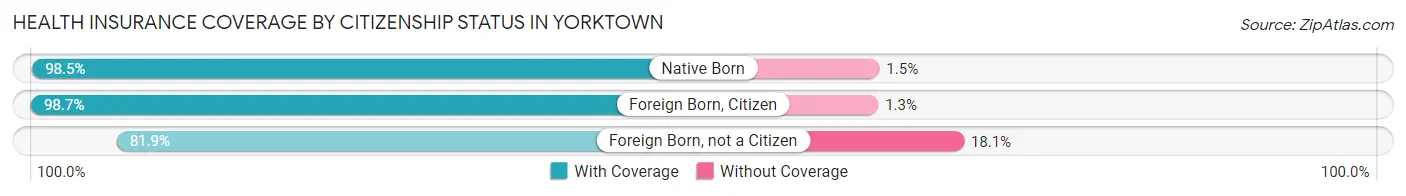
| Citizenship Status | With Coverage | Without Coverage |
| Native Born | 1,050 (98.5%) | 16 (1.5%) |
| Foreign Born, Citizen | 1,796 (98.7%) | 23 (1.3%) |
| Foreign Born, not a Citizen | 434 (81.9%) | 96 (18.1%) |
Health Insurance Coverage by Household Income in Yorktown
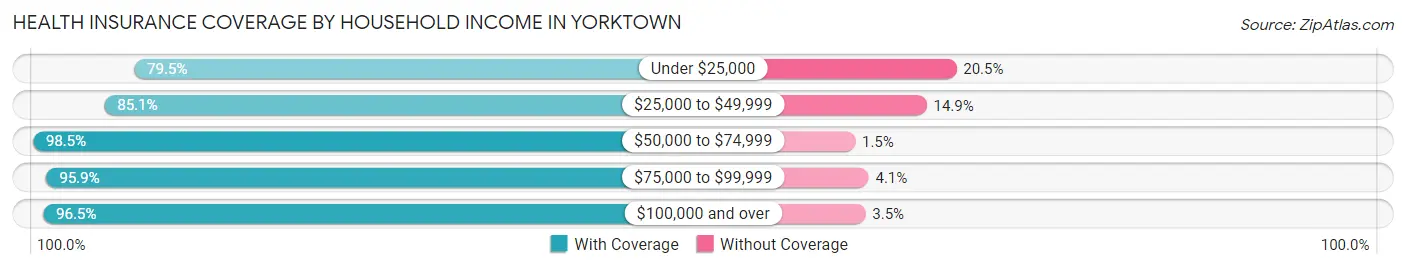
| Household Income | With Coverage | Without Coverage |
| Under $25,000 | 469 (79.5%) | 121 (20.5%) |
| $25,000 to $49,999 | 1,059 (85.1%) | 186 (14.9%) |
| $50,000 to $74,999 | 2,810 (98.5%) | 44 (1.5%) |
| $75,000 to $99,999 | 1,603 (95.9%) | 68 (4.1%) |
| $100,000 and over | 4,922 (96.5%) | 177 (3.5%) |
Public vs Private Health Insurance Coverage by Age in Yorktown
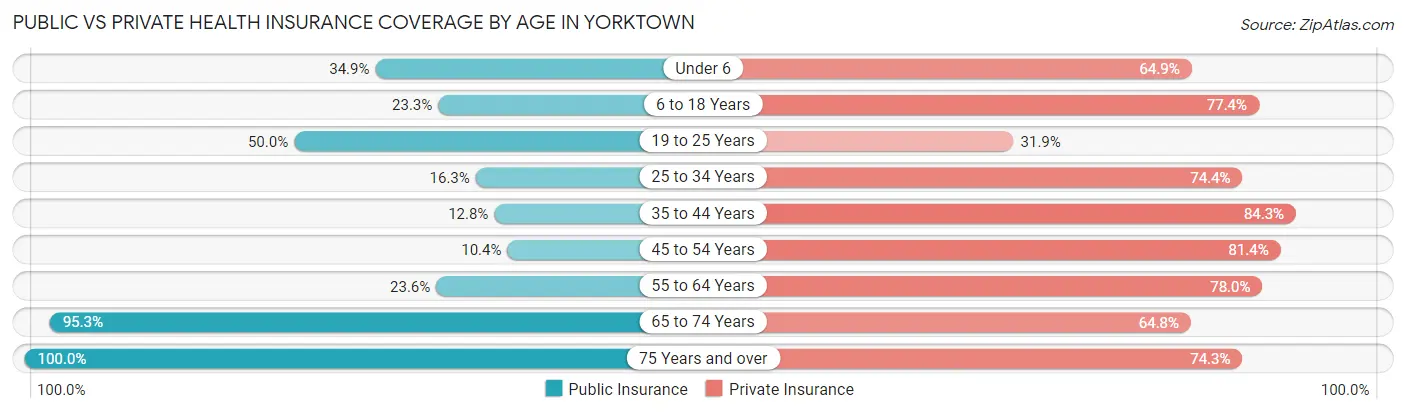
| Age Bracket | Public Insurance | Private Insurance |
| Under 6 | 372 (34.9%) | 692 (64.9%) |
| 6 to 18 Years | 423 (23.3%) | 1,408 (77.4%) |
| 19 to 25 Years | 265 (50.0%) | 169 (31.9%) |
| 25 to 34 Years | 181 (16.3%) | 826 (74.4%) |
| 35 to 44 Years | 228 (12.8%) | 1,497 (84.3%) |
| 45 to 54 Years | 147 (10.4%) | 1,150 (81.4%) |
| 55 to 64 Years | 369 (23.6%) | 1,219 (78.0%) |
| 65 to 74 Years | 1,183 (95.3%) | 804 (64.8%) |
| 75 Years and over | 947 (100.0%) | 704 (74.3%) |
| Total | 4,115 (35.9%) | 8,469 (73.9%) |
Disability Status by Sex by Age in Yorktown
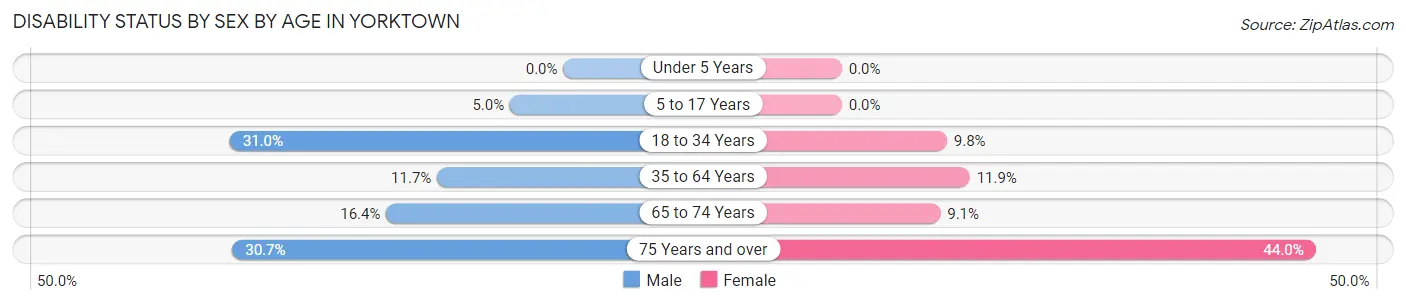
| Age Bracket | Male | Female |
| Under 5 Years | 0 (0.0%) | 0 (0.0%) |
| 5 to 17 Years | 47 (5.0%) | 0 (0.0%) |
| 18 to 34 Years | 303 (30.9%) | 67 (9.8%) |
| 35 to 64 Years | 283 (11.7%) | 277 (11.9%) |
| 65 to 74 Years | 105 (16.4%) | 55 (9.1%) |
| 75 Years and over | 133 (30.7%) | 226 (44.0%) |
Disability Class by Sex by Age in Yorktown
Disability Class: Hearing Difficulty
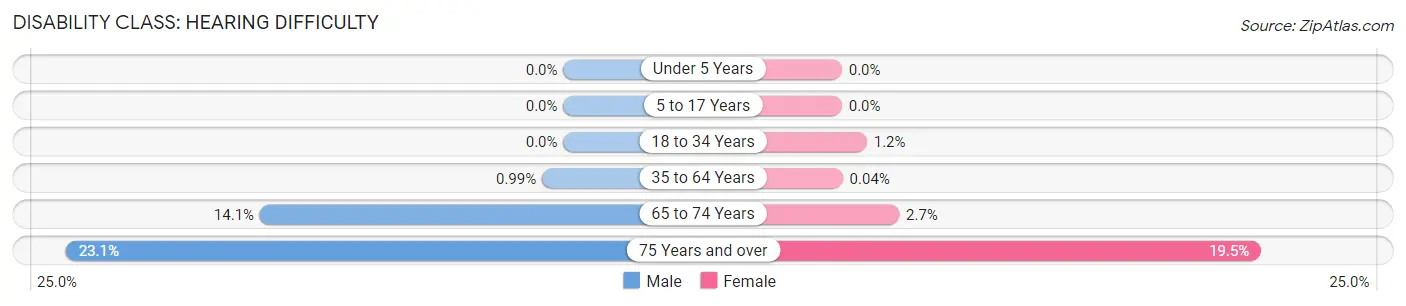
| Age Bracket | Male | Female |
| Under 5 Years | 0 (0.0%) | 0 (0.0%) |
| 5 to 17 Years | 0 (0.0%) | 0 (0.0%) |
| 18 to 34 Years | 0 (0.0%) | 8 (1.2%) |
| 35 to 64 Years | 24 (1.0%) | 1 (0.0%) |
| 65 to 74 Years | 90 (14.1%) | 16 (2.7%) |
| 75 Years and over | 100 (23.1%) | 100 (19.5%) |
Disability Class: Vision Difficulty
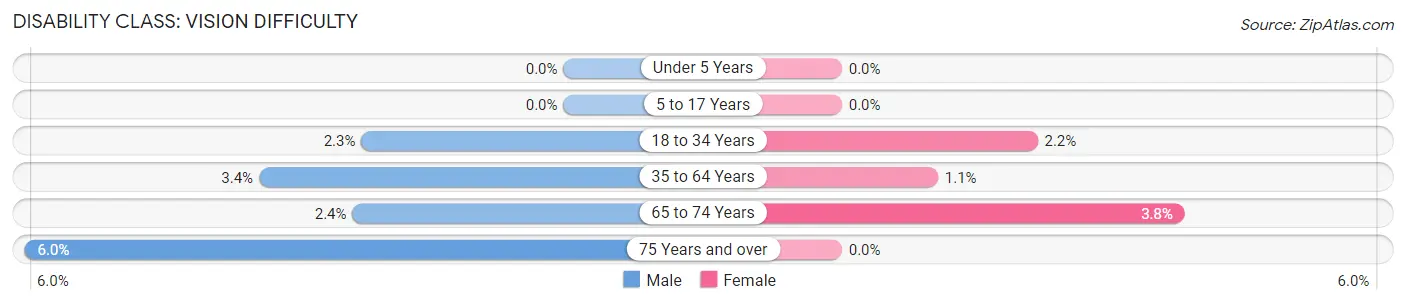
| Age Bracket | Male | Female |
| Under 5 Years | 0 (0.0%) | 0 (0.0%) |
| 5 to 17 Years | 0 (0.0%) | 0 (0.0%) |
| 18 to 34 Years | 22 (2.2%) | 15 (2.2%) |
| 35 to 64 Years | 82 (3.4%) | 25 (1.1%) |
| 65 to 74 Years | 15 (2.4%) | 23 (3.8%) |
| 75 Years and over | 26 (6.0%) | 0 (0.0%) |
Disability Class: Cognitive Difficulty
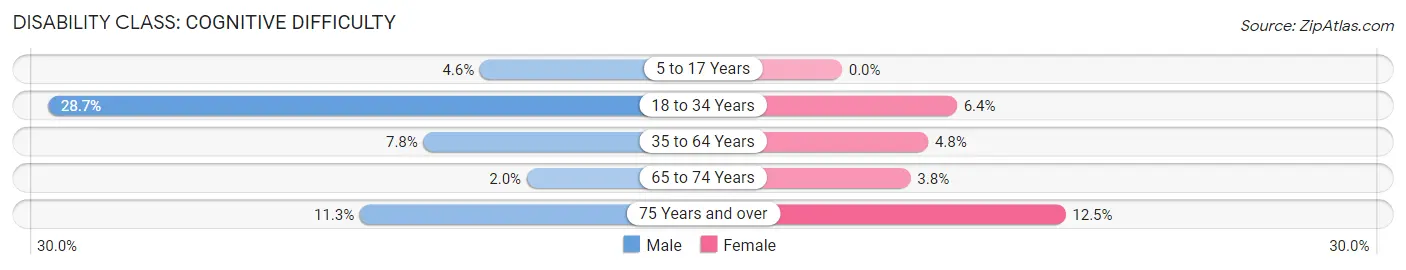
| Age Bracket | Male | Female |
| 5 to 17 Years | 44 (4.6%) | 0 (0.0%) |
| 18 to 34 Years | 281 (28.7%) | 44 (6.4%) |
| 35 to 64 Years | 188 (7.8%) | 112 (4.8%) |
| 65 to 74 Years | 13 (2.0%) | 23 (3.8%) |
| 75 Years and over | 49 (11.3%) | 64 (12.4%) |
Disability Class: Ambulatory Difficulty
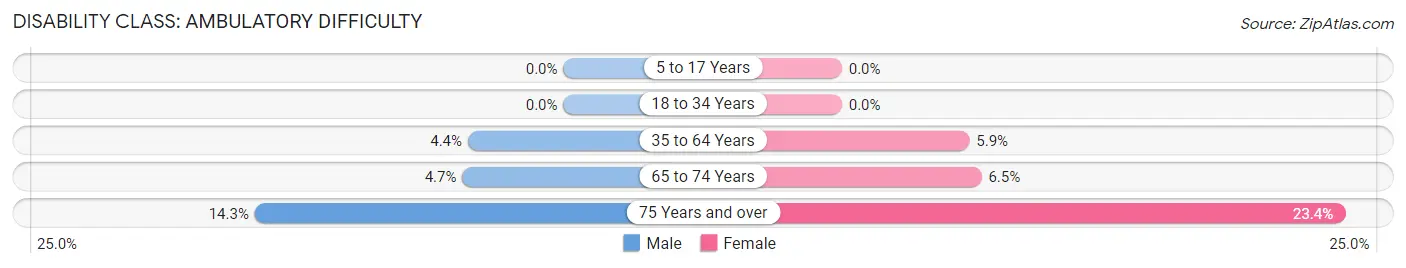
| Age Bracket | Male | Female |
| 5 to 17 Years | 0 (0.0%) | 0 (0.0%) |
| 18 to 34 Years | 0 (0.0%) | 0 (0.0%) |
| 35 to 64 Years | 107 (4.4%) | 138 (5.9%) |
| 65 to 74 Years | 30 (4.7%) | 39 (6.5%) |
| 75 Years and over | 62 (14.3%) | 120 (23.4%) |
Disability Class: Self-Care Difficulty
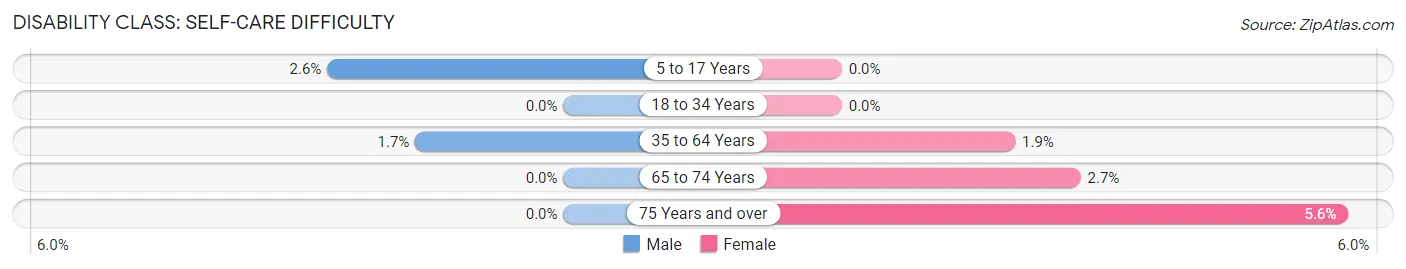
| Age Bracket | Male | Female |
| 5 to 17 Years | 25 (2.6%) | 0 (0.0%) |
| 18 to 34 Years | 0 (0.0%) | 0 (0.0%) |
| 35 to 64 Years | 40 (1.7%) | 45 (1.9%) |
| 65 to 74 Years | 0 (0.0%) | 16 (2.7%) |
| 75 Years and over | 0 (0.0%) | 29 (5.6%) |
Technology Access in Yorktown
Computing Device Access in Yorktown
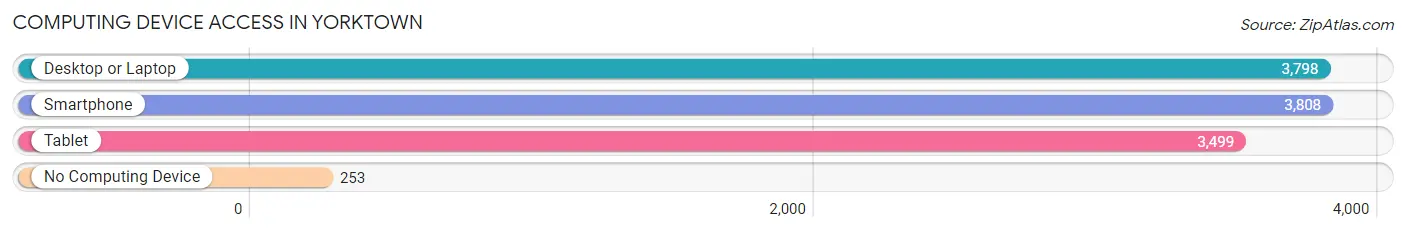
| Device Type | # Households | % Households |
| Desktop or Laptop | 3,798 | 81.6% |
| Smartphone | 3,808 | 81.8% |
| Tablet | 3,499 | 75.2% |
| No Computing Device | 253 | 5.4% |
| Total | 4,653 | 100.0% |
Internet Access in Yorktown
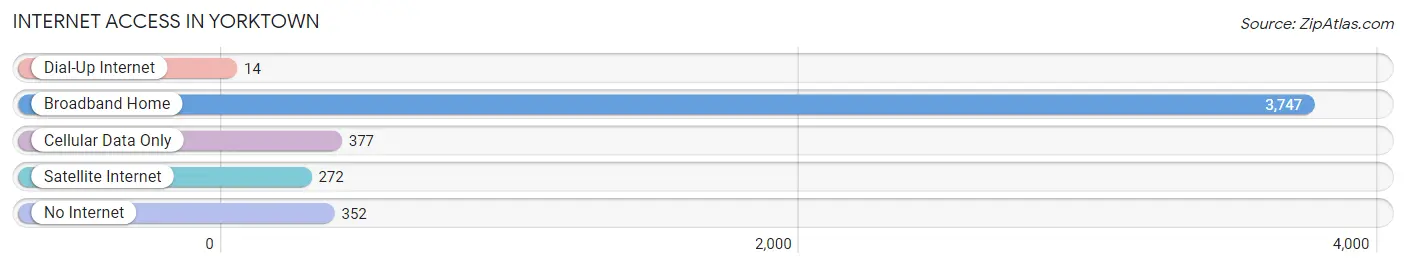
| Internet Type | # Households | % Households |
| Dial-Up Internet | 14 | 0.3% |
| Broadband Home | 3,747 | 80.5% |
| Cellular Data Only | 377 | 8.1% |
| Satellite Internet | 272 | 5.9% |
| No Internet | 352 | 7.6% |
| Total | 4,653 | 100.0% |
Yorktown Summary
Town History
The town of Yorktown, Indiana is located in Delaware County, approximately 20 miles northeast of Muncie. The town was founded in 1836 by a group of settlers from Yorktown, Virginia. The town was named after the Revolutionary War battle that took place in Yorktown, Virginia. The town was originally a farming community, but it soon developed into a manufacturing center. The first industry in the town was a sawmill, which was built in 1837. This was followed by a gristmill, a woolen mill, and a paper mill.
The town grew rapidly in the late 19th century, and by the early 20th century, it had become a major industrial center. The town was home to several factories, including a glass factory, a canning factory, and a brickyard. The town also had a number of stores, including a general store, a drug store, and a hardware store.
In the early 20th century, the town was also home to a number of churches, including the Methodist Episcopal Church, the Presbyterian Church, and the Catholic Church. The town also had a number of schools, including a high school, a junior high school, and an elementary school.
Geography
Yorktown is located in the east-central part of Delaware County, Indiana. The town is situated on the White River, which flows through the town. The town is located approximately 20 miles northeast of Muncie, Indiana. The town is bordered by the towns of Albany, Eaton, and Gaston. The town is also located near the cities of Muncie, Anderson, and Richmond.
The town has a total area of 2.2 square miles, all of which is land. The town has a humid continental climate, with hot summers and cold winters. The average temperature in the summer is around 75 degrees Fahrenheit, and the average temperature in the winter is around 30 degrees Fahrenheit.
Economy
Yorktown’s economy is largely based on manufacturing. The town is home to several factories, including a glass factory, a canning factory, and a brickyard. The town also has a number of stores, including a general store, a drug store, and a hardware store.
The town is also home to a number of businesses, including a number of restaurants, a movie theater, and a bowling alley. The town also has a number of banks, including the First National Bank of Yorktown.
Demographics
As of the 2010 census, the town of Yorktown had a population of 4,719. The town has a population density of 2,093 people per square mile. The median age of the town’s population is 38.7 years.
The town is predominantly white, with 92.3% of the population being white. The town also has a small Hispanic population, with 4.2% of the population being Hispanic. The town also has a small African American population, with 1.7% of the population being African American.
The town has a median household income of $45,945, and the median family income is $54,945. The town also has a poverty rate of 11.3%. The town has a high school graduation rate of 92.3%.
Common Questions
What is Per Capita Income in Yorktown?
Per Capita income in Yorktown is $41,219.
What is the Median Family Income in Yorktown?
Median Family Income in Yorktown is $83,870.
What is the Median Household income in Yorktown?
Median Household Income in Yorktown is $76,915.
What is Income or Wage Gap in Yorktown?
Income or Wage Gap in Yorktown is 6.4%.
Women in Yorktown earn 93.6 cents for every dollar earned by a man.
What is Inequality or Gini Index in Yorktown?
Inequality or Gini Index in Yorktown is 0.39.
What is the Total Population of Yorktown?
Total Population of Yorktown is 11,560.
What is the Total Male Population of Yorktown?
Total Male Population of Yorktown is 5,920.
What is the Total Female Population of Yorktown?
Total Female Population of Yorktown is 5,640.
What is the Ratio of Males per 100 Females in Yorktown?
There are 104.96 Males per 100 Females in Yorktown.
What is the Ratio of Females per 100 Males in Yorktown?
There are 95.27 Females per 100 Males in Yorktown.
What is the Median Population Age in Yorktown?
Median Population Age in Yorktown is 41.7 Years.
What is the Average Family Size in Yorktown
Average Family Size in Yorktown is 2.8 People.
What is the Average Household Size in Yorktown
Average Household Size in Yorktown is 2.5 People.
How Large is the Labor Force in Yorktown?
There are 5,940 People in the Labor Forcein in Yorktown.
What is the Percentage of People in the Labor Force in Yorktown?
66.5% of People are in the Labor Force in Yorktown.
What is the Unemployment Rate in Yorktown?
Unemployment Rate in Yorktown is 1.0%.