Williamsport, IN Map & Demographics
Williamsport Map
Williamsport Overview
$31,660
PER CAPITA INCOME
$69,655
AVG FAMILY INCOME
$62,868
AVG HOUSEHOLD INCOME
43.1%
WAGE / INCOME GAP [ % ]
56.9¢/ $1
WAGE / INCOME GAP [ $ ]
$9,394
FAMILY INCOME DEFICIT
0.42
INEQUALITY / GINI INDEX
1,847
TOTAL POPULATION
866
MALE POPULATION
981
FEMALE POPULATION
88.28
MALES / 100 FEMALES
113.28
FEMALES / 100 MALES
43.1
MEDIAN AGE
2.9
AVG FAMILY SIZE
2.6
AVG HOUSEHOLD SIZE
921
LABOR FORCE [ PEOPLE ]
60.3%
PERCENT IN LABOR FORCE
1.2%
UNEMPLOYMENT RATE
Williamsport Zip Codes
Williamsport Area Codes
Income in Williamsport
Income Overview in Williamsport
Per Capita Income in Williamsport is $31,660, while median incomes of families and households are $69,655 and $62,868 respectively.
| Characteristic | Number | Measure |
| Per Capita Income | 1,847 | $31,660 |
| Median Family Income | 488 | $69,655 |
| Mean Family Income | 488 | $87,779 |
| Median Household Income | 683 | $62,868 |
| Mean Household Income | 683 | $77,834 |
| Income Deficit | 488 | $9,394 |
| Wage / Income Gap (%) | 1,847 | 43.10% |
| Wage / Income Gap ($) | 1,847 | 56.90¢ per $1 |
| Gini / Inequality Index | 1,847 | 0.42 |
Earnings by Sex in Williamsport
Average Earnings in Williamsport are $36,893, $46,250 for men and $26,316 for women, a difference of 43.1%.
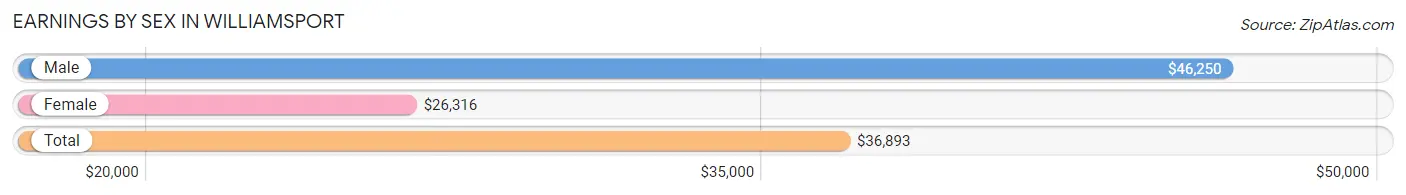
| Sex | Number | Average Earnings |
| Male | 549 (55.6%) | $46,250 |
| Female | 438 (44.4%) | $26,316 |
| Total | 987 (100.0%) | $36,893 |
Earnings by Sex by Income Bracket in Williamsport
The most common earnings brackets in Williamsport are $55,000 to $64,999 for men (78 | 14.2%) and $2,499 or less for women (59 | 13.5%).
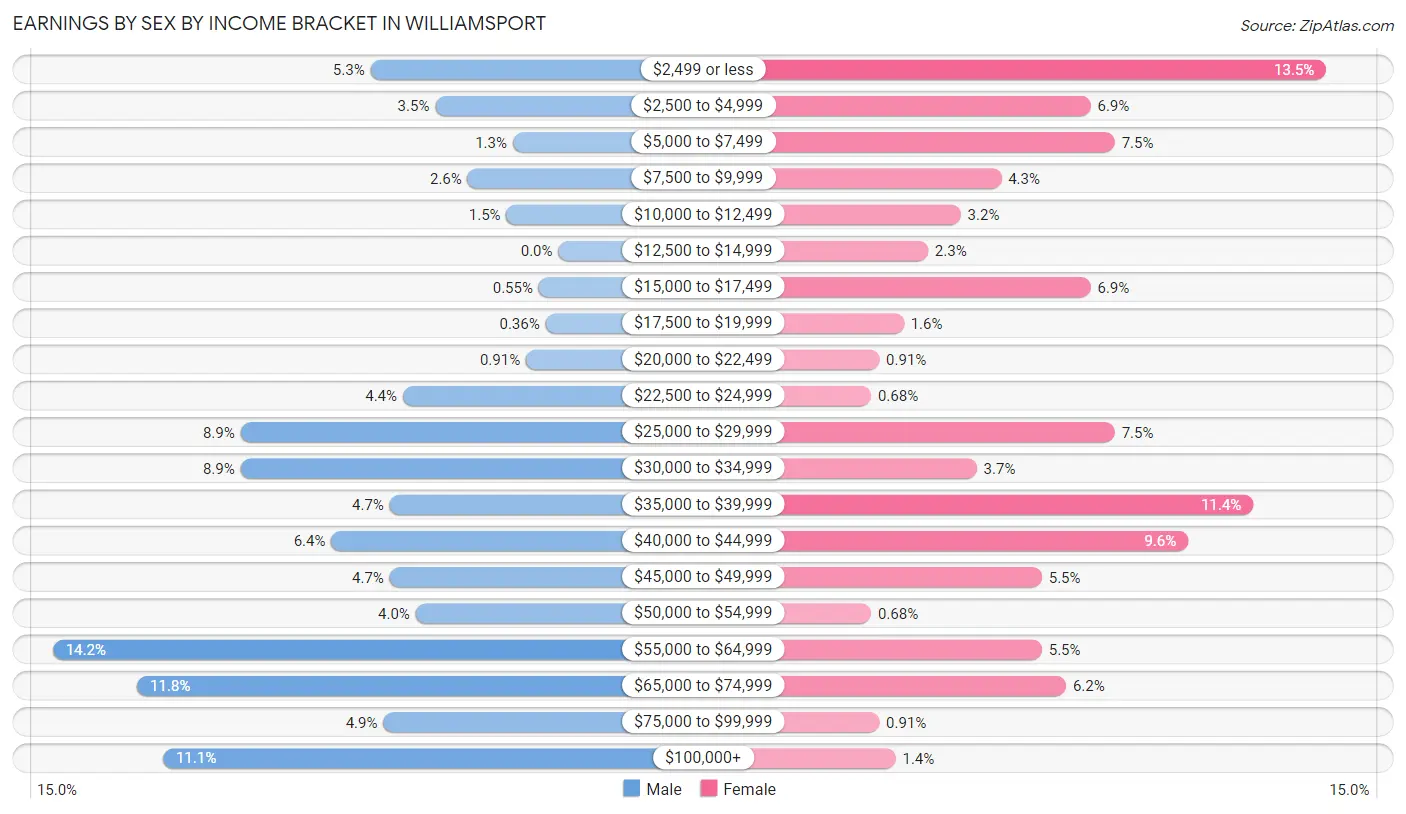
| Income | Male | Female |
| $2,499 or less | 29 (5.3%) | 59 (13.5%) |
| $2,500 to $4,999 | 19 (3.5%) | 30 (6.9%) |
| $5,000 to $7,499 | 7 (1.3%) | 33 (7.5%) |
| $7,500 to $9,999 | 14 (2.5%) | 19 (4.3%) |
| $10,000 to $12,499 | 8 (1.5%) | 14 (3.2%) |
| $12,500 to $14,999 | 0 (0.0%) | 10 (2.3%) |
| $15,000 to $17,499 | 3 (0.5%) | 30 (6.9%) |
| $17,500 to $19,999 | 2 (0.4%) | 7 (1.6%) |
| $20,000 to $22,499 | 5 (0.9%) | 4 (0.9%) |
| $22,500 to $24,999 | 24 (4.4%) | 3 (0.7%) |
| $25,000 to $29,999 | 49 (8.9%) | 33 (7.5%) |
| $30,000 to $34,999 | 49 (8.9%) | 16 (3.6%) |
| $35,000 to $39,999 | 26 (4.7%) | 50 (11.4%) |
| $40,000 to $44,999 | 35 (6.4%) | 42 (9.6%) |
| $45,000 to $49,999 | 26 (4.7%) | 24 (5.5%) |
| $50,000 to $54,999 | 22 (4.0%) | 3 (0.7%) |
| $55,000 to $64,999 | 78 (14.2%) | 24 (5.5%) |
| $65,000 to $74,999 | 65 (11.8%) | 27 (6.2%) |
| $75,000 to $99,999 | 27 (4.9%) | 4 (0.9%) |
| $100,000+ | 61 (11.1%) | 6 (1.4%) |
| Total | 549 (100.0%) | 438 (100.0%) |
Earnings by Sex by Educational Attainment in Williamsport
Average earnings in Williamsport are $53,750 for men and $32,143 for women, a difference of 40.2%. Men with an educational attainment of graduate degree enjoy the highest average annual earnings of $228,125, while those with less than high school education earn the least with $24,375. Women with an educational attainment of college or associate's degree earn the most with the average annual earnings of $36,083, while those with high school diploma education have the smallest earnings of $26,125.
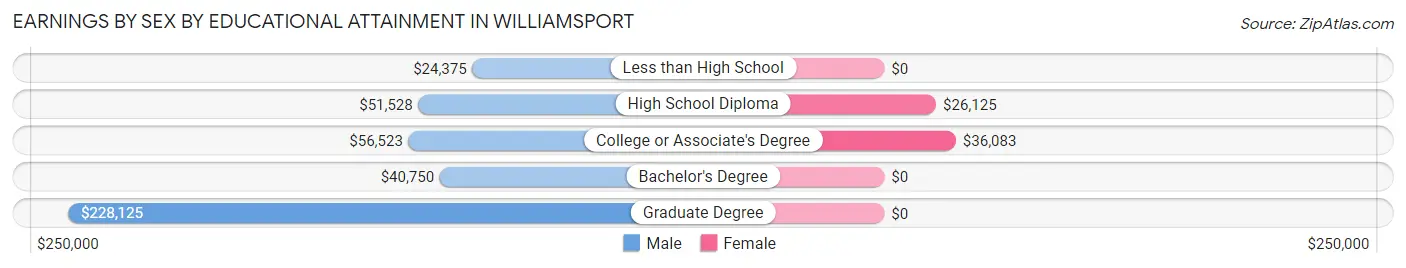
| Educational Attainment | Male Income | Female Income |
| Less than High School | $24,375 | $0 |
| High School Diploma | $51,528 | $26,125 |
| College or Associate's Degree | $56,523 | $36,083 |
| Bachelor's Degree | $40,750 | $0 |
| Graduate Degree | $228,125 | $0 |
| Total | $53,750 | $32,143 |
Family Income in Williamsport
Family Income Brackets in Williamsport
According to the Williamsport family income data, there are 84 families falling into the $50,000 to $74,999 income range, which is the most common income bracket and makes up 17.2% of all families. Conversely, the $15,000 to $24,999 income bracket is the least frequent group with only 4 families (0.8%) belonging to this category.
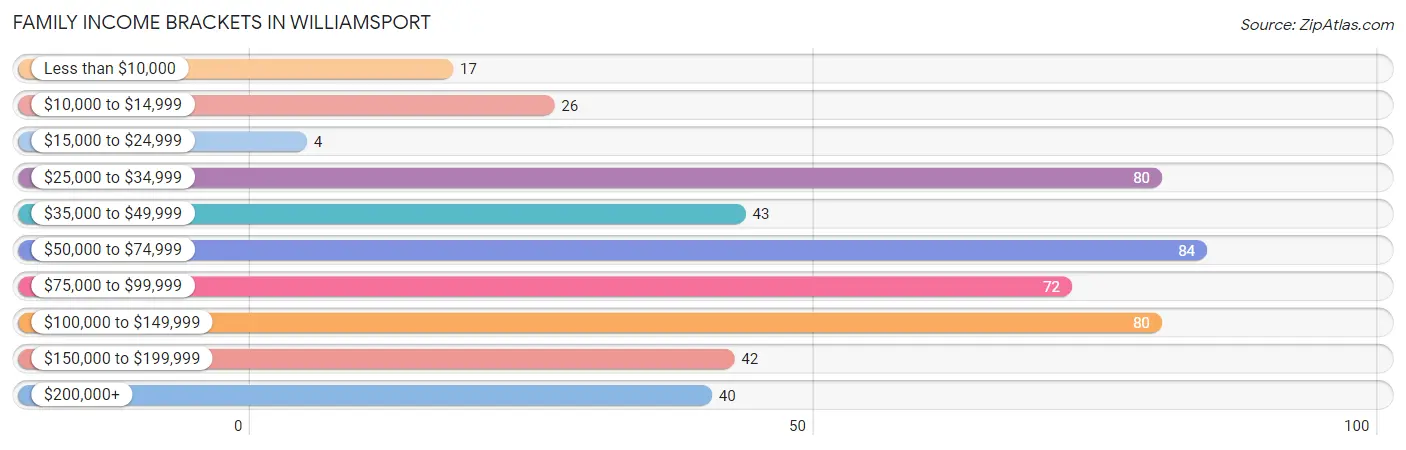
| Income Bracket | # Families | % Families |
| Less than $10,000 | 17 | 3.5% |
| $10,000 to $14,999 | 26 | 5.3% |
| $15,000 to $24,999 | 4 | 0.8% |
| $25,000 to $34,999 | 80 | 16.4% |
| $35,000 to $49,999 | 43 | 8.8% |
| $50,000 to $74,999 | 84 | 17.2% |
| $75,000 to $99,999 | 72 | 14.8% |
| $100,000 to $149,999 | 80 | 16.4% |
| $150,000 to $199,999 | 42 | 8.6% |
| $200,000+ | 40 | 8.2% |
Family Income by Famaliy Size in Williamsport
6-person families (18 | 3.7%) account for the highest median family income in Williamsport with $161,250 per family, while 2-person families (249 | 51.0%) have the highest median income of $32,366 per family member.
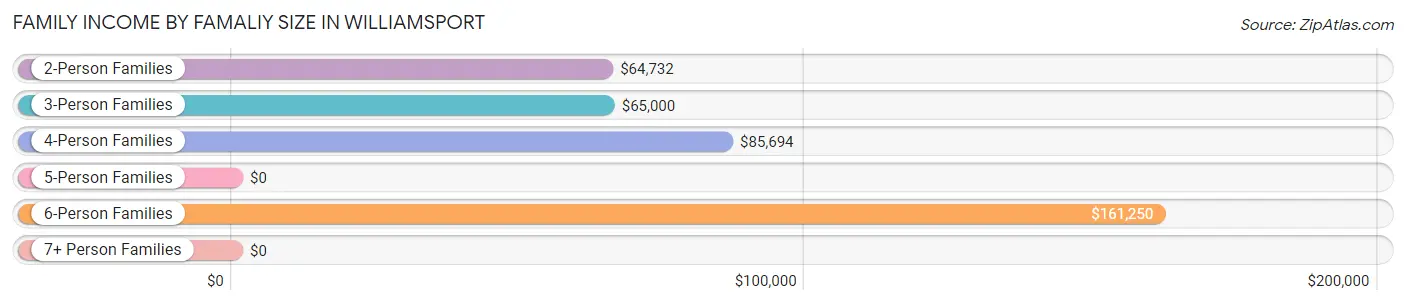
| Income Bracket | # Families | Median Income |
| 2-Person Families | 249 (51.0%) | $64,732 |
| 3-Person Families | 102 (20.9%) | $65,000 |
| 4-Person Families | 65 (13.3%) | $85,694 |
| 5-Person Families | 53 (10.9%) | $0 |
| 6-Person Families | 18 (3.7%) | $161,250 |
| 7+ Person Families | 1 (0.2%) | $0 |
| Total | 488 (100.0%) | $69,655 |
Family Income by Number of Earners in Williamsport
The median family income in Williamsport is $69,655, with families comprising 3+ earners (72) having the highest median family income of $168,750, while families with no earners (85) have the lowest median family income of $33,875, accounting for 14.7% and 17.4% of families, respectively.
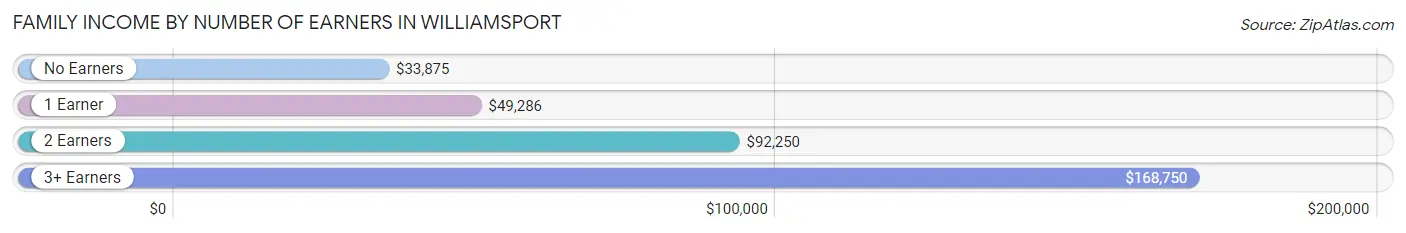
| Number of Earners | # Families | Median Income |
| No Earners | 85 (17.4%) | $33,875 |
| 1 Earner | 172 (35.2%) | $49,286 |
| 2 Earners | 159 (32.6%) | $92,250 |
| 3+ Earners | 72 (14.7%) | $168,750 |
| Total | 488 (100.0%) | $69,655 |
Household Income in Williamsport
Household Income Brackets in Williamsport
With 113 households falling in the category, the $100,000 to $149,999 income range is the most frequent in Williamsport, accounting for 16.5% of all households. In contrast, only 33 households (4.8%) fall into the less than $10,000 income bracket, making it the least populous group.
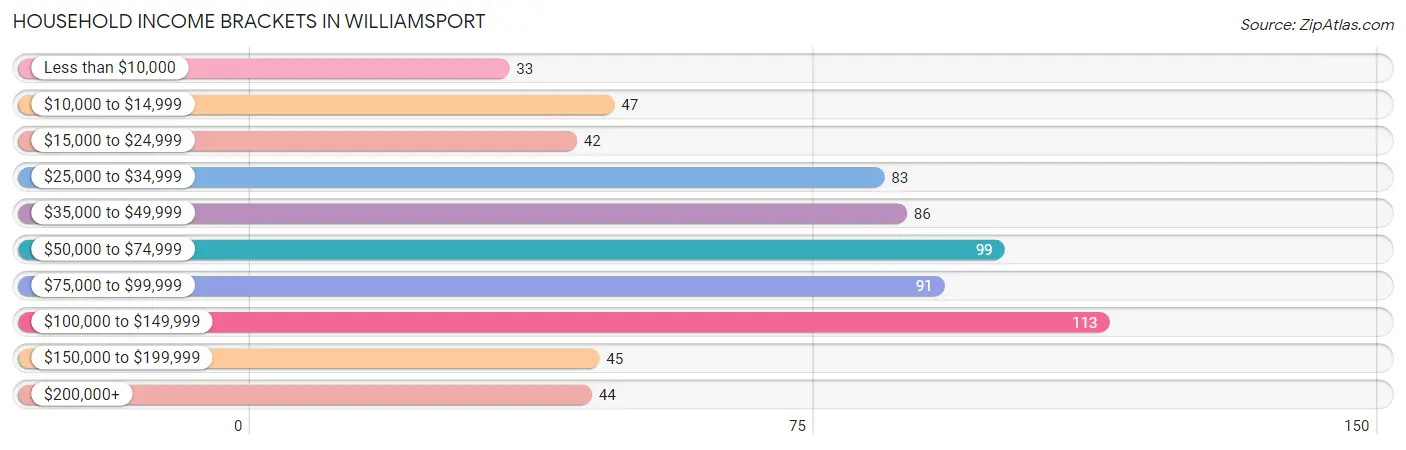
| Income Bracket | # Households | % Households |
| Less than $10,000 | 33 | 4.8% |
| $10,000 to $14,999 | 47 | 6.9% |
| $15,000 to $24,999 | 42 | 6.1% |
| $25,000 to $34,999 | 83 | 12.2% |
| $35,000 to $49,999 | 86 | 12.6% |
| $50,000 to $74,999 | 99 | 14.5% |
| $75,000 to $99,999 | 91 | 13.3% |
| $100,000 to $149,999 | 113 | 16.5% |
| $150,000 to $199,999 | 45 | 6.6% |
| $200,000+ | 44 | 6.4% |
Household Income by Householder Age in Williamsport
The median household income in Williamsport is $62,868, with the highest median household income of $100,882 found in the 15 to 24 years age bracket for the primary householder. A total of 30 households (4.4%) fall into this category. Meanwhile, the 65+ years age bracket for the primary householder has the lowest median household income of $38,854, with 195 households (28.5%) in this group.
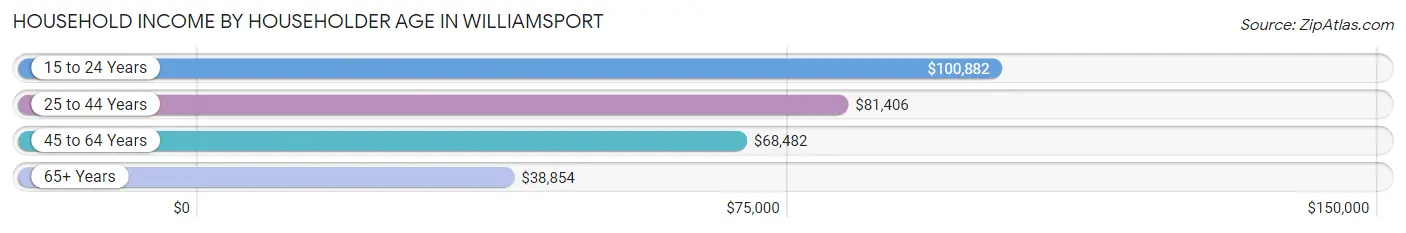
| Income Bracket | # Households | Median Income |
| 15 to 24 Years | 30 (4.4%) | $100,882 |
| 25 to 44 Years | 179 (26.2%) | $81,406 |
| 45 to 64 Years | 279 (40.8%) | $68,482 |
| 65+ Years | 195 (28.5%) | $38,854 |
| Total | 683 (100.0%) | $62,868 |
Poverty in Williamsport
Income Below Poverty by Sex and Age in Williamsport
With 9.3% poverty level for males and 15.3% for females among the residents of Williamsport, 15 year old males and 6 to 11 year old females are the most vulnerable to poverty, with 3 males (75.0%) and 22 females (36.1%) in their respective age groups living below the poverty level.
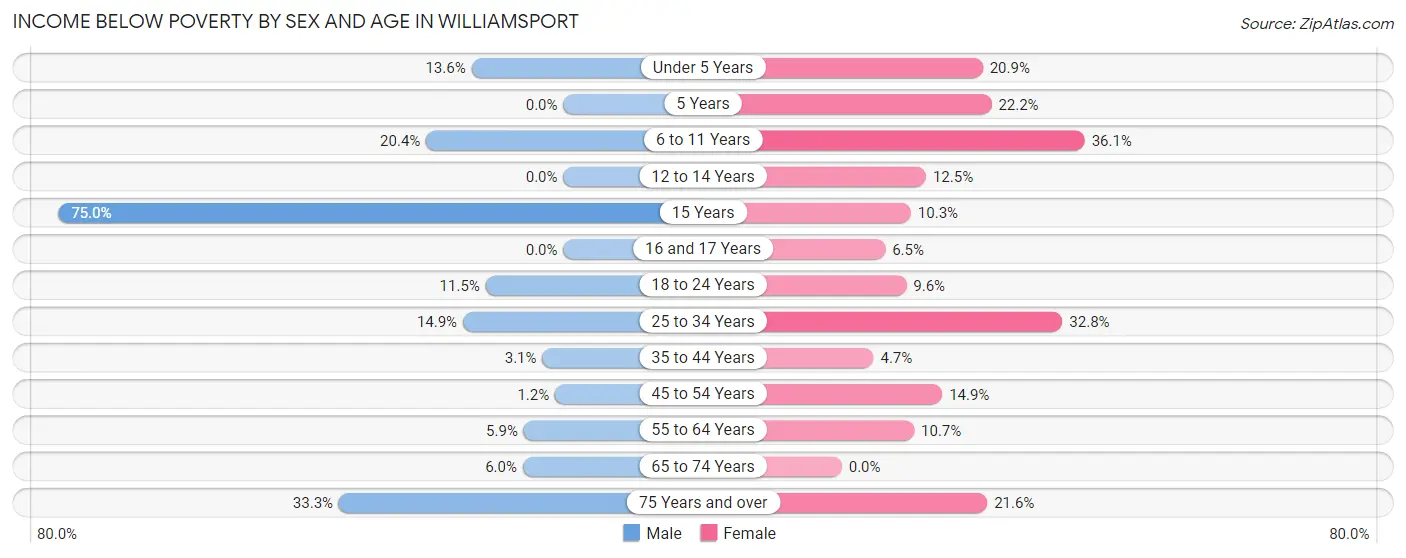
| Age Bracket | Male | Female |
| Under 5 Years | 3 (13.6%) | 9 (20.9%) |
| 5 Years | 0 (0.0%) | 2 (22.2%) |
| 6 to 11 Years | 11 (20.4%) | 22 (36.1%) |
| 12 to 14 Years | 0 (0.0%) | 4 (12.5%) |
| 15 Years | 3 (75.0%) | 4 (10.3%) |
| 16 and 17 Years | 0 (0.0%) | 2 (6.5%) |
| 18 to 24 Years | 9 (11.5%) | 7 (9.6%) |
| 25 to 34 Years | 17 (14.9%) | 38 (32.8%) |
| 35 to 44 Years | 3 (3.1%) | 4 (4.7%) |
| 45 to 54 Years | 2 (1.2%) | 17 (14.9%) |
| 55 to 64 Years | 5 (5.9%) | 13 (10.7%) |
| 65 to 74 Years | 5 (6.0%) | 0 (0.0%) |
| 75 Years and over | 18 (33.3%) | 19 (21.6%) |
| Total | 76 (9.3%) | 141 (15.3%) |
Income Above Poverty by Sex and Age in Williamsport
According to the poverty statistics in Williamsport, males aged 5 years and females aged 65 to 74 years are the age groups that are most secure financially, with 100.0% of males and 100.0% of females in these age groups living above the poverty line.
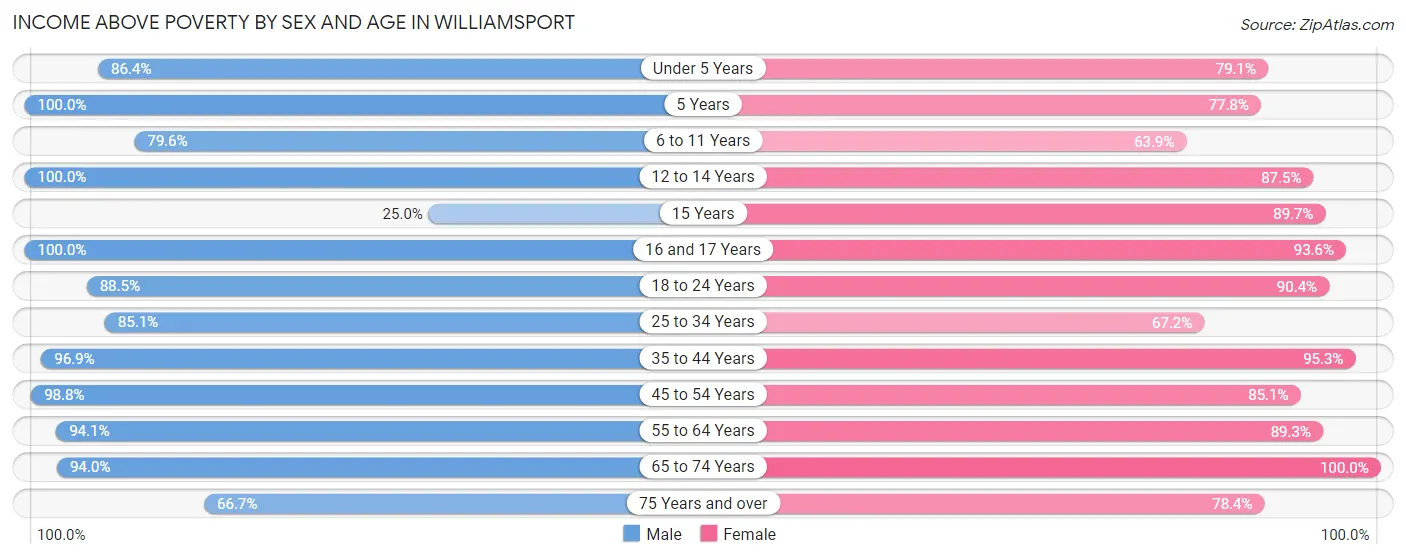
| Age Bracket | Male | Female |
| Under 5 Years | 19 (86.4%) | 34 (79.1%) |
| 5 Years | 5 (100.0%) | 7 (77.8%) |
| 6 to 11 Years | 43 (79.6%) | 39 (63.9%) |
| 12 to 14 Years | 35 (100.0%) | 28 (87.5%) |
| 15 Years | 1 (25.0%) | 35 (89.7%) |
| 16 and 17 Years | 26 (100.0%) | 29 (93.5%) |
| 18 to 24 Years | 69 (88.5%) | 66 (90.4%) |
| 25 to 34 Years | 97 (85.1%) | 78 (67.2%) |
| 35 to 44 Years | 93 (96.9%) | 81 (95.3%) |
| 45 to 54 Years | 160 (98.8%) | 97 (85.1%) |
| 55 to 64 Years | 80 (94.1%) | 108 (89.3%) |
| 65 to 74 Years | 78 (94.0%) | 107 (100.0%) |
| 75 Years and over | 36 (66.7%) | 69 (78.4%) |
| Total | 742 (90.7%) | 778 (84.7%) |
Income Below Poverty Among Married-Couple Families in Williamsport
The poverty statistics for married-couple families in Williamsport show that 7.2% or 25 of the total 346 families live below the poverty line. Families with no children have the highest poverty rate of 11.4%, comprising of 21 families. On the other hand, families with 5 or more children have the lowest poverty rate of 0.0%, which includes 0 families.
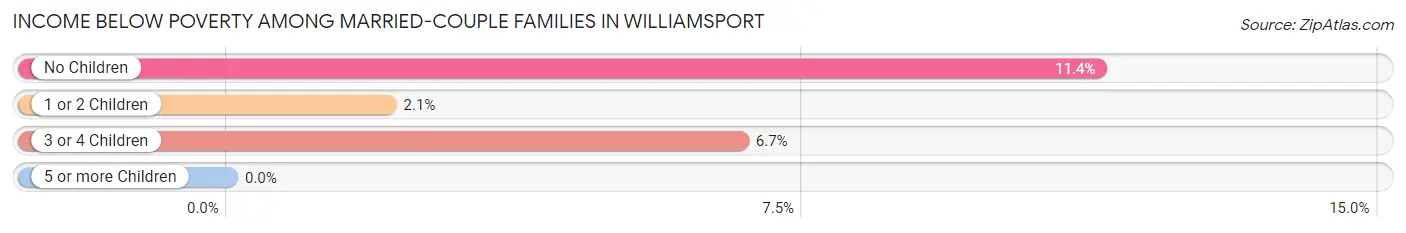
| Children | Above Poverty | Below Poverty |
| No Children | 164 (88.6%) | 21 (11.4%) |
| 1 or 2 Children | 142 (97.9%) | 3 (2.1%) |
| 3 or 4 Children | 14 (93.3%) | 1 (6.7%) |
| 5 or more Children | 1 (100.0%) | 0 (0.0%) |
| Total | 321 (92.8%) | 25 (7.2%) |
Income Below Poverty Among Single-Parent Households in Williamsport
According to the poverty data in Williamsport, 20.0% or 15 single-father households and 14.9% or 10 single-mother households are living below the poverty line. Among single-father households, those with 5 or more children have the highest poverty rate, with 2 households (100.0%) experiencing poverty. Likewise, among single-mother households, those with 3 or 4 children have the highest poverty rate, with 4 households (100.0%) falling below the poverty line.
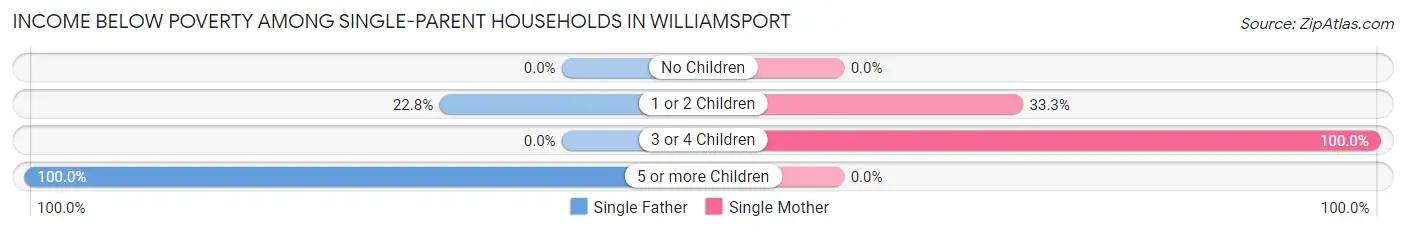
| Children | Single Father | Single Mother |
| No Children | 0 (0.0%) | 0 (0.0%) |
| 1 or 2 Children | 13 (22.8%) | 6 (33.3%) |
| 3 or 4 Children | 0 (0.0%) | 4 (100.0%) |
| 5 or more Children | 2 (100.0%) | 0 (0.0%) |
| Total | 15 (20.0%) | 10 (14.9%) |
Income Below Poverty Among Married-Couple vs Single-Parent Households in Williamsport
The poverty data for Williamsport shows that 25 of the married-couple family households (7.2%) and 25 of the single-parent households (17.6%) are living below the poverty level. Within the married-couple family households, those with no children have the highest poverty rate, with 21 households (11.4%) falling below the poverty line. Among the single-parent households, those with 5 or more children have the highest poverty rate, with 2 household (100.0%) living below poverty.
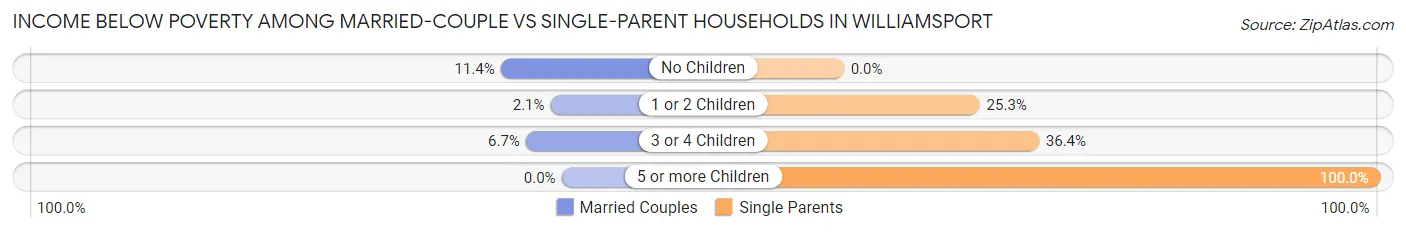
| Children | Married-Couple Families | Single-Parent Households |
| No Children | 21 (11.4%) | 0 (0.0%) |
| 1 or 2 Children | 3 (2.1%) | 19 (25.3%) |
| 3 or 4 Children | 1 (6.7%) | 4 (36.4%) |
| 5 or more Children | 0 (0.0%) | 2 (100.0%) |
| Total | 25 (7.2%) | 25 (17.6%) |
Race in Williamsport
The most populous races in Williamsport are White / Caucasian (1,788 | 96.8%), Two or more Races (37 | 2.0%), and Asian (20 | 1.1%).
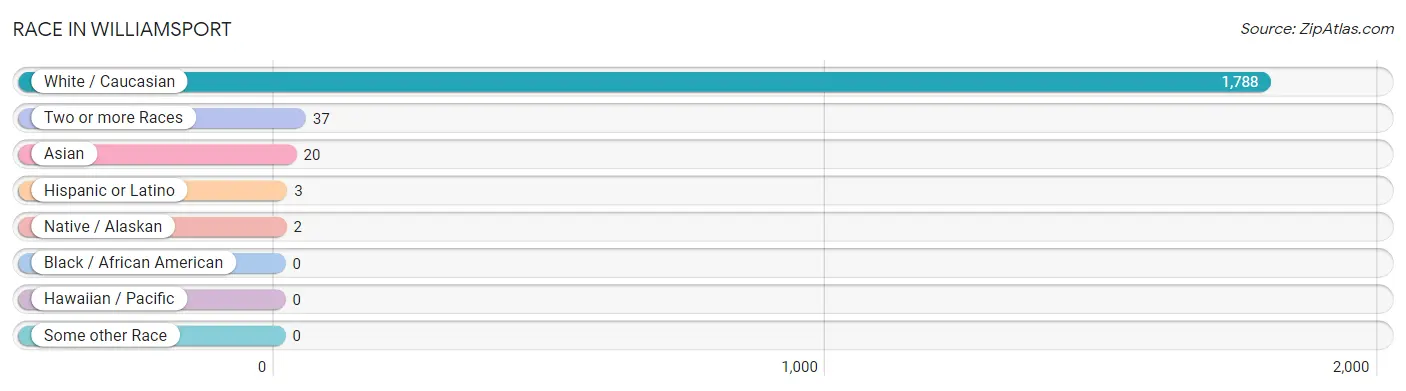
| Race | # Population | % Population |
| Asian | 20 | 1.1% |
| Black / African American | 0 | 0.0% |
| Hawaiian / Pacific | 0 | 0.0% |
| Hispanic or Latino | 3 | 0.2% |
| Native / Alaskan | 2 | 0.1% |
| White / Caucasian | 1,788 | 96.8% |
| Two or more Races | 37 | 2.0% |
| Some other Race | 0 | 0.0% |
| Total | 1,847 | 100.0% |
Ancestry in Williamsport
The most populous ancestries reported in Williamsport are German (318 | 17.2%), Irish (188 | 10.2%), American (134 | 7.3%), English (119 | 6.4%), and French (42 | 2.3%), together accounting for 43.4% of all Williamsport residents.
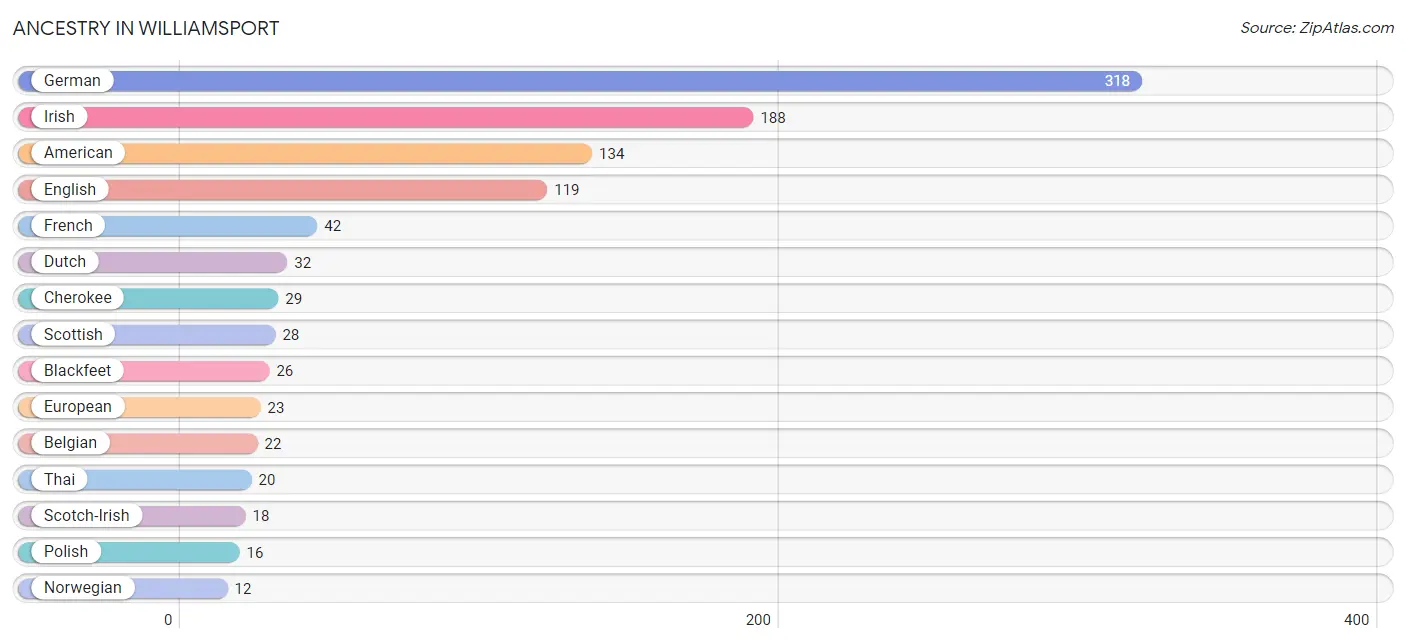
| Ancestry | # Population | % Population |
| American | 134 | 7.3% |
| Australian | 3 | 0.2% |
| Belgian | 22 | 1.2% |
| Blackfeet | 26 | 1.4% |
| British | 6 | 0.3% |
| Cherokee | 29 | 1.6% |
| Chippewa | 2 | 0.1% |
| Dutch | 32 | 1.7% |
| English | 119 | 6.4% |
| European | 23 | 1.3% |
| French | 42 | 2.3% |
| French Canadian | 3 | 0.2% |
| German | 318 | 17.2% |
| Irish | 188 | 10.2% |
| Italian | 9 | 0.5% |
| Mexican | 3 | 0.2% |
| Northern European | 5 | 0.3% |
| Norwegian | 12 | 0.6% |
| Polish | 16 | 0.9% |
| Scotch-Irish | 18 | 1.0% |
| Scottish | 28 | 1.5% |
| Swedish | 10 | 0.5% |
| Swiss | 4 | 0.2% |
| Thai | 20 | 1.1% |
| Welsh | 10 | 0.5% | View All 25 Rows |
Immigrants in Williamsport
The most numerous immigrant groups reported in Williamsport came from Asia (20 | 1.1%), India (20 | 1.1%), South Central Asia (20 | 1.1%), Europe (6 | 0.3%), and Germany (6 | 0.3%), together accounting for 3.9% of all Williamsport residents.
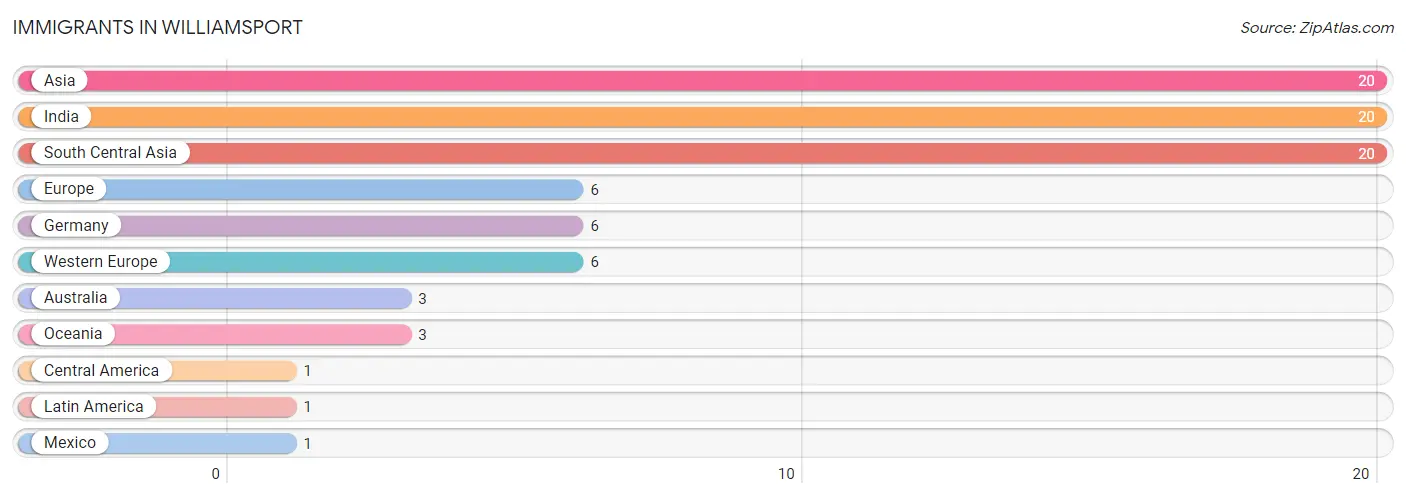
| Immigration Origin | # Population | % Population |
| Asia | 20 | 1.1% |
| Australia | 3 | 0.2% |
| Central America | 1 | 0.1% |
| Europe | 6 | 0.3% |
| Germany | 6 | 0.3% |
| India | 20 | 1.1% |
| Latin America | 1 | 0.1% |
| Mexico | 1 | 0.1% |
| Oceania | 3 | 0.2% |
| South Central Asia | 20 | 1.1% |
| Western Europe | 6 | 0.3% | View All 11 Rows |
Sex and Age in Williamsport
Sex and Age in Williamsport
The most populous age groups in Williamsport are 45 to 49 Years (106 | 12.2%) for men and 15 to 19 Years (105 | 10.7%) for women.
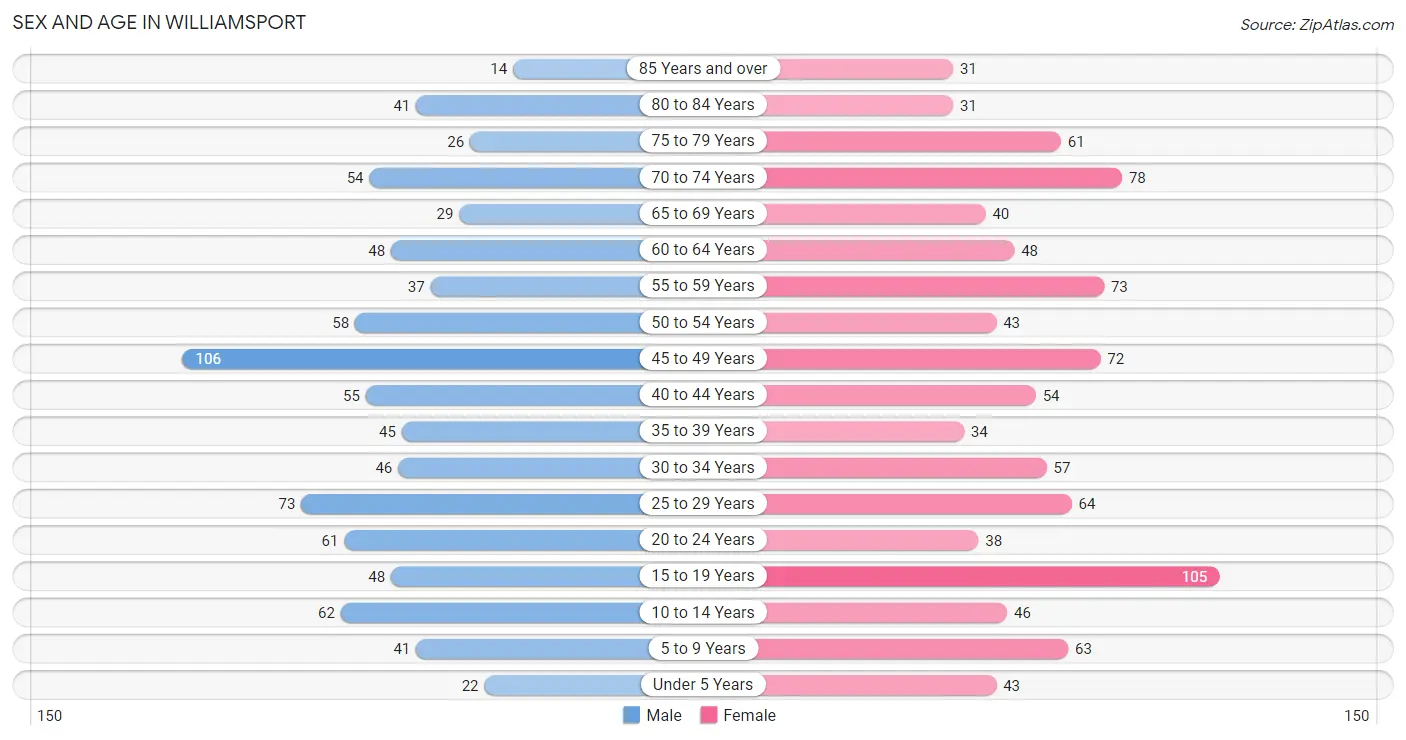
| Age Bracket | Male | Female |
| Under 5 Years | 22 (2.5%) | 43 (4.4%) |
| 5 to 9 Years | 41 (4.7%) | 63 (6.4%) |
| 10 to 14 Years | 62 (7.2%) | 46 (4.7%) |
| 15 to 19 Years | 48 (5.5%) | 105 (10.7%) |
| 20 to 24 Years | 61 (7.0%) | 38 (3.9%) |
| 25 to 29 Years | 73 (8.4%) | 64 (6.5%) |
| 30 to 34 Years | 46 (5.3%) | 57 (5.8%) |
| 35 to 39 Years | 45 (5.2%) | 34 (3.5%) |
| 40 to 44 Years | 55 (6.4%) | 54 (5.5%) |
| 45 to 49 Years | 106 (12.2%) | 72 (7.3%) |
| 50 to 54 Years | 58 (6.7%) | 43 (4.4%) |
| 55 to 59 Years | 37 (4.3%) | 73 (7.4%) |
| 60 to 64 Years | 48 (5.5%) | 48 (4.9%) |
| 65 to 69 Years | 29 (3.4%) | 40 (4.1%) |
| 70 to 74 Years | 54 (6.2%) | 78 (8.0%) |
| 75 to 79 Years | 26 (3.0%) | 61 (6.2%) |
| 80 to 84 Years | 41 (4.7%) | 31 (3.2%) |
| 85 Years and over | 14 (1.6%) | 31 (3.2%) |
| Total | 866 (100.0%) | 981 (100.0%) |
Families and Households in Williamsport
Median Family Size in Williamsport
The median family size in Williamsport is 2.94 persons per family, with married-couple families (346 | 70.9%) accounting for the largest median family size of 3.07 persons per family. On the other hand, single male/father families (75 | 15.4%) represent the smallest median family size with 2.44 persons per family.
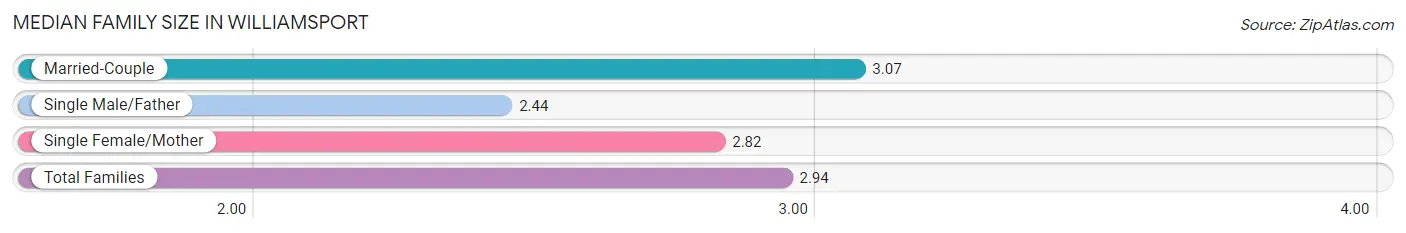
| Family Type | # Families | Family Size |
| Married-Couple | 346 (70.9%) | 3.07 |
| Single Male/Father | 75 (15.4%) | 2.44 |
| Single Female/Mother | 67 (13.7%) | 2.82 |
| Total Families | 488 (100.0%) | 2.94 |
Median Household Size in Williamsport
The median household size in Williamsport is 2.57 persons per household, with single male/father households (75 | 11.0%) accounting for the largest median household size of 3.4 persons per household. non-family households (195 | 28.5%) represent the smallest median household size with 1.16 persons per household.
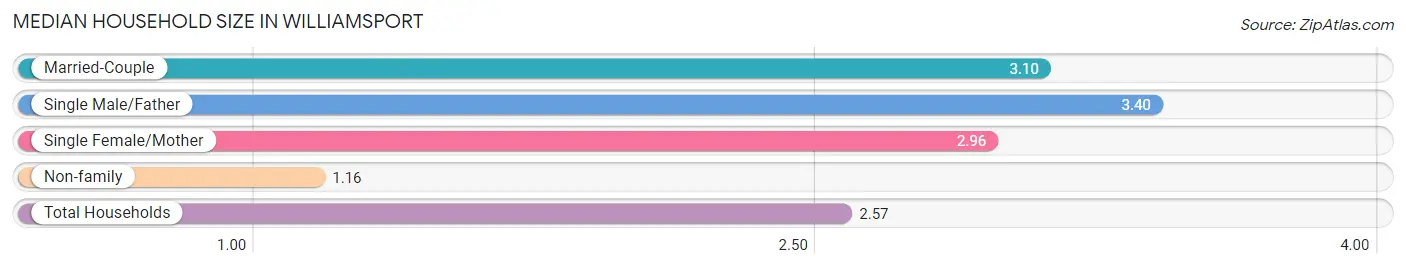
| Household Type | # Households | Household Size |
| Married-Couple | 346 (50.7%) | 3.10 |
| Single Male/Father | 75 (11.0%) | 3.40 |
| Single Female/Mother | 67 (9.8%) | 2.96 |
| Non-family | 195 (28.5%) | 1.16 |
| Total Households | 683 (100.0%) | 2.57 |
Household Size by Marriage Status in Williamsport
Out of a total of 683 households in Williamsport, 488 (71.5%) are family households, while 195 (28.5%) are nonfamily households. The most numerous type of family households are 2-person households, comprising 210, and the most common type of nonfamily households are 1-person households, comprising 173.
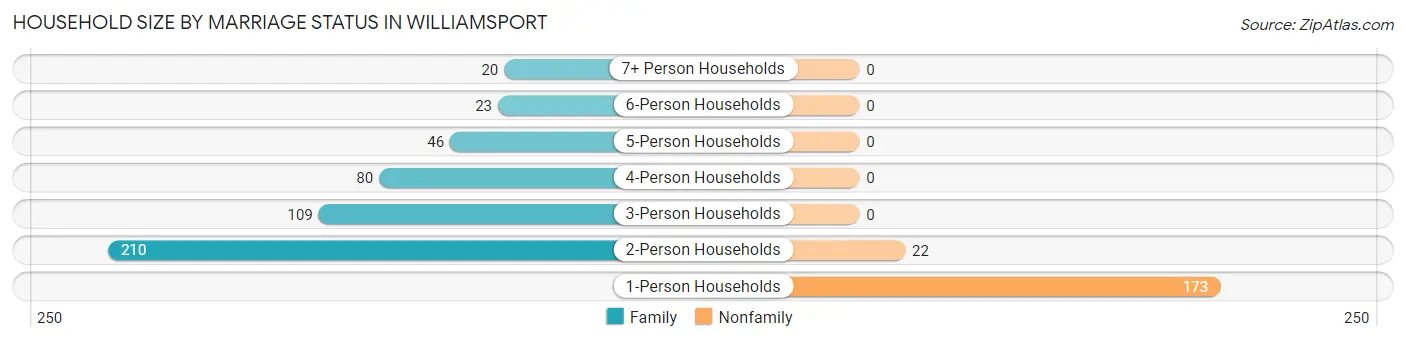
| Household Size | Family Households | Nonfamily Households |
| 1-Person Households | - | 173 (25.3%) |
| 2-Person Households | 210 (30.7%) | 22 (3.2%) |
| 3-Person Households | 109 (16.0%) | 0 (0.0%) |
| 4-Person Households | 80 (11.7%) | 0 (0.0%) |
| 5-Person Households | 46 (6.7%) | 0 (0.0%) |
| 6-Person Households | 23 (3.4%) | 0 (0.0%) |
| 7+ Person Households | 20 (2.9%) | 0 (0.0%) |
| Total | 488 (71.5%) | 195 (28.5%) |
Female Fertility in Williamsport
Fertility by Age in Williamsport
Average fertility rate in Williamsport is 28.0 births per 1,000 women. Women in the age bracket of 35 to 50 years have the highest fertility rate with 47.0 births per 1,000 women. Women in the age bracket of 35 to 50 years acount for 66.7% of all women with births.
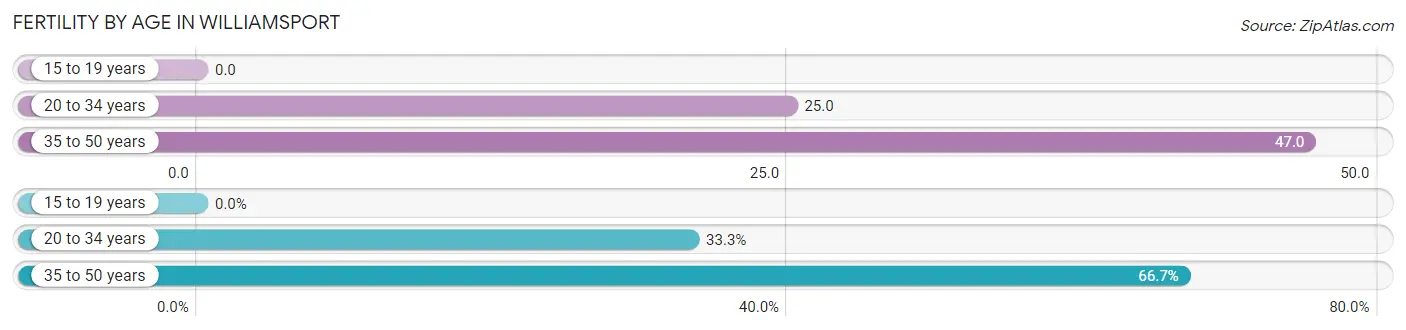
| Age Bracket | Women with Births | Births / 1,000 Women |
| 15 to 19 years | 0 (0.0%) | 0.0 |
| 20 to 34 years | 4 (33.3%) | 25.0 |
| 35 to 50 years | 8 (66.7%) | 47.0 |
| Total | 12 (100.0%) | 28.0 |
Fertility by Age by Marriage Status in Williamsport
16.7% of women with births (12) in Williamsport are married. The highest percentage of unmarried women with births falls into 20 to 34 years age bracket with 100.0% of them unmarried at the time of birth, while the lowest percentage of unmarried women with births belong to 35 to 50 years age bracket with 75.0% of them unmarried.
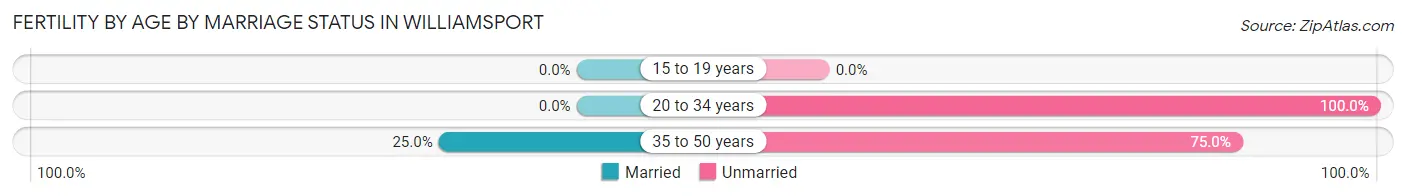
| Age Bracket | Married | Unmarried |
| 15 to 19 years | 0 (0.0%) | 0 (0.0%) |
| 20 to 34 years | 0 (0.0%) | 4 (100.0%) |
| 35 to 50 years | 2 (25.0%) | 6 (75.0%) |
| Total | 2 (16.7%) | 10 (83.3%) |
Fertility by Education in Williamsport
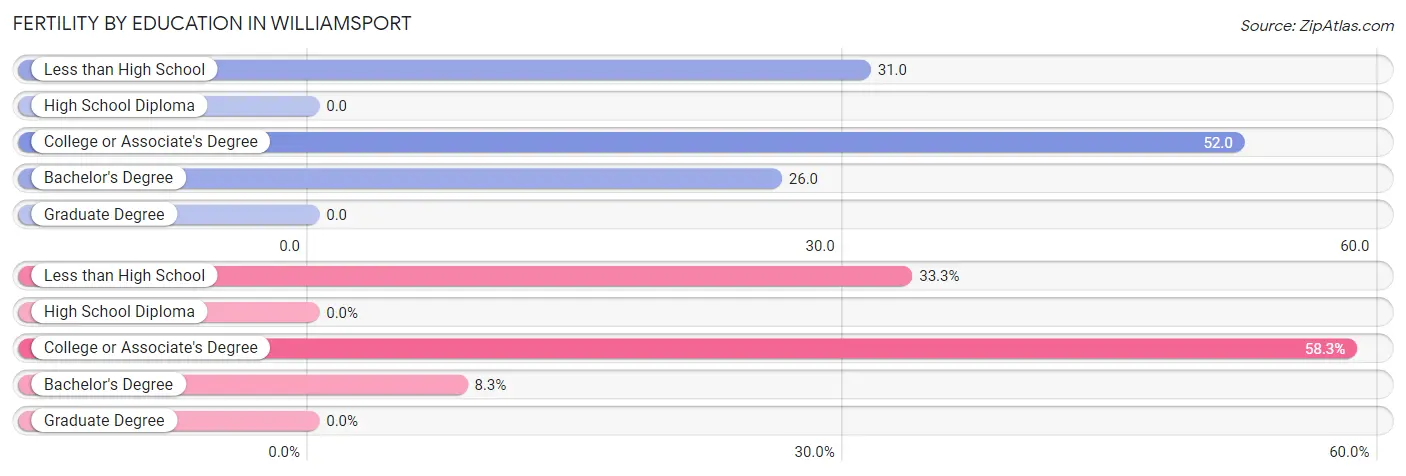
| Educational Attainment | Women with Births | Births / 1,000 Women |
| Less than High School | 4 (33.3%) | 31.0 |
| High School Diploma | 0 (0.0%) | 0.0 |
| College or Associate's Degree | 7 (58.3%) | 52.0 |
| Bachelor's Degree | 1 (8.3%) | 26.0 |
| Graduate Degree | 0 (0.0%) | 0.0 |
| Total | 12 (100.0%) | 28.0 |
Fertility by Education by Marriage Status in Williamsport
83.3% of women with births in Williamsport are unmarried. Women with the educational attainment of bachelor's degree are most likely to be married with 100.0% of them married at childbirth, while women with the educational attainment of less than high school are least likely to be married with 100.0% of them unmarried at childbirth.
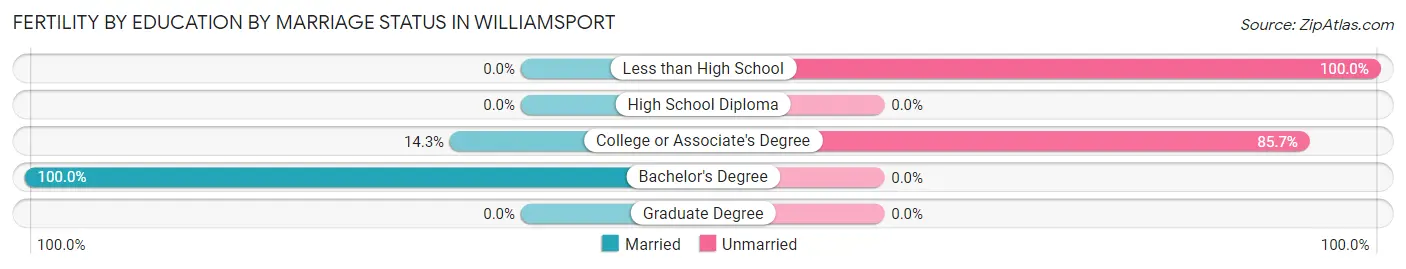
| Educational Attainment | Married | Unmarried |
| Less than High School | 0 (0.0%) | 4 (100.0%) |
| High School Diploma | 0 (0.0%) | 0 (0.0%) |
| College or Associate's Degree | 1 (14.3%) | 6 (85.7%) |
| Bachelor's Degree | 1 (100.0%) | 0 (0.0%) |
| Graduate Degree | 0 (0.0%) | 0 (0.0%) |
| Total | 2 (16.7%) | 10 (83.3%) |
Employment Characteristics in Williamsport
Employment by Class of Employer in Williamsport
Among the 900 employed individuals in Williamsport, private company employees (666 | 74.0%), state government employees (73 | 8.1%), and self-employed (not incorporated) (55 | 6.1%) make up the most common classes of employment.
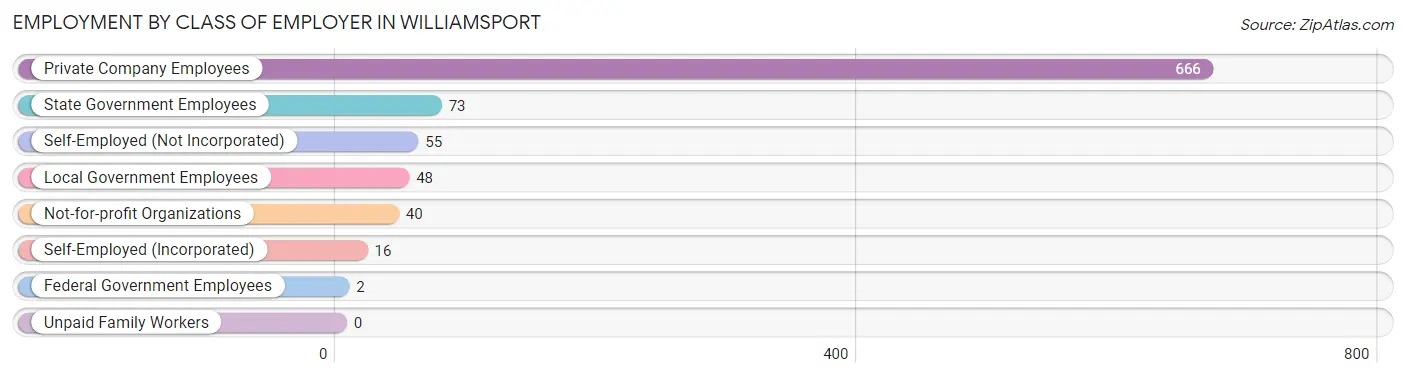
| Employer Class | # Employees | % Employees |
| Private Company Employees | 666 | 74.0% |
| Self-Employed (Incorporated) | 16 | 1.8% |
| Self-Employed (Not Incorporated) | 55 | 6.1% |
| Not-for-profit Organizations | 40 | 4.4% |
| Local Government Employees | 48 | 5.3% |
| State Government Employees | 73 | 8.1% |
| Federal Government Employees | 2 | 0.2% |
| Unpaid Family Workers | 0 | 0.0% |
| Total | 900 | 100.0% |
Employment Status by Age in Williamsport
According to the labor force statistics for Williamsport, out of the total population over 16 years of age (1,527), 60.3% or 921 individuals are in the labor force, with 1.2% or 11 of them unemployed. The age group with the highest labor force participation rate is 35 to 44 years, with 87.2% or 164 individuals in the labor force. Within the labor force, the 25 to 29 years age range has the highest percentage of unemployed individuals, with 5.5% or 6 of them being unemployed.
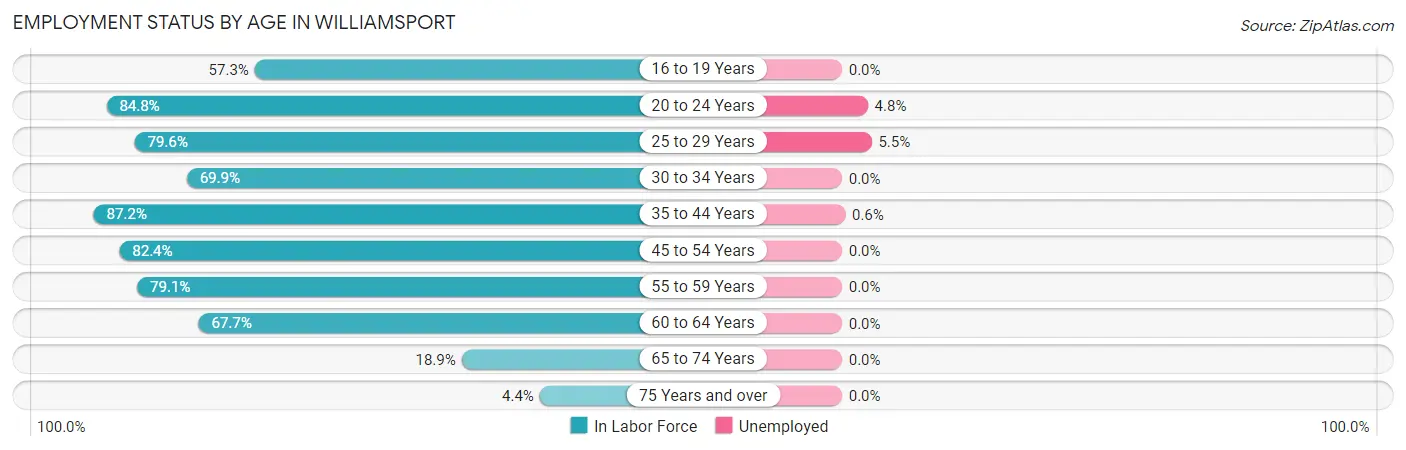
| Age Bracket | In Labor Force | Unemployed |
| 16 to 19 Years | 63 (57.3%) | 0 (0.0%) |
| 20 to 24 Years | 84 (84.8%) | 4 (4.8%) |
| 25 to 29 Years | 109 (79.6%) | 6 (5.5%) |
| 30 to 34 Years | 72 (69.9%) | 0 (0.0%) |
| 35 to 44 Years | 164 (87.2%) | 1 (0.6%) |
| 45 to 54 Years | 230 (82.4%) | 0 (0.0%) |
| 55 to 59 Years | 87 (79.1%) | 0 (0.0%) |
| 60 to 64 Years | 65 (67.7%) | 0 (0.0%) |
| 65 to 74 Years | 38 (18.9%) | 0 (0.0%) |
| 75 Years and over | 9 (4.4%) | 0 (0.0%) |
| Total | 921 (60.3%) | 11 (1.2%) |
Employment Status by Educational Attainment in Williamsport
According to labor force statistics for Williamsport, 79.6% of individuals (727) out of the total population between 25 and 64 years of age (913) are in the labor force, with 1.0% or 7 of them being unemployed. The group with the highest labor force participation rate are those with the educational attainment of bachelor's degree or higher, with 88.2% or 165 individuals in the labor force. Within the labor force, individuals with bachelor's degree or higher education have the highest percentage of unemployment, with 2.4% or 4 of them being unemployed.
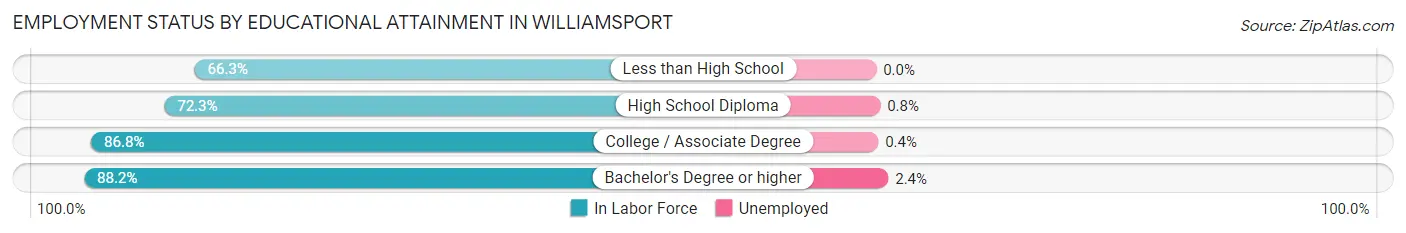
| Educational Attainment | In Labor Force | Unemployed |
| Less than High School | 53 (66.3%) | 0 (0.0%) |
| High School Diploma | 259 (72.3%) | 3 (0.8%) |
| College / Associate Degree | 250 (86.8%) | 1 (0.4%) |
| Bachelor's Degree or higher | 165 (88.2%) | 4 (2.4%) |
| Total | 727 (79.6%) | 9 (1.0%) |
Employment Occupations by Sex in Williamsport
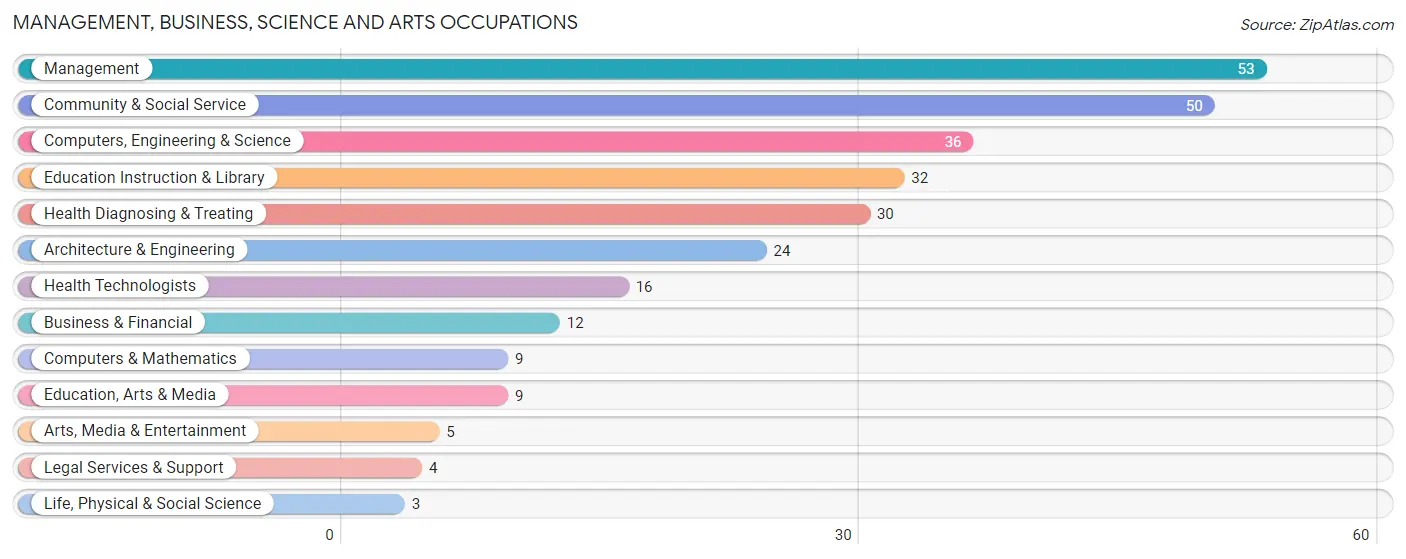
Management, Business, Science and Arts Occupations
The most common Management, Business, Science and Arts occupations in Williamsport are Management (53 | 5.8%), Community & Social Service (50 | 5.5%), Computers, Engineering & Science (36 | 4.0%), Education Instruction & Library (32 | 3.5%), and Health Diagnosing & Treating (30 | 3.3%).
Management, Business, Science and Arts Occupations by Sex
Within the Management, Business, Science and Arts occupations in Williamsport, the most male-oriented occupations are Arts, Media & Entertainment (100.0%), Management (90.6%), and Architecture & Engineering (58.3%), while the most female-oriented occupations are Computers & Mathematics (100.0%), Life, Physical & Social Science (100.0%), and Legal Services & Support (100.0%).
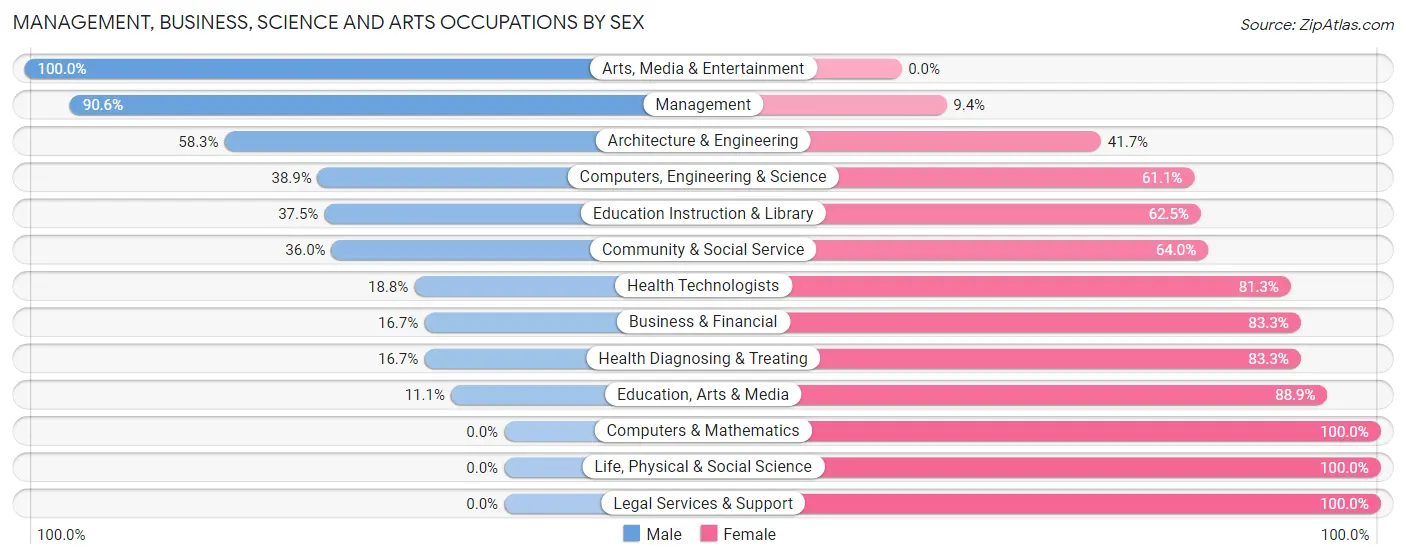
| Occupation | Male | Female |
| Management | 48 (90.6%) | 5 (9.4%) |
| Business & Financial | 2 (16.7%) | 10 (83.3%) |
| Computers, Engineering & Science | 14 (38.9%) | 22 (61.1%) |
| Computers & Mathematics | 0 (0.0%) | 9 (100.0%) |
| Architecture & Engineering | 14 (58.3%) | 10 (41.7%) |
| Life, Physical & Social Science | 0 (0.0%) | 3 (100.0%) |
| Community & Social Service | 18 (36.0%) | 32 (64.0%) |
| Education, Arts & Media | 1 (11.1%) | 8 (88.9%) |
| Legal Services & Support | 0 (0.0%) | 4 (100.0%) |
| Education Instruction & Library | 12 (37.5%) | 20 (62.5%) |
| Arts, Media & Entertainment | 5 (100.0%) | 0 (0.0%) |
| Health Diagnosing & Treating | 5 (16.7%) | 25 (83.3%) |
| Health Technologists | 3 (18.8%) | 13 (81.2%) |
| Total (Category) | 87 (48.1%) | 94 (51.9%) |
| Total (Overall) | 524 (57.6%) | 386 (42.4%) |
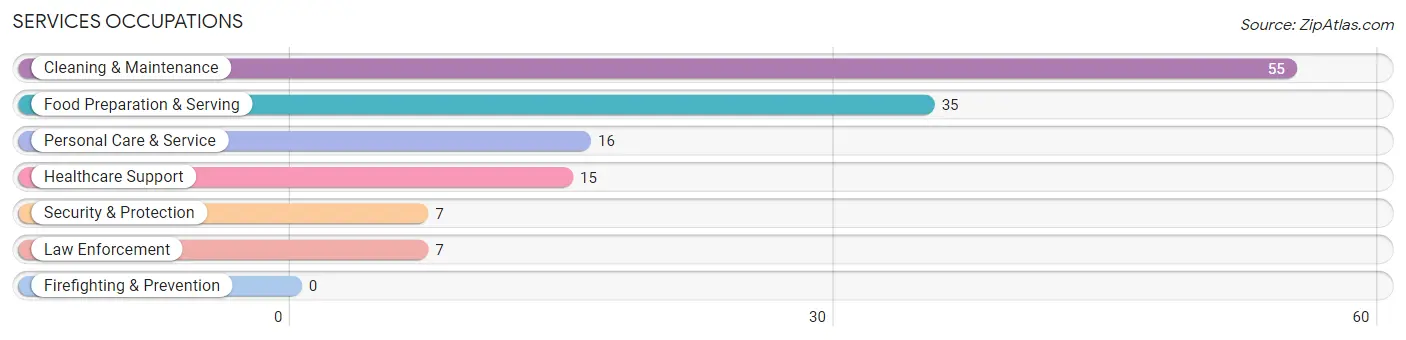
Services Occupations
The most common Services occupations in Williamsport are Cleaning & Maintenance (55 | 6.0%), Food Preparation & Serving (35 | 3.8%), Personal Care & Service (16 | 1.8%), Healthcare Support (15 | 1.7%), and Security & Protection (7 | 0.8%).
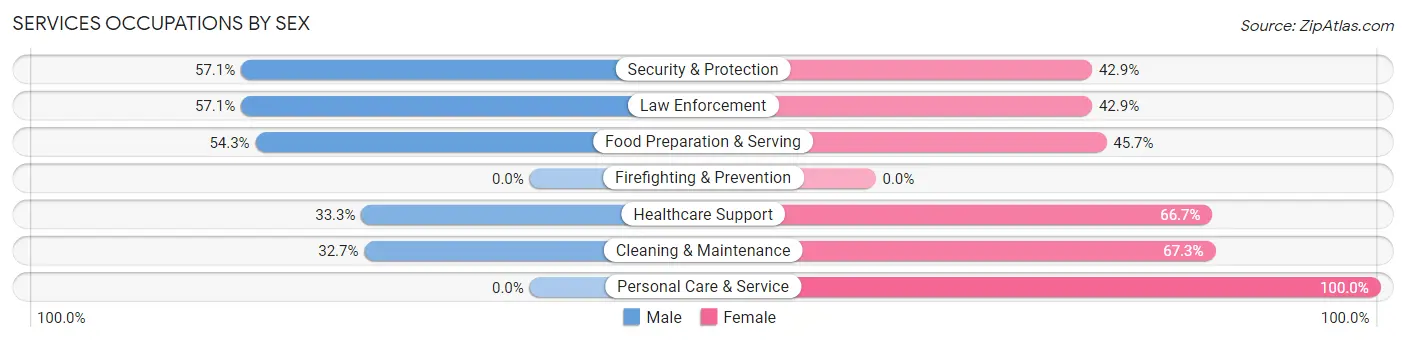
Services Occupations by Sex
Within the Services occupations in Williamsport, the most male-oriented occupations are Security & Protection (57.1%), Law Enforcement (57.1%), and Food Preparation & Serving (54.3%), while the most female-oriented occupations are Personal Care & Service (100.0%), Cleaning & Maintenance (67.3%), and Healthcare Support (66.7%).
| Occupation | Male | Female |
| Healthcare Support | 5 (33.3%) | 10 (66.7%) |
| Security & Protection | 4 (57.1%) | 3 (42.9%) |
| Firefighting & Prevention | 0 (0.0%) | 0 (0.0%) |
| Law Enforcement | 4 (57.1%) | 3 (42.9%) |
| Food Preparation & Serving | 19 (54.3%) | 16 (45.7%) |
| Cleaning & Maintenance | 18 (32.7%) | 37 (67.3%) |
| Personal Care & Service | 0 (0.0%) | 16 (100.0%) |
| Total (Category) | 46 (35.9%) | 82 (64.1%) |
| Total (Overall) | 524 (57.6%) | 386 (42.4%) |
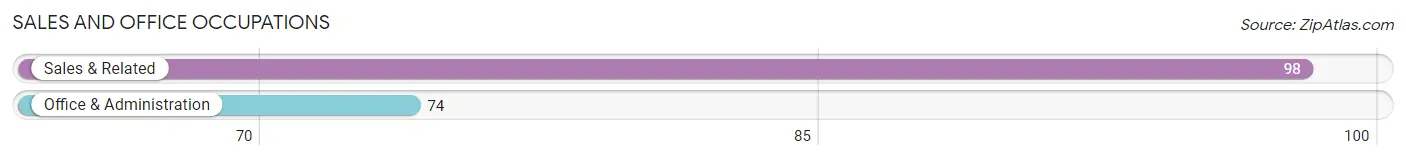
Sales and Office Occupations
The most common Sales and Office occupations in Williamsport are Sales & Related (98 | 10.8%), and Office & Administration (74 | 8.1%).
Sales and Office Occupations by Sex
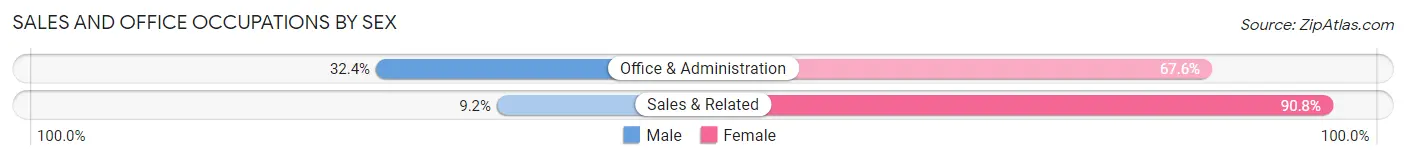
| Occupation | Male | Female |
| Sales & Related | 9 (9.2%) | 89 (90.8%) |
| Office & Administration | 24 (32.4%) | 50 (67.6%) |
| Total (Category) | 33 (19.2%) | 139 (80.8%) |
| Total (Overall) | 524 (57.6%) | 386 (42.4%) |
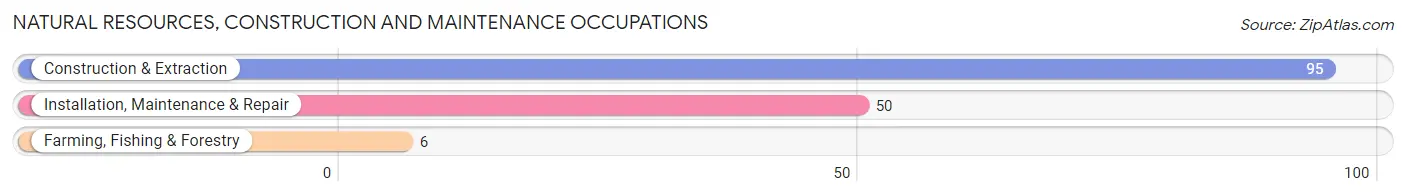
Natural Resources, Construction and Maintenance Occupations
The most common Natural Resources, Construction and Maintenance occupations in Williamsport are Construction & Extraction (95 | 10.4%), Installation, Maintenance & Repair (50 | 5.5%), and Farming, Fishing & Forestry (6 | 0.7%).
Natural Resources, Construction and Maintenance Occupations by Sex
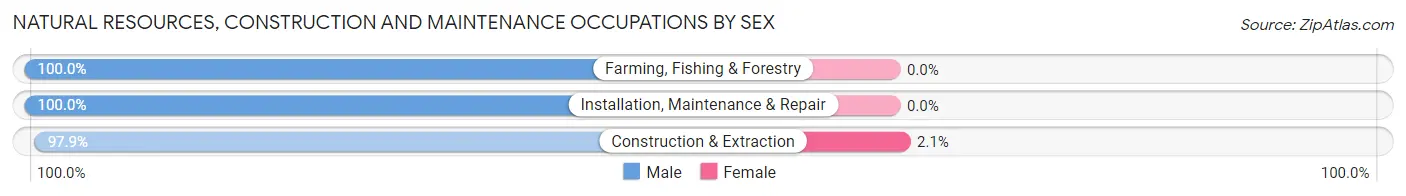
| Occupation | Male | Female |
| Farming, Fishing & Forestry | 6 (100.0%) | 0 (0.0%) |
| Construction & Extraction | 93 (97.9%) | 2 (2.1%) |
| Installation, Maintenance & Repair | 50 (100.0%) | 0 (0.0%) |
| Total (Category) | 149 (98.7%) | 2 (1.3%) |
| Total (Overall) | 524 (57.6%) | 386 (42.4%) |
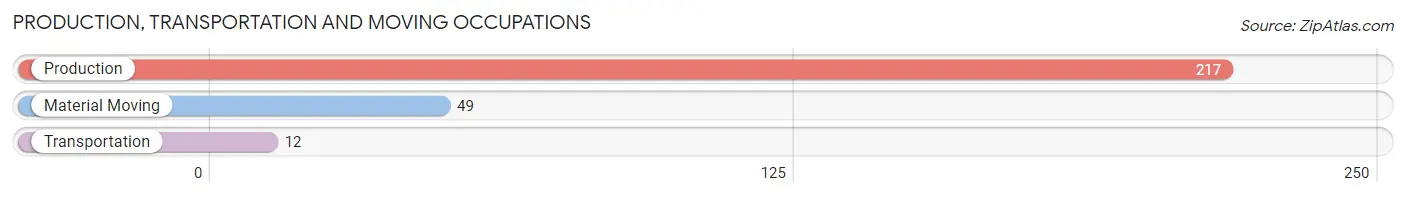
Production, Transportation and Moving Occupations
The most common Production, Transportation and Moving occupations in Williamsport are Production (217 | 23.8%), Material Moving (49 | 5.4%), and Transportation (12 | 1.3%).
Production, Transportation and Moving Occupations by Sex
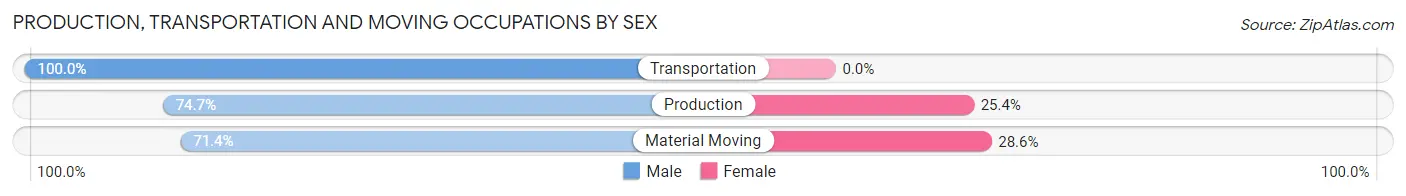
| Occupation | Male | Female |
| Production | 162 (74.7%) | 55 (25.4%) |
| Transportation | 12 (100.0%) | 0 (0.0%) |
| Material Moving | 35 (71.4%) | 14 (28.6%) |
| Total (Category) | 209 (75.2%) | 69 (24.8%) |
| Total (Overall) | 524 (57.6%) | 386 (42.4%) |
Employment Industries by Sex in Williamsport
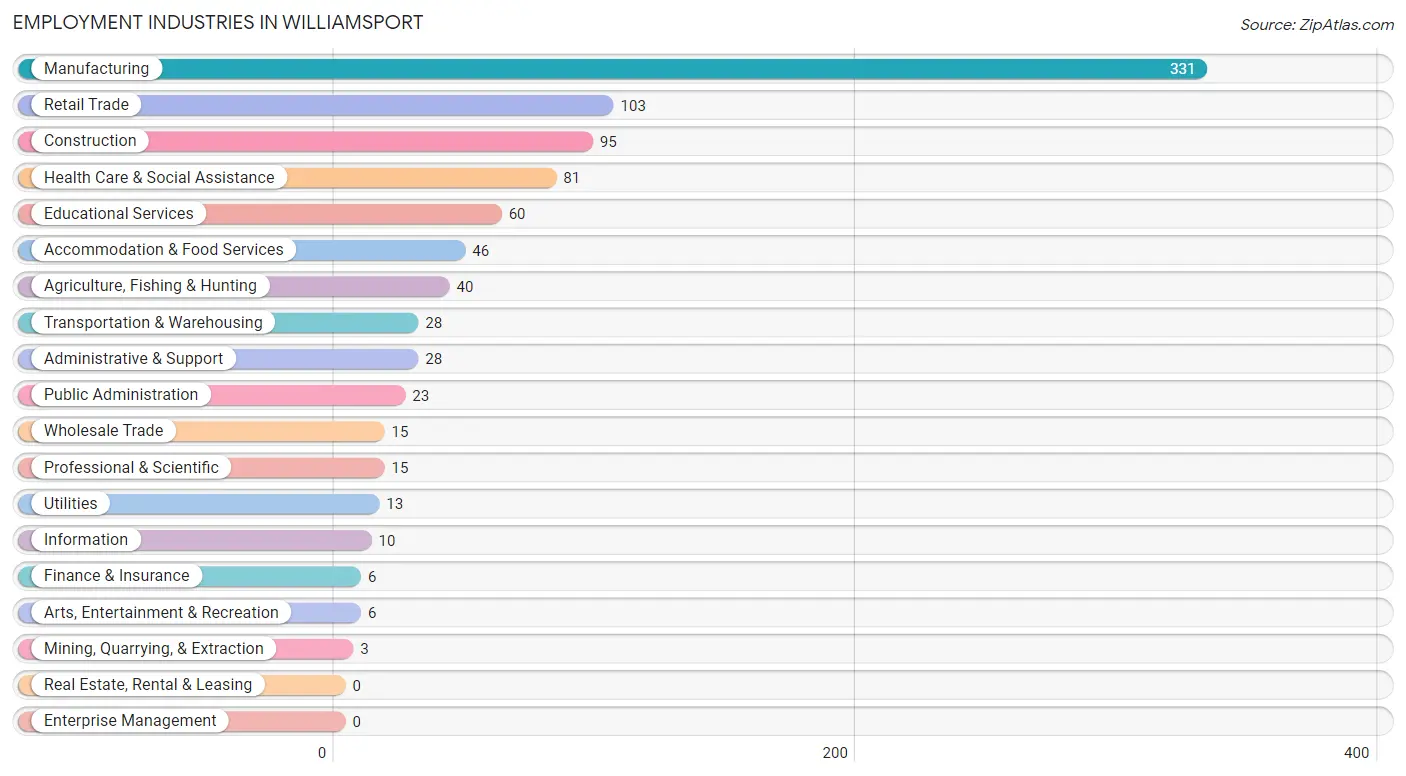
Employment Industries in Williamsport
The major employment industries in Williamsport include Manufacturing (331 | 36.4%), Retail Trade (103 | 11.3%), Construction (95 | 10.4%), Health Care & Social Assistance (81 | 8.9%), and Educational Services (60 | 6.6%).
Employment Industries by Sex in Williamsport
The Williamsport industries that see more men than women are Mining, Quarrying, & Extraction (100.0%), Utilities (100.0%), and Information (100.0%), whereas the industries that tend to have a higher number of women are Finance & Insurance (100.0%), Arts, Entertainment & Recreation (100.0%), and Health Care & Social Assistance (87.6%).
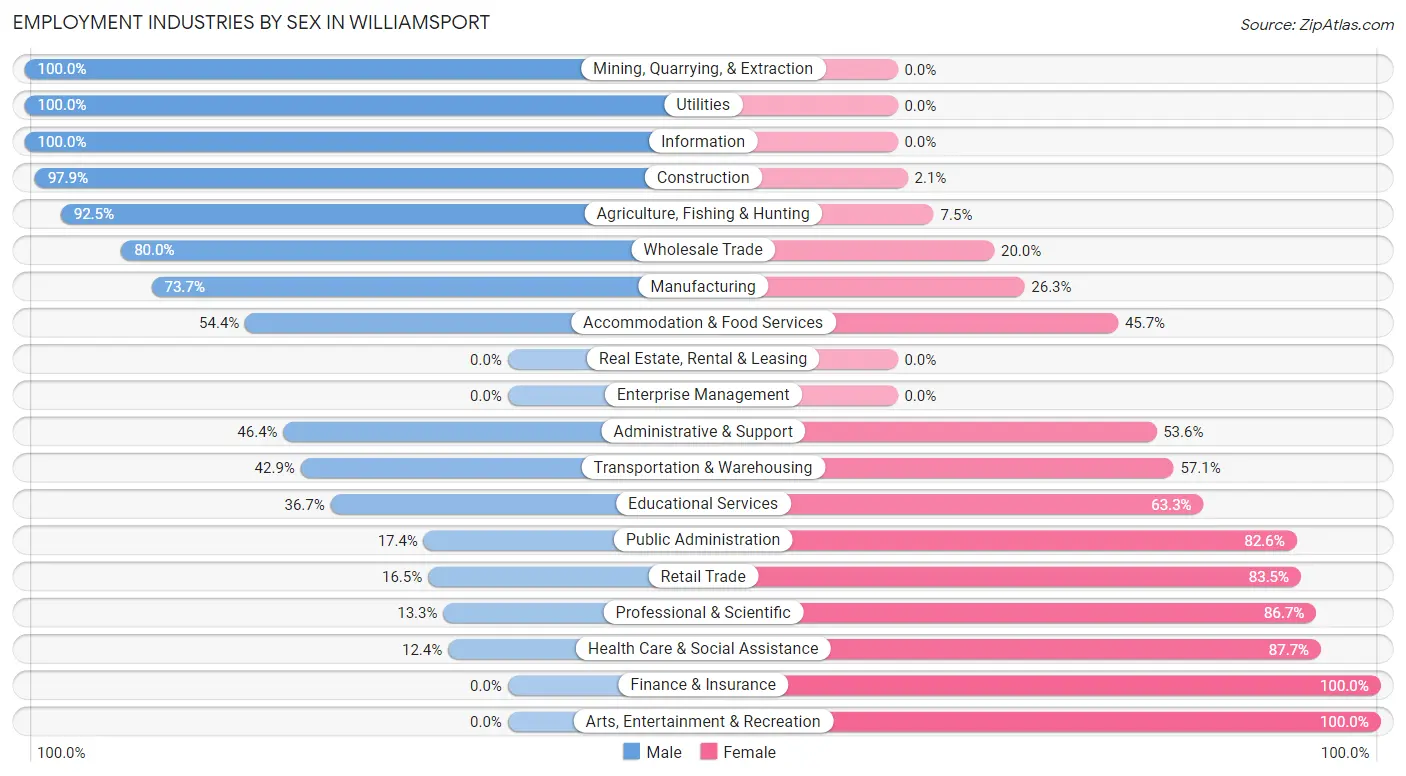
| Industry | Male | Female |
| Agriculture, Fishing & Hunting | 37 (92.5%) | 3 (7.5%) |
| Mining, Quarrying, & Extraction | 3 (100.0%) | 0 (0.0%) |
| Construction | 93 (97.9%) | 2 (2.1%) |
| Manufacturing | 244 (73.7%) | 87 (26.3%) |
| Wholesale Trade | 12 (80.0%) | 3 (20.0%) |
| Retail Trade | 17 (16.5%) | 86 (83.5%) |
| Transportation & Warehousing | 12 (42.9%) | 16 (57.1%) |
| Utilities | 13 (100.0%) | 0 (0.0%) |
| Information | 10 (100.0%) | 0 (0.0%) |
| Finance & Insurance | 0 (0.0%) | 6 (100.0%) |
| Real Estate, Rental & Leasing | 0 (0.0%) | 0 (0.0%) |
| Professional & Scientific | 2 (13.3%) | 13 (86.7%) |
| Enterprise Management | 0 (0.0%) | 0 (0.0%) |
| Administrative & Support | 13 (46.4%) | 15 (53.6%) |
| Educational Services | 22 (36.7%) | 38 (63.3%) |
| Health Care & Social Assistance | 10 (12.3%) | 71 (87.6%) |
| Arts, Entertainment & Recreation | 0 (0.0%) | 6 (100.0%) |
| Accommodation & Food Services | 25 (54.3%) | 21 (45.7%) |
| Public Administration | 4 (17.4%) | 19 (82.6%) |
| Total | 524 (57.6%) | 386 (42.4%) |
Education in Williamsport
School Enrollment in Williamsport
The most common levels of schooling among the 421 students in Williamsport are high school (160 | 38.0%), middle school (84 | 20.0%), and elementary school (80 | 19.0%).
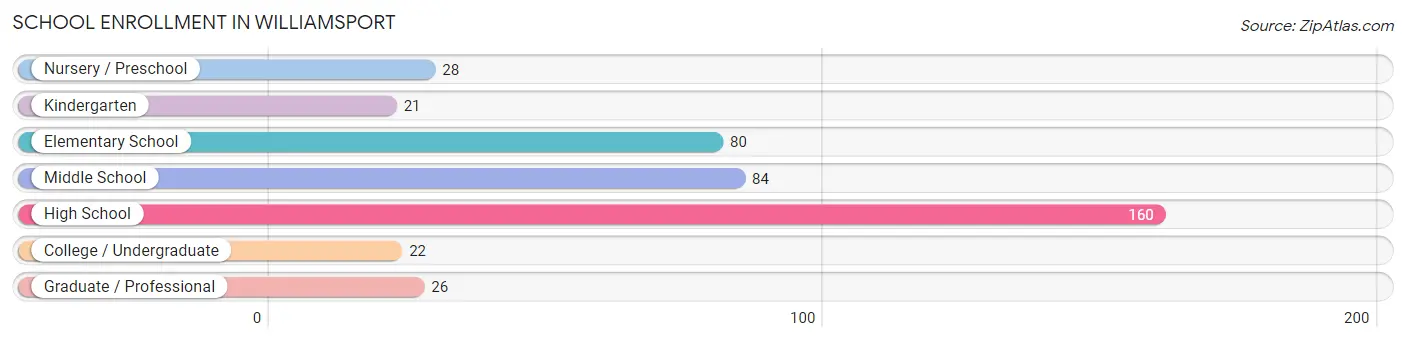
| School Level | # Students | % Students |
| Nursery / Preschool | 28 | 6.7% |
| Kindergarten | 21 | 5.0% |
| Elementary School | 80 | 19.0% |
| Middle School | 84 | 20.0% |
| High School | 160 | 38.0% |
| College / Undergraduate | 22 | 5.2% |
| Graduate / Professional | 26 | 6.2% |
| Total | 421 | 100.0% |
School Enrollment by Age by Funding Source in Williamsport
Out of a total of 421 students who are enrolled in schools in Williamsport, 29 (6.9%) attend a private institution, while the remaining 392 (93.1%) are enrolled in public schools. The age group of 15 to 17 year olds has the highest likelihood of being enrolled in private schools, with 13 (13.0% in the age bracket) enrolled. Conversely, the age group of 3 to 4 year olds has the lowest likelihood of being enrolled in a private school, with 16 (100.0% in the age bracket) attending a public institution.
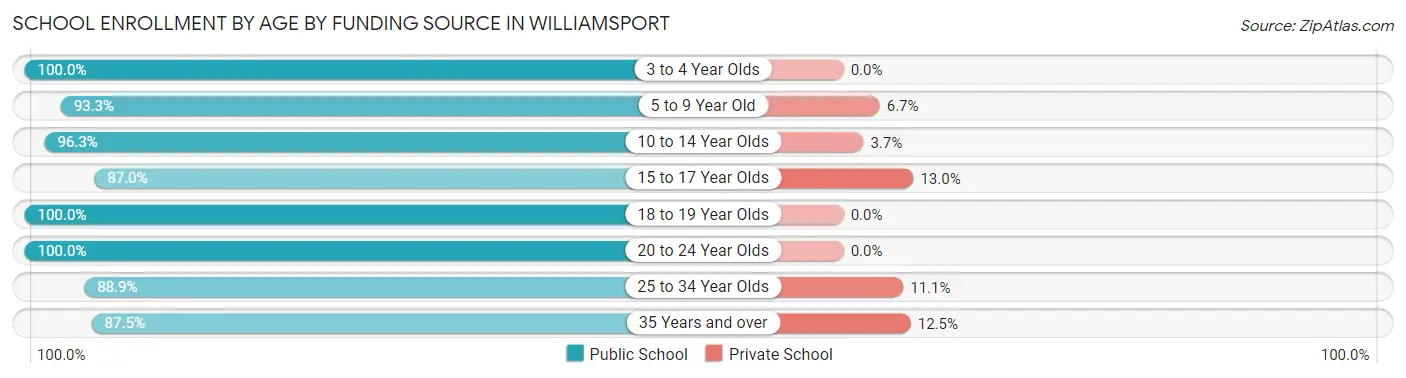
| Age Bracket | Public School | Private School |
| 3 to 4 Year Olds | 16 (100.0%) | 0 (0.0%) |
| 5 to 9 Year Old | 97 (93.3%) | 7 (6.7%) |
| 10 to 14 Year Olds | 104 (96.3%) | 4 (3.7%) |
| 15 to 17 Year Olds | 87 (87.0%) | 13 (13.0%) |
| 18 to 19 Year Olds | 45 (100.0%) | 0 (0.0%) |
| 20 to 24 Year Olds | 5 (100.0%) | 0 (0.0%) |
| 25 to 34 Year Olds | 24 (88.9%) | 3 (11.1%) |
| 35 Years and over | 14 (87.5%) | 2 (12.5%) |
| Total | 392 (93.1%) | 29 (6.9%) |
Educational Attainment by Field of Study in Williamsport
Education (64 | 23.4%), business (44 | 16.1%), arts & humanities (42 | 15.3%), bio, nature & agricultural (28 | 10.2%), and science & technology (21 | 7.7%) are the most common fields of study among 274 individuals in Williamsport who have obtained a bachelor's degree or higher.
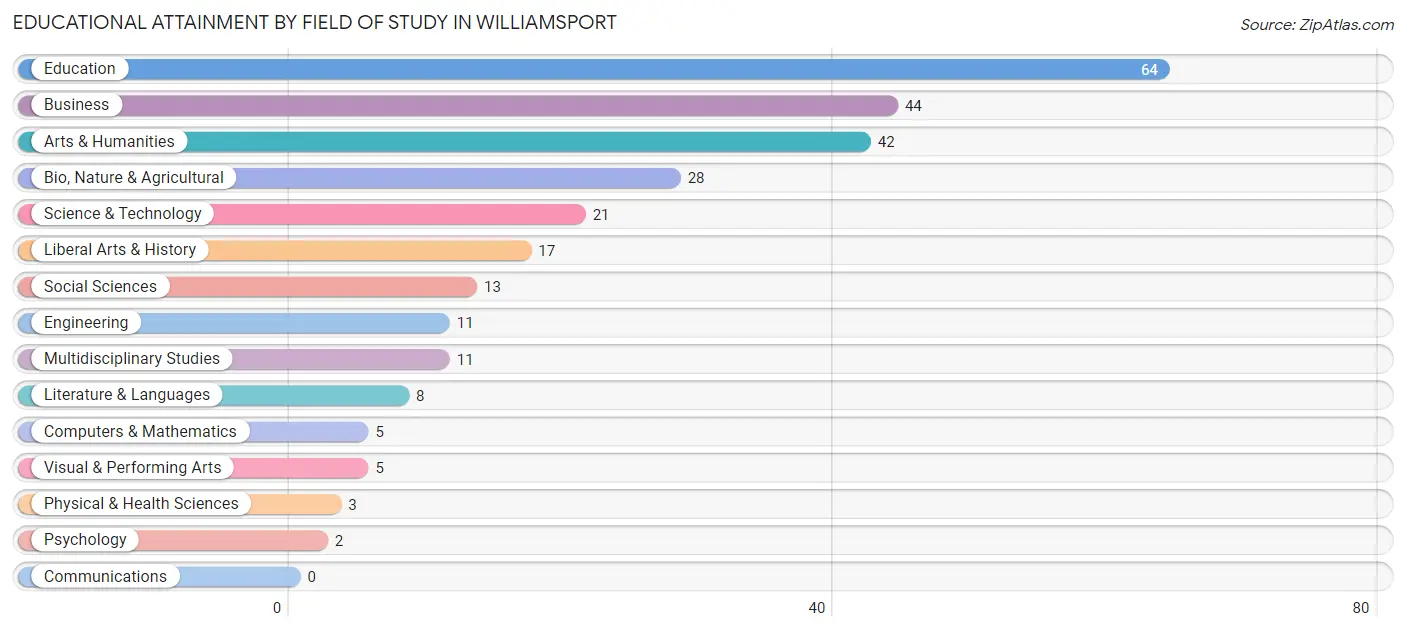
| Field of Study | # Graduates | % Graduates |
| Computers & Mathematics | 5 | 1.8% |
| Bio, Nature & Agricultural | 28 | 10.2% |
| Physical & Health Sciences | 3 | 1.1% |
| Psychology | 2 | 0.7% |
| Social Sciences | 13 | 4.7% |
| Engineering | 11 | 4.0% |
| Multidisciplinary Studies | 11 | 4.0% |
| Science & Technology | 21 | 7.7% |
| Business | 44 | 16.1% |
| Education | 64 | 23.4% |
| Literature & Languages | 8 | 2.9% |
| Liberal Arts & History | 17 | 6.2% |
| Visual & Performing Arts | 5 | 1.8% |
| Communications | 0 | 0.0% |
| Arts & Humanities | 42 | 15.3% |
| Total | 274 | 100.0% |
Transportation & Commute in Williamsport
Vehicle Availability by Sex in Williamsport
The most prevalent vehicle ownership categories in Williamsport are males with 2 vehicles (245, accounting for 47.7%) and females with 2 vehicles (155, making up 63.5%).
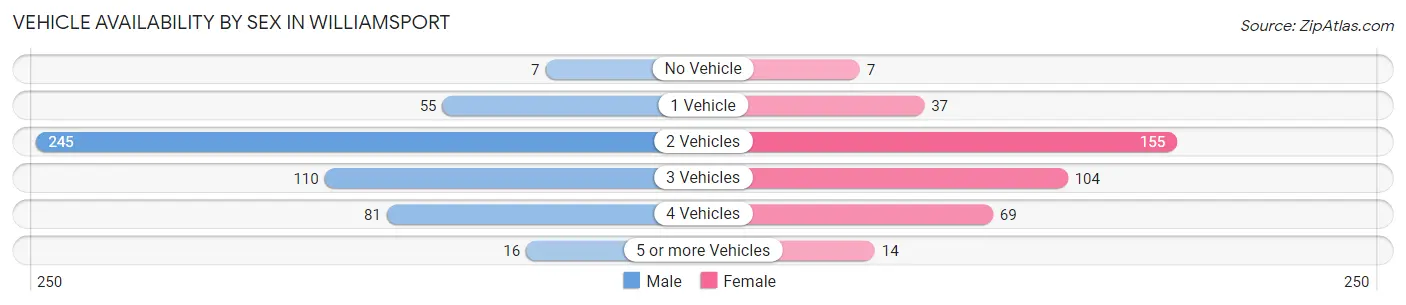
| Vehicles Available | Male | Female |
| No Vehicle | 7 (1.4%) | 7 (1.8%) |
| 1 Vehicle | 55 (10.7%) | 37 (9.6%) |
| 2 Vehicles | 245 (47.7%) | 155 (40.2%) |
| 3 Vehicles | 110 (21.4%) | 104 (26.9%) |
| 4 Vehicles | 81 (15.8%) | 69 (17.9%) |
| 5 or more Vehicles | 16 (3.1%) | 14 (3.6%) |
| Total | 514 (100.0%) | 386 (100.0%) |
Commute Time in Williamsport
The most frequently occuring commute durations in Williamsport are 5 to 9 minutes (142 commuters, 17.5%), 45 to 59 minutes (142 commuters, 17.5%), and 10 to 14 minutes (139 commuters, 17.2%).
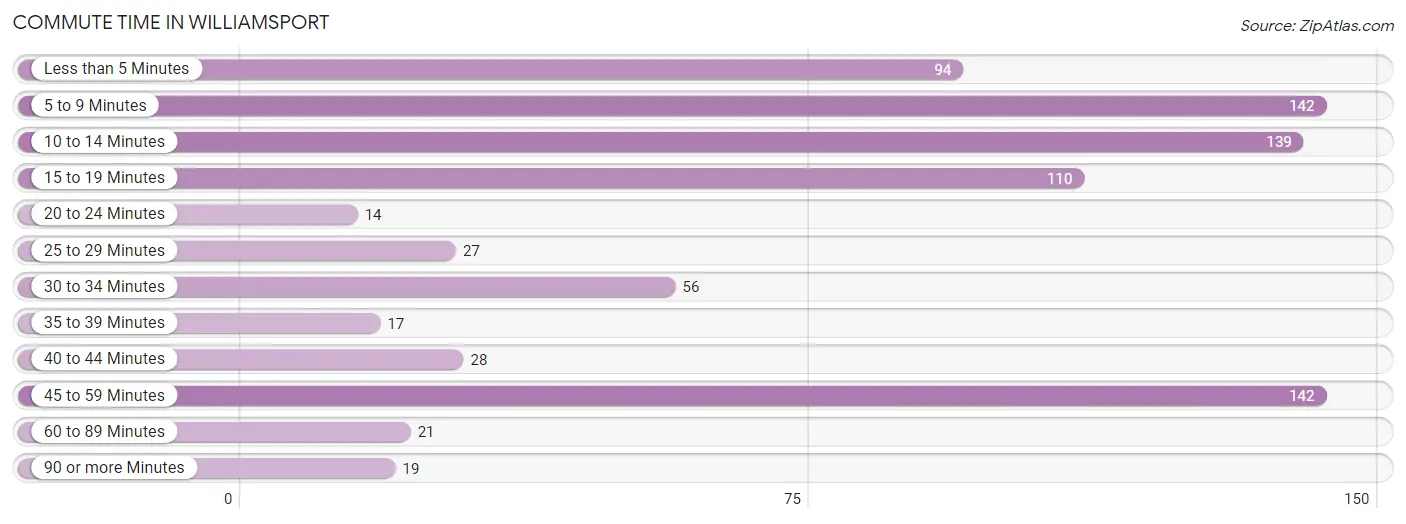
| Commute Time | # Commuters | % Commuters |
| Less than 5 Minutes | 94 | 11.6% |
| 5 to 9 Minutes | 142 | 17.5% |
| 10 to 14 Minutes | 139 | 17.2% |
| 15 to 19 Minutes | 110 | 13.6% |
| 20 to 24 Minutes | 14 | 1.7% |
| 25 to 29 Minutes | 27 | 3.3% |
| 30 to 34 Minutes | 56 | 6.9% |
| 35 to 39 Minutes | 17 | 2.1% |
| 40 to 44 Minutes | 28 | 3.5% |
| 45 to 59 Minutes | 142 | 17.5% |
| 60 to 89 Minutes | 21 | 2.6% |
| 90 or more Minutes | 19 | 2.4% |
Commute Time by Sex in Williamsport
The most common commute times in Williamsport are 45 to 59 minutes (102 commuters, 22.4%) for males and 10 to 14 minutes (76 commuters, 21.5%) for females.
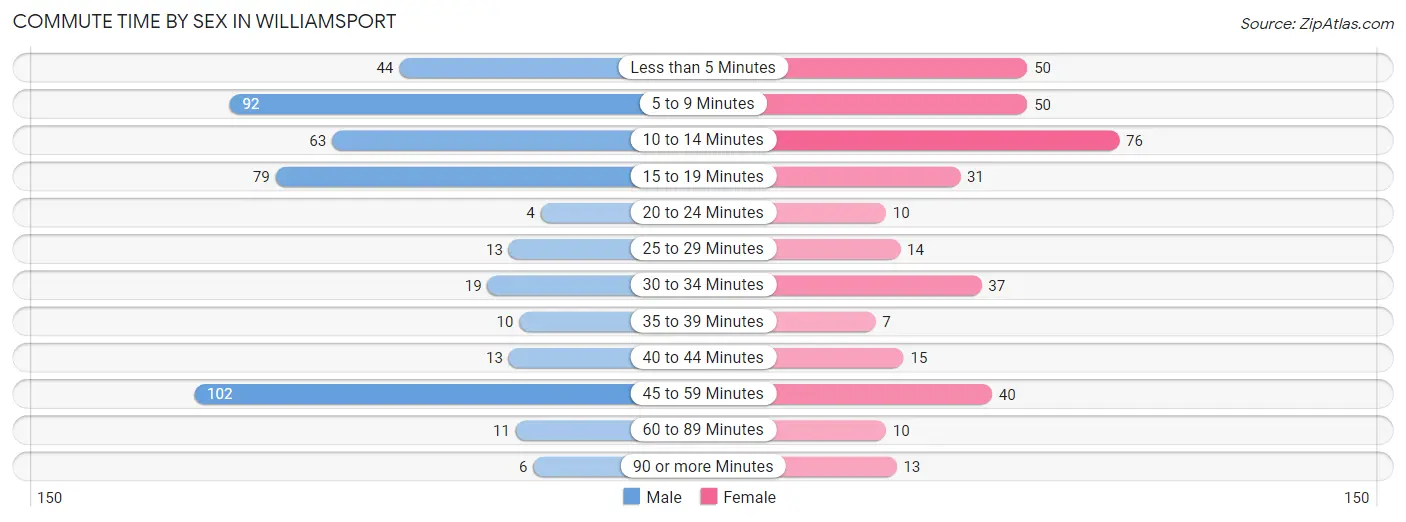
| Commute Time | Male | Female |
| Less than 5 Minutes | 44 (9.7%) | 50 (14.2%) |
| 5 to 9 Minutes | 92 (20.2%) | 50 (14.2%) |
| 10 to 14 Minutes | 63 (13.8%) | 76 (21.5%) |
| 15 to 19 Minutes | 79 (17.3%) | 31 (8.8%) |
| 20 to 24 Minutes | 4 (0.9%) | 10 (2.8%) |
| 25 to 29 Minutes | 13 (2.9%) | 14 (4.0%) |
| 30 to 34 Minutes | 19 (4.2%) | 37 (10.5%) |
| 35 to 39 Minutes | 10 (2.2%) | 7 (2.0%) |
| 40 to 44 Minutes | 13 (2.9%) | 15 (4.3%) |
| 45 to 59 Minutes | 102 (22.4%) | 40 (11.3%) |
| 60 to 89 Minutes | 11 (2.4%) | 10 (2.8%) |
| 90 or more Minutes | 6 (1.3%) | 13 (3.7%) |
Time of Departure to Work by Sex in Williamsport
The most frequent times of departure to work in Williamsport are 6:30 AM to 6:59 AM (95, 20.8%) for males and 7:00 AM to 7:29 AM (63, 17.8%) for females.
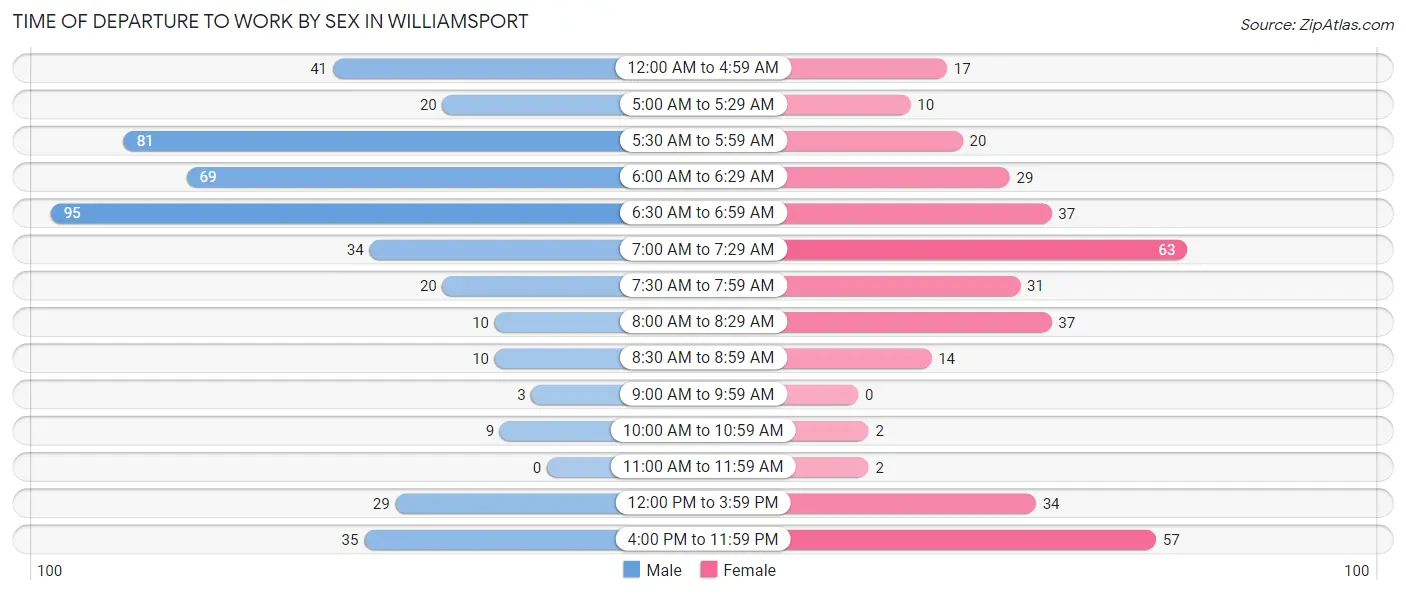
| Time of Departure | Male | Female |
| 12:00 AM to 4:59 AM | 41 (9.0%) | 17 (4.8%) |
| 5:00 AM to 5:29 AM | 20 (4.4%) | 10 (2.8%) |
| 5:30 AM to 5:59 AM | 81 (17.8%) | 20 (5.7%) |
| 6:00 AM to 6:29 AM | 69 (15.1%) | 29 (8.2%) |
| 6:30 AM to 6:59 AM | 95 (20.8%) | 37 (10.5%) |
| 7:00 AM to 7:29 AM | 34 (7.5%) | 63 (17.8%) |
| 7:30 AM to 7:59 AM | 20 (4.4%) | 31 (8.8%) |
| 8:00 AM to 8:29 AM | 10 (2.2%) | 37 (10.5%) |
| 8:30 AM to 8:59 AM | 10 (2.2%) | 14 (4.0%) |
| 9:00 AM to 9:59 AM | 3 (0.7%) | 0 (0.0%) |
| 10:00 AM to 10:59 AM | 9 (2.0%) | 2 (0.6%) |
| 11:00 AM to 11:59 AM | 0 (0.0%) | 2 (0.6%) |
| 12:00 PM to 3:59 PM | 29 (6.4%) | 34 (9.6%) |
| 4:00 PM to 11:59 PM | 35 (7.7%) | 57 (16.2%) |
| Total | 456 (100.0%) | 353 (100.0%) |
Housing Occupancy in Williamsport
Occupancy by Ownership in Williamsport
Of the total 683 dwellings in Williamsport, owner-occupied units account for 458 (67.1%), while renter-occupied units make up 225 (32.9%).
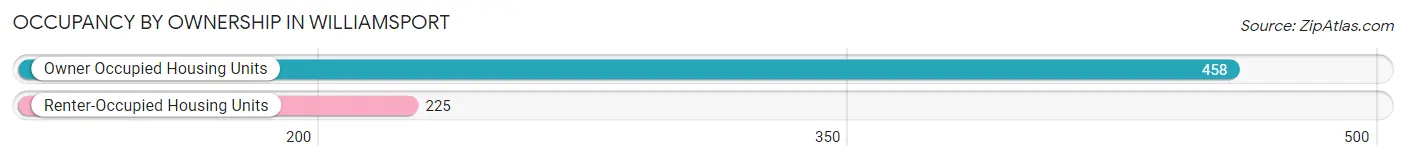
| Occupancy | # Housing Units | % Housing Units |
| Owner Occupied Housing Units | 458 | 67.1% |
| Renter-Occupied Housing Units | 225 | 32.9% |
| Total Occupied Housing Units | 683 | 100.0% |
Occupancy by Household Size in Williamsport
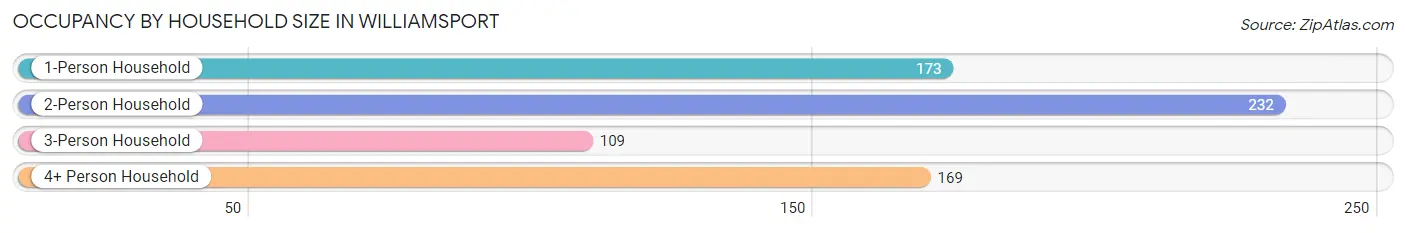
| Household Size | # Housing Units | % Housing Units |
| 1-Person Household | 173 | 25.3% |
| 2-Person Household | 232 | 34.0% |
| 3-Person Household | 109 | 16.0% |
| 4+ Person Household | 169 | 24.7% |
| Total Housing Units | 683 | 100.0% |
Occupancy by Ownership by Household Size in Williamsport
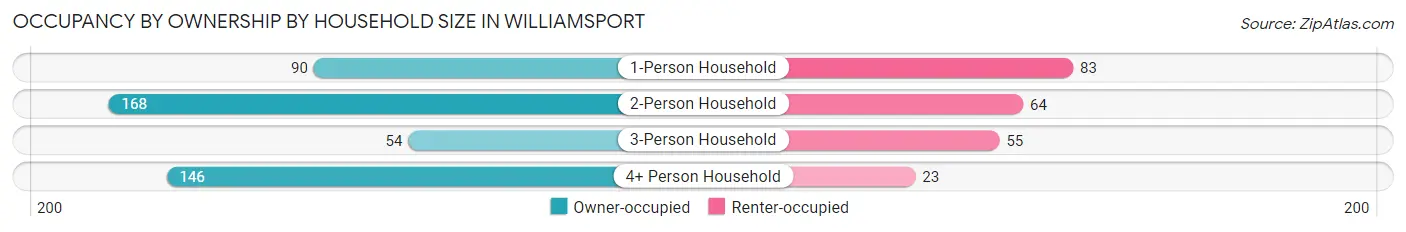
| Household Size | Owner-occupied | Renter-occupied |
| 1-Person Household | 90 (52.0%) | 83 (48.0%) |
| 2-Person Household | 168 (72.4%) | 64 (27.6%) |
| 3-Person Household | 54 (49.5%) | 55 (50.5%) |
| 4+ Person Household | 146 (86.4%) | 23 (13.6%) |
| Total Housing Units | 458 (67.1%) | 225 (32.9%) |
Occupancy by Educational Attainment in Williamsport
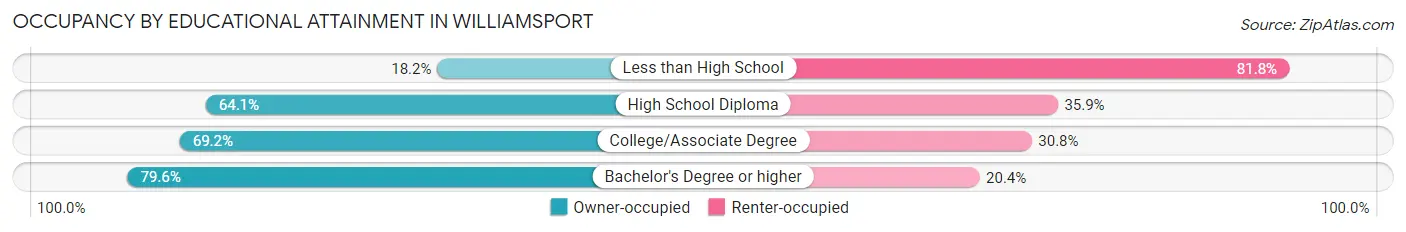
| Household Size | Owner-occupied | Renter-occupied |
| Less than High School | 6 (18.2%) | 27 (81.8%) |
| High School Diploma | 164 (64.1%) | 92 (35.9%) |
| College/Associate Degree | 171 (69.2%) | 76 (30.8%) |
| Bachelor's Degree or higher | 117 (79.6%) | 30 (20.4%) |
Occupancy by Age of Householder in Williamsport
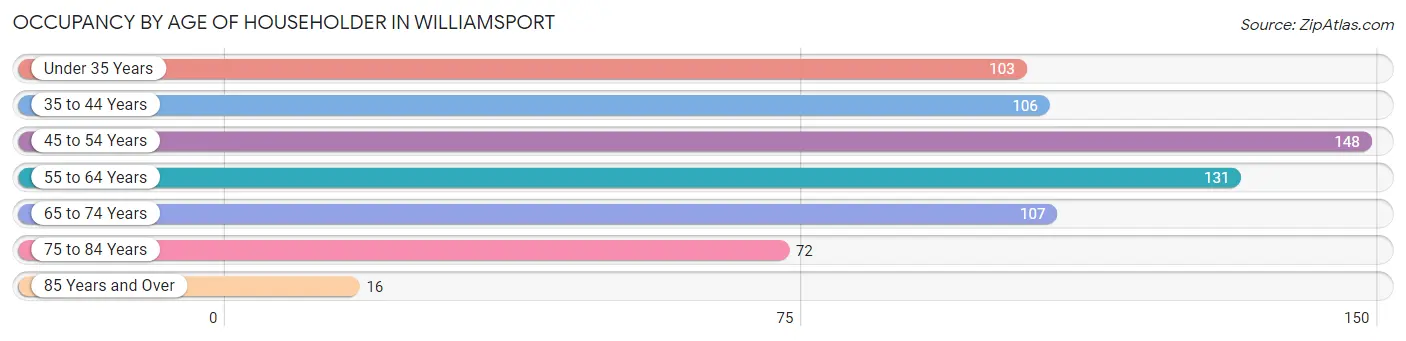
| Age Bracket | # Households | % Households |
| Under 35 Years | 103 | 15.1% |
| 35 to 44 Years | 106 | 15.5% |
| 45 to 54 Years | 148 | 21.7% |
| 55 to 64 Years | 131 | 19.2% |
| 65 to 74 Years | 107 | 15.7% |
| 75 to 84 Years | 72 | 10.5% |
| 85 Years and Over | 16 | 2.3% |
| Total | 683 | 100.0% |
Housing Finances in Williamsport
Median Income by Occupancy in Williamsport
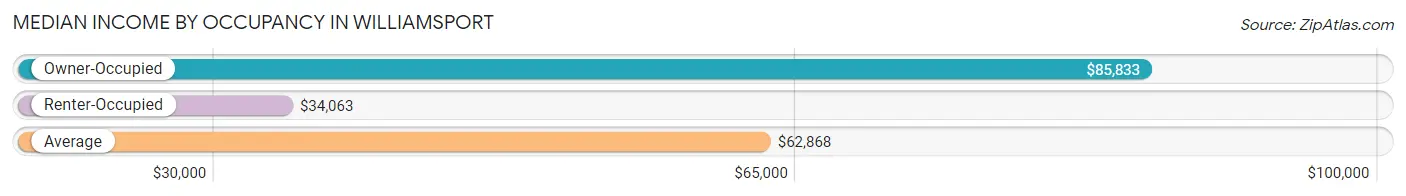
| Occupancy Type | # Households | Median Income |
| Owner-Occupied | 458 (67.1%) | $85,833 |
| Renter-Occupied | 225 (32.9%) | $34,063 |
| Average | 683 (100.0%) | $62,868 |
Occupancy by Householder Income Bracket in Williamsport
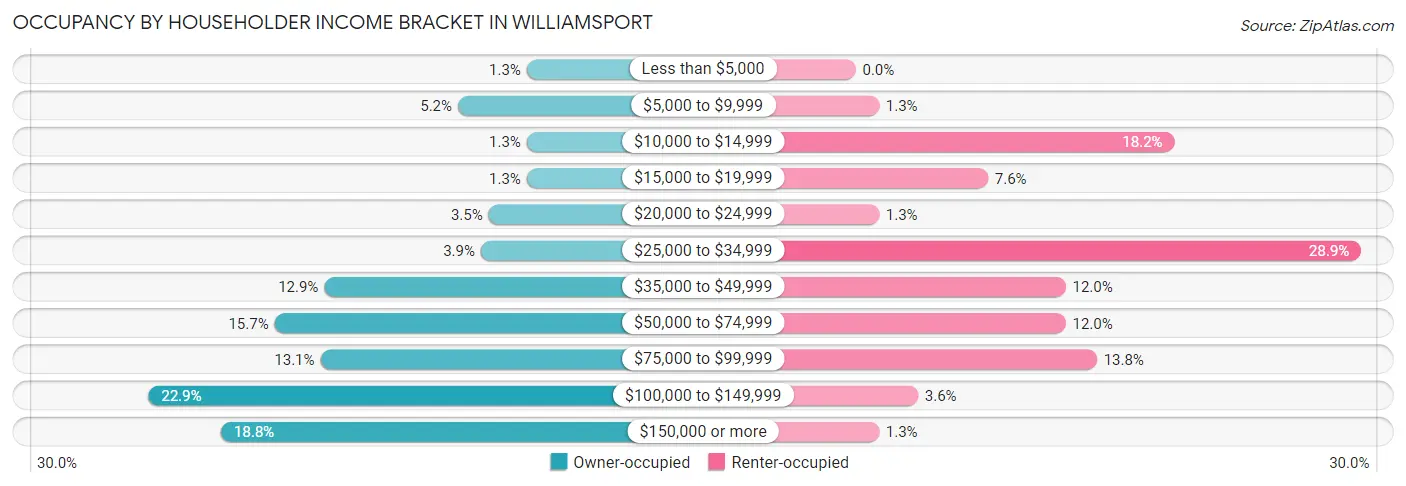
| Income Bracket | Owner-occupied | Renter-occupied |
| Less than $5,000 | 6 (1.3%) | 0 (0.0%) |
| $5,000 to $9,999 | 24 (5.2%) | 3 (1.3%) |
| $10,000 to $14,999 | 6 (1.3%) | 41 (18.2%) |
| $15,000 to $19,999 | 6 (1.3%) | 17 (7.6%) |
| $20,000 to $24,999 | 16 (3.5%) | 3 (1.3%) |
| $25,000 to $34,999 | 18 (3.9%) | 65 (28.9%) |
| $35,000 to $49,999 | 59 (12.9%) | 27 (12.0%) |
| $50,000 to $74,999 | 72 (15.7%) | 27 (12.0%) |
| $75,000 to $99,999 | 60 (13.1%) | 31 (13.8%) |
| $100,000 to $149,999 | 105 (22.9%) | 8 (3.6%) |
| $150,000 or more | 86 (18.8%) | 3 (1.3%) |
| Total | 458 (100.0%) | 225 (100.0%) |
Monthly Housing Cost Tiers in Williamsport
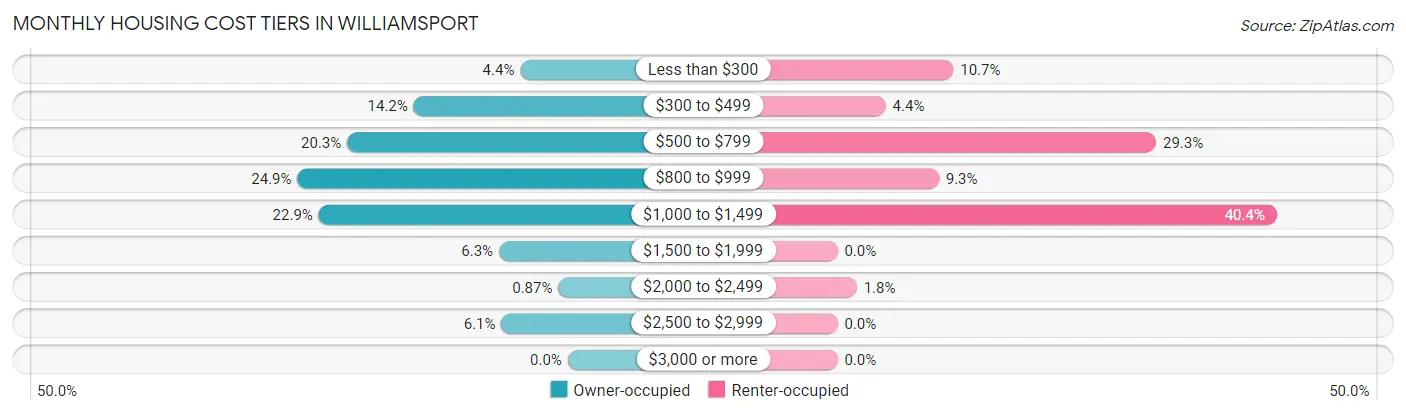
| Monthly Cost | Owner-occupied | Renter-occupied |
| Less than $300 | 20 (4.4%) | 24 (10.7%) |
| $300 to $499 | 65 (14.2%) | 10 (4.4%) |
| $500 to $799 | 93 (20.3%) | 66 (29.3%) |
| $800 to $999 | 114 (24.9%) | 21 (9.3%) |
| $1,000 to $1,499 | 105 (22.9%) | 91 (40.4%) |
| $1,500 to $1,999 | 29 (6.3%) | 0 (0.0%) |
| $2,000 to $2,499 | 4 (0.9%) | 4 (1.8%) |
| $2,500 to $2,999 | 28 (6.1%) | 0 (0.0%) |
| $3,000 or more | 0 (0.0%) | 0 (0.0%) |
| Total | 458 (100.0%) | 225 (100.0%) |
Physical Housing Characteristics in Williamsport
Housing Structures in Williamsport
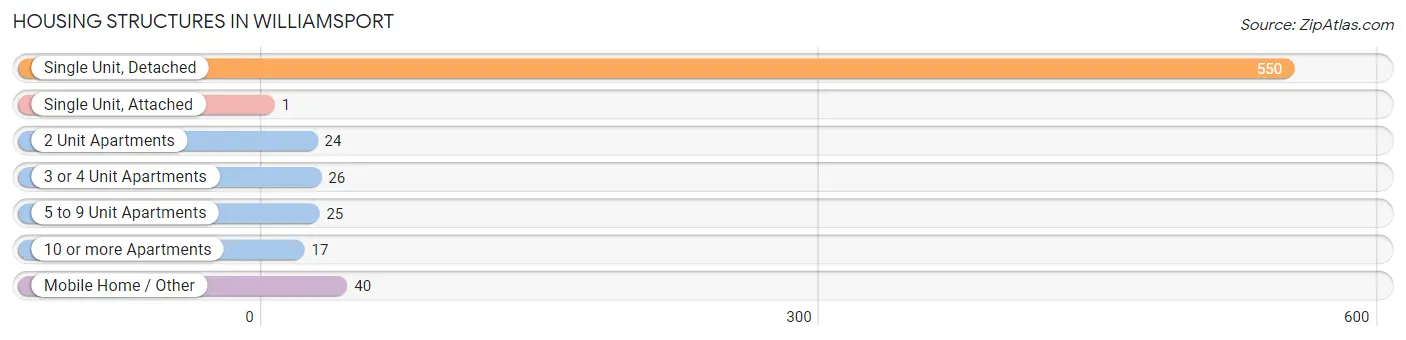
| Structure Type | # Housing Units | % Housing Units |
| Single Unit, Detached | 550 | 80.5% |
| Single Unit, Attached | 1 | 0.2% |
| 2 Unit Apartments | 24 | 3.5% |
| 3 or 4 Unit Apartments | 26 | 3.8% |
| 5 to 9 Unit Apartments | 25 | 3.7% |
| 10 or more Apartments | 17 | 2.5% |
| Mobile Home / Other | 40 | 5.9% |
| Total | 683 | 100.0% |
Housing Structures by Occupancy in Williamsport
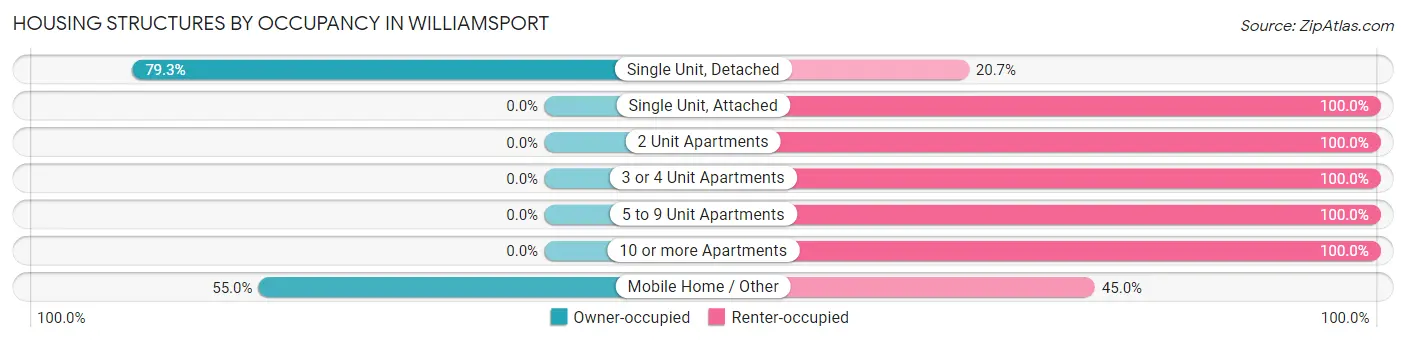
| Structure Type | Owner-occupied | Renter-occupied |
| Single Unit, Detached | 436 (79.3%) | 114 (20.7%) |
| Single Unit, Attached | 0 (0.0%) | 1 (100.0%) |
| 2 Unit Apartments | 0 (0.0%) | 24 (100.0%) |
| 3 or 4 Unit Apartments | 0 (0.0%) | 26 (100.0%) |
| 5 to 9 Unit Apartments | 0 (0.0%) | 25 (100.0%) |
| 10 or more Apartments | 0 (0.0%) | 17 (100.0%) |
| Mobile Home / Other | 22 (55.0%) | 18 (45.0%) |
| Total | 458 (67.1%) | 225 (32.9%) |
Housing Structures by Number of Rooms in Williamsport
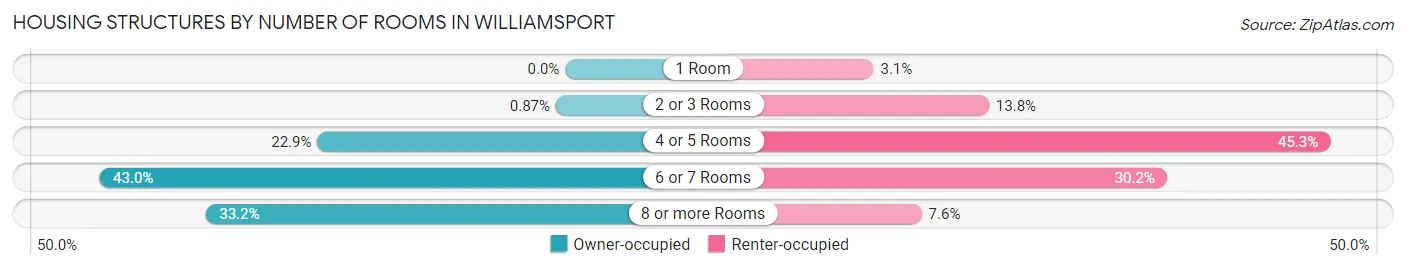
| Number of Rooms | Owner-occupied | Renter-occupied |
| 1 Room | 0 (0.0%) | 7 (3.1%) |
| 2 or 3 Rooms | 4 (0.9%) | 31 (13.8%) |
| 4 or 5 Rooms | 105 (22.9%) | 102 (45.3%) |
| 6 or 7 Rooms | 197 (43.0%) | 68 (30.2%) |
| 8 or more Rooms | 152 (33.2%) | 17 (7.6%) |
| Total | 458 (100.0%) | 225 (100.0%) |
Housing Structure by Heating Type in Williamsport
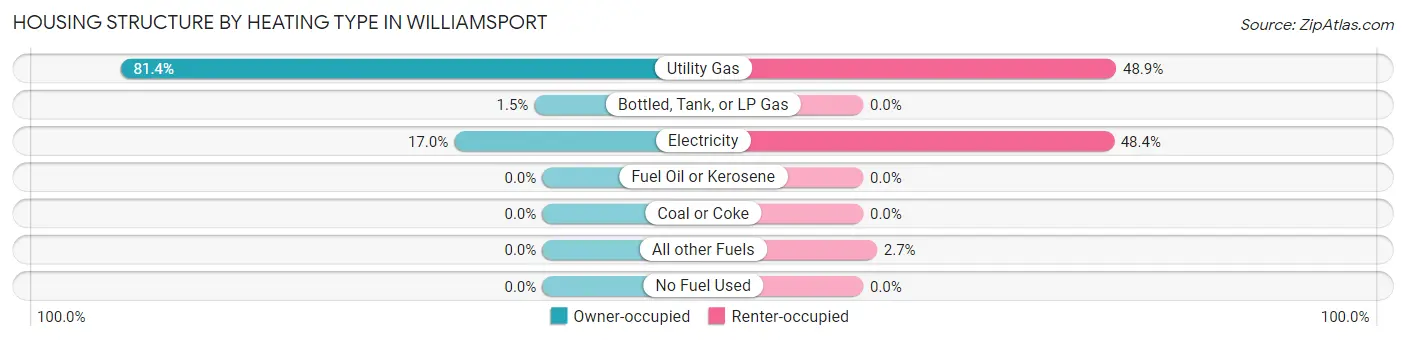
| Heating Type | Owner-occupied | Renter-occupied |
| Utility Gas | 373 (81.4%) | 110 (48.9%) |
| Bottled, Tank, or LP Gas | 7 (1.5%) | 0 (0.0%) |
| Electricity | 78 (17.0%) | 109 (48.4%) |
| Fuel Oil or Kerosene | 0 (0.0%) | 0 (0.0%) |
| Coal or Coke | 0 (0.0%) | 0 (0.0%) |
| All other Fuels | 0 (0.0%) | 6 (2.7%) |
| No Fuel Used | 0 (0.0%) | 0 (0.0%) |
| Total | 458 (100.0%) | 225 (100.0%) |
Household Vehicle Usage in Williamsport
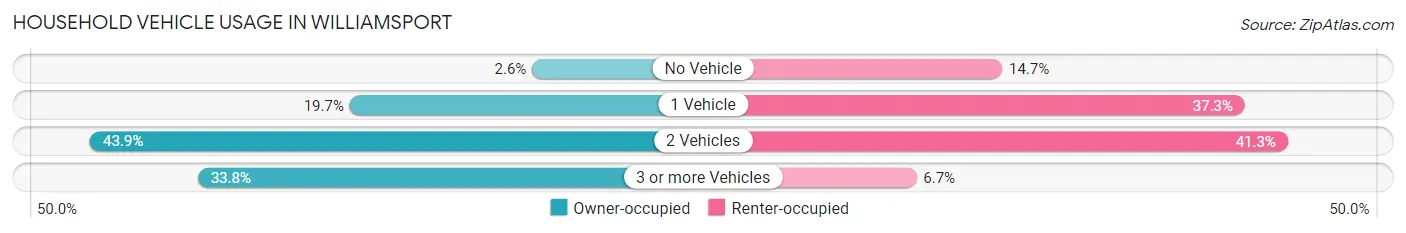
| Vehicles per Household | Owner-occupied | Renter-occupied |
| No Vehicle | 12 (2.6%) | 33 (14.7%) |
| 1 Vehicle | 90 (19.7%) | 84 (37.3%) |
| 2 Vehicles | 201 (43.9%) | 93 (41.3%) |
| 3 or more Vehicles | 155 (33.8%) | 15 (6.7%) |
| Total | 458 (100.0%) | 225 (100.0%) |
Real Estate & Mortgages in Williamsport
Real Estate and Mortgage Overview in Williamsport
| Characteristic | Without Mortgage | With Mortgage |
| Housing Units | 143 | 315 |
| Median Property Value | $142,000 | $119,100 |
| Median Household Income | $53,750 | $62 |
| Monthly Housing Costs | $485 | $0 |
| Real Estate Taxes | $774 | $7 |
Property Value by Mortgage Status in Williamsport
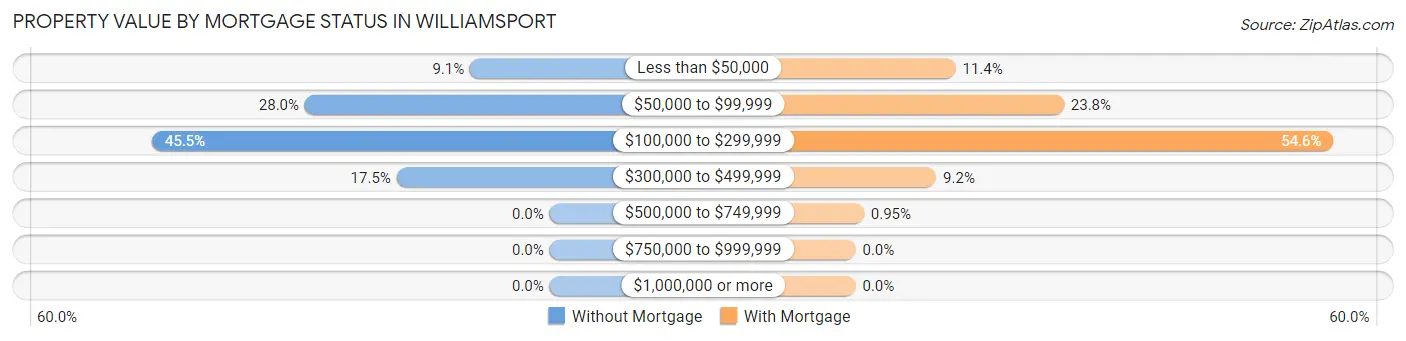
| Property Value | Without Mortgage | With Mortgage |
| Less than $50,000 | 13 (9.1%) | 36 (11.4%) |
| $50,000 to $99,999 | 40 (28.0%) | 75 (23.8%) |
| $100,000 to $299,999 | 65 (45.5%) | 172 (54.6%) |
| $300,000 to $499,999 | 25 (17.5%) | 29 (9.2%) |
| $500,000 to $749,999 | 0 (0.0%) | 3 (0.9%) |
| $750,000 to $999,999 | 0 (0.0%) | 0 (0.0%) |
| $1,000,000 or more | 0 (0.0%) | 0 (0.0%) |
| Total | 143 (100.0%) | 315 (100.0%) |
Household Income by Mortgage Status in Williamsport
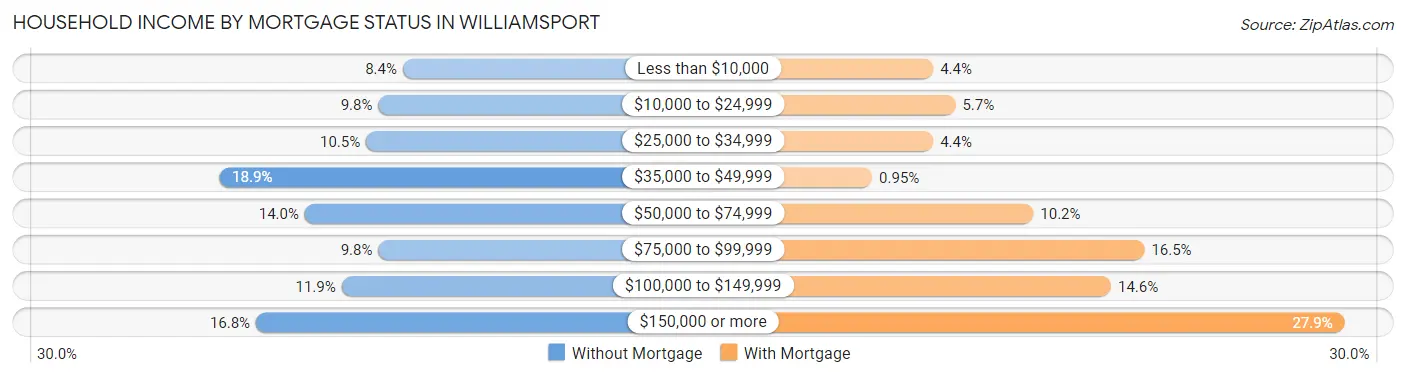
| Household Income | Without Mortgage | With Mortgage |
| Less than $10,000 | 12 (8.4%) | 14 (4.4%) |
| $10,000 to $24,999 | 14 (9.8%) | 18 (5.7%) |
| $25,000 to $34,999 | 15 (10.5%) | 14 (4.4%) |
| $35,000 to $49,999 | 27 (18.9%) | 3 (0.9%) |
| $50,000 to $74,999 | 20 (14.0%) | 32 (10.2%) |
| $75,000 to $99,999 | 14 (9.8%) | 52 (16.5%) |
| $100,000 to $149,999 | 17 (11.9%) | 46 (14.6%) |
| $150,000 or more | 24 (16.8%) | 88 (27.9%) |
| Total | 143 (100.0%) | 315 (100.0%) |
Property Value to Household Income Ratio in Williamsport
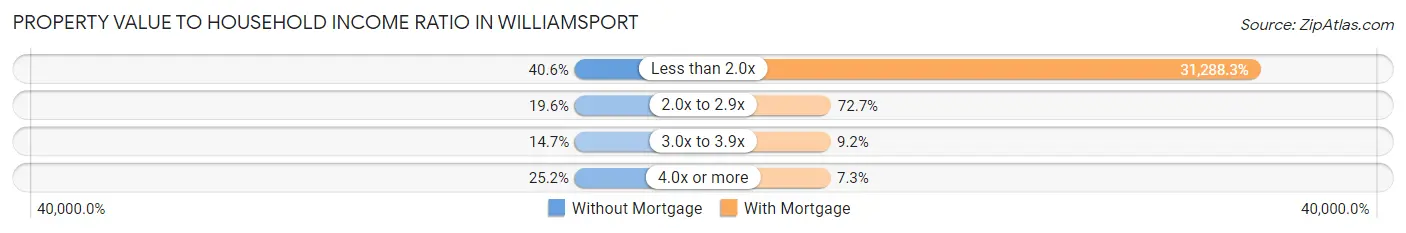
| Value-to-Income Ratio | Without Mortgage | With Mortgage |
| Less than 2.0x | 58 (40.6%) | 98,558 (31,288.2%) |
| 2.0x to 2.9x | 28 (19.6%) | 229 (72.7%) |
| 3.0x to 3.9x | 21 (14.7%) | 29 (9.2%) |
| 4.0x or more | 36 (25.2%) | 23 (7.3%) |
| Total | 143 (100.0%) | 315 (100.0%) |
Real Estate Taxes by Mortgage Status in Williamsport
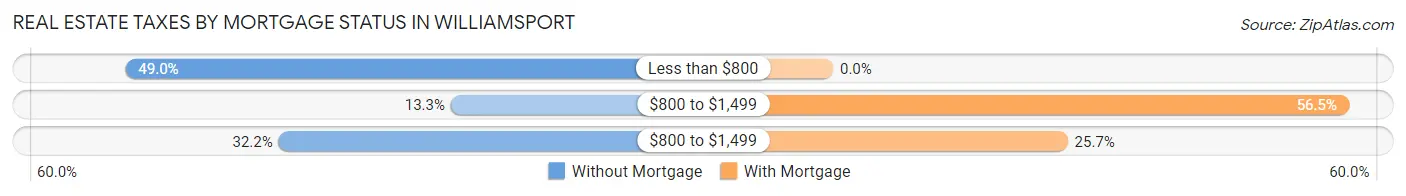
| Property Taxes | Without Mortgage | With Mortgage |
| Less than $800 | 70 (48.9%) | 0 (0.0%) |
| $800 to $1,499 | 19 (13.3%) | 178 (56.5%) |
| $800 to $1,499 | 46 (32.2%) | 81 (25.7%) |
| Total | 143 (100.0%) | 315 (100.0%) |
Health & Disability in Williamsport
Health Insurance Coverage by Age in Williamsport
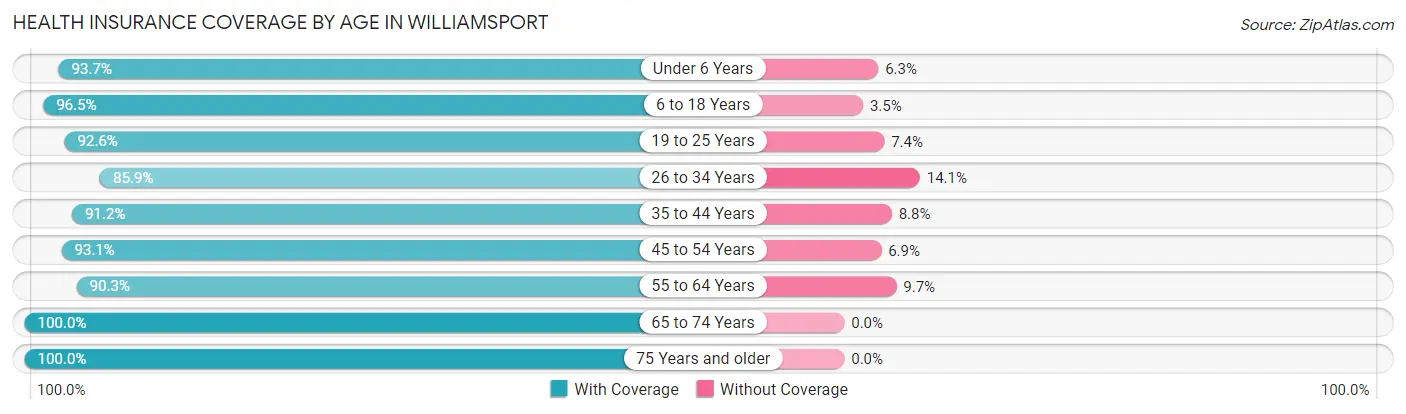
| Age Bracket | With Coverage | Without Coverage |
| Under 6 Years | 74 (93.7%) | 5 (6.3%) |
| 6 to 18 Years | 333 (96.5%) | 12 (3.5%) |
| 19 to 25 Years | 112 (92.6%) | 9 (7.4%) |
| 26 to 34 Years | 183 (85.9%) | 30 (14.1%) |
| 35 to 44 Years | 165 (91.2%) | 16 (8.8%) |
| 45 to 54 Years | 257 (93.1%) | 19 (6.9%) |
| 55 to 64 Years | 186 (90.3%) | 20 (9.7%) |
| 65 to 74 Years | 190 (100.0%) | 0 (0.0%) |
| 75 Years and older | 142 (100.0%) | 0 (0.0%) |
| Total | 1,642 (93.7%) | 111 (6.3%) |
Health Insurance Coverage by Citizenship Status in Williamsport
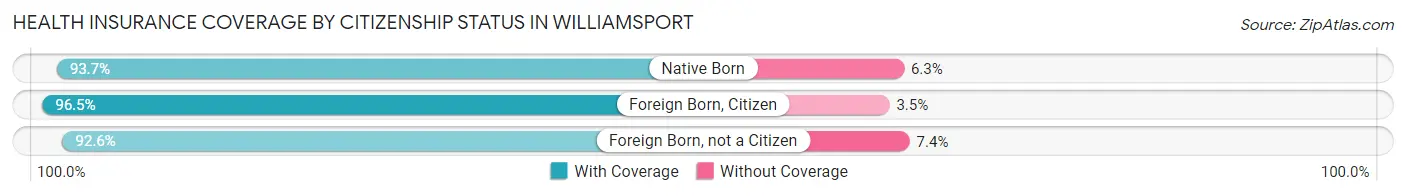
| Citizenship Status | With Coverage | Without Coverage |
| Native Born | 74 (93.7%) | 5 (6.3%) |
| Foreign Born, Citizen | 333 (96.5%) | 12 (3.5%) |
| Foreign Born, not a Citizen | 112 (92.6%) | 9 (7.4%) |
Health Insurance Coverage by Household Income in Williamsport
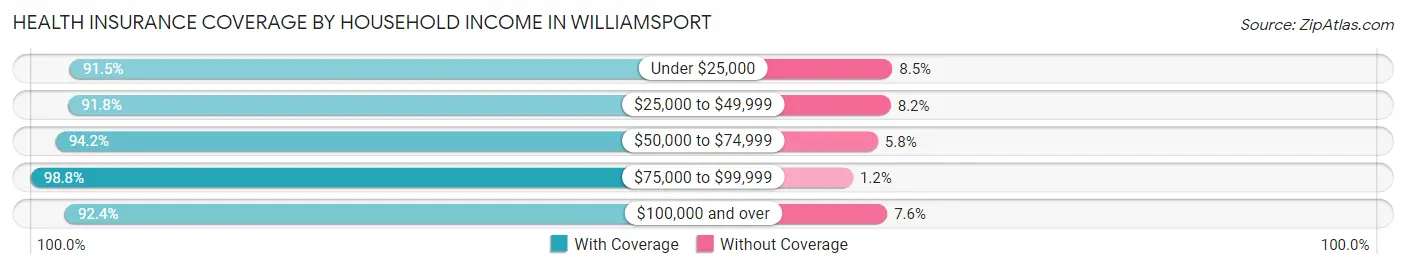
| Household Income | With Coverage | Without Coverage |
| Under $25,000 | 182 (91.5%) | 17 (8.5%) |
| $25,000 to $49,999 | 312 (91.8%) | 28 (8.2%) |
| $50,000 to $74,999 | 210 (94.2%) | 13 (5.8%) |
| $75,000 to $99,999 | 340 (98.8%) | 4 (1.2%) |
| $100,000 and over | 598 (92.4%) | 49 (7.6%) |
Public vs Private Health Insurance Coverage by Age in Williamsport
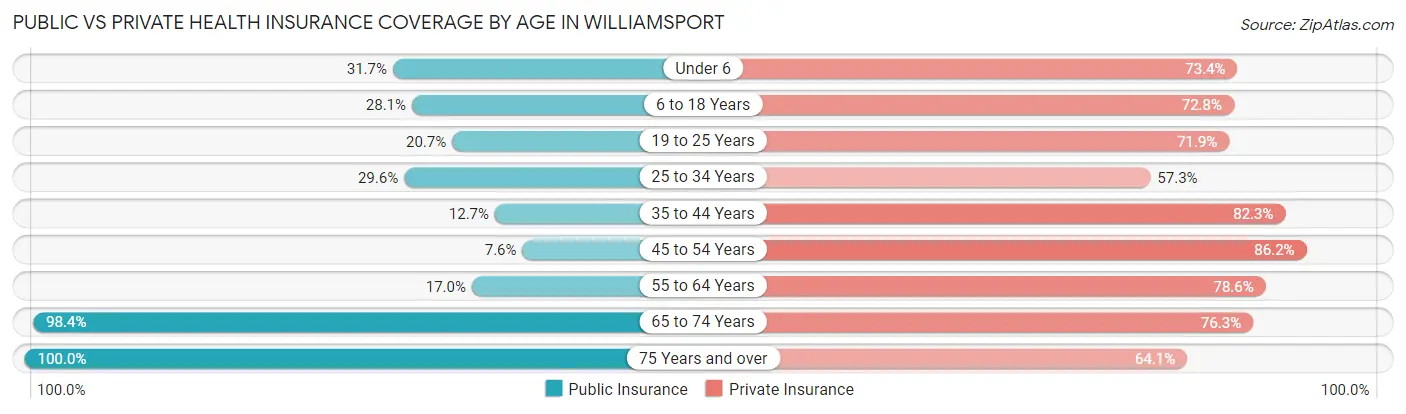
| Age Bracket | Public Insurance | Private Insurance |
| Under 6 | 25 (31.7%) | 58 (73.4%) |
| 6 to 18 Years | 97 (28.1%) | 251 (72.8%) |
| 19 to 25 Years | 25 (20.7%) | 87 (71.9%) |
| 25 to 34 Years | 63 (29.6%) | 122 (57.3%) |
| 35 to 44 Years | 23 (12.7%) | 149 (82.3%) |
| 45 to 54 Years | 21 (7.6%) | 238 (86.2%) |
| 55 to 64 Years | 35 (17.0%) | 162 (78.6%) |
| 65 to 74 Years | 187 (98.4%) | 145 (76.3%) |
| 75 Years and over | 142 (100.0%) | 91 (64.1%) |
| Total | 618 (35.2%) | 1,303 (74.3%) |
Disability Status by Sex by Age in Williamsport
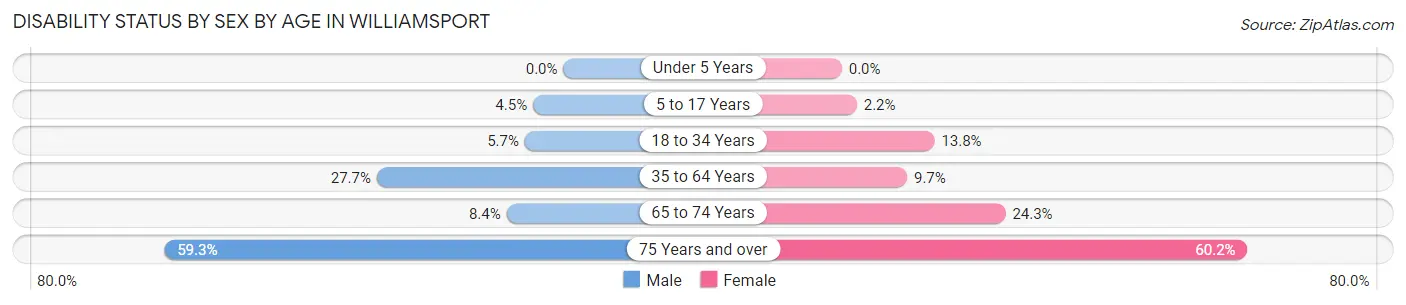
| Age Bracket | Male | Female |
| Under 5 Years | 0 (0.0%) | 0 (0.0%) |
| 5 to 17 Years | 6 (4.5%) | 4 (2.2%) |
| 18 to 34 Years | 11 (5.7%) | 26 (13.8%) |
| 35 to 64 Years | 95 (27.7%) | 31 (9.7%) |
| 65 to 74 Years | 7 (8.4%) | 26 (24.3%) |
| 75 Years and over | 32 (59.3%) | 53 (60.2%) |
Disability Class by Sex by Age in Williamsport
Disability Class: Hearing Difficulty
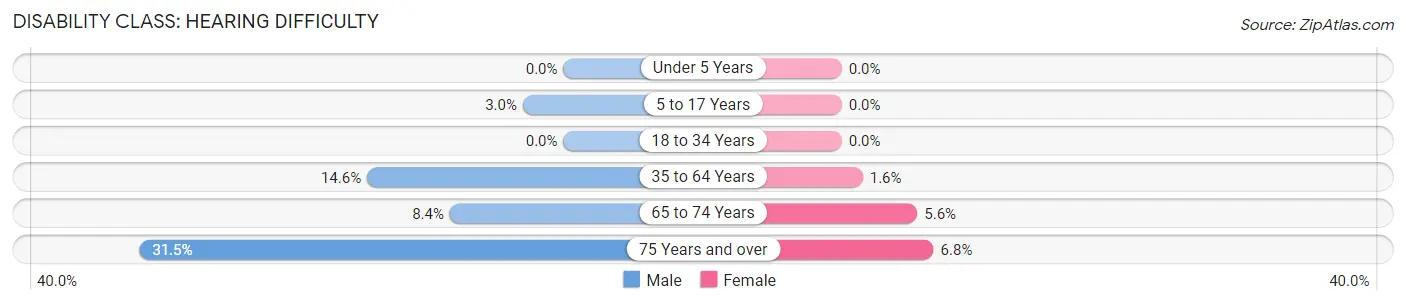
| Age Bracket | Male | Female |
| Under 5 Years | 0 (0.0%) | 0 (0.0%) |
| 5 to 17 Years | 4 (3.0%) | 0 (0.0%) |
| 18 to 34 Years | 0 (0.0%) | 0 (0.0%) |
| 35 to 64 Years | 50 (14.6%) | 5 (1.6%) |
| 65 to 74 Years | 7 (8.4%) | 6 (5.6%) |
| 75 Years and over | 17 (31.5%) | 6 (6.8%) |
Disability Class: Vision Difficulty
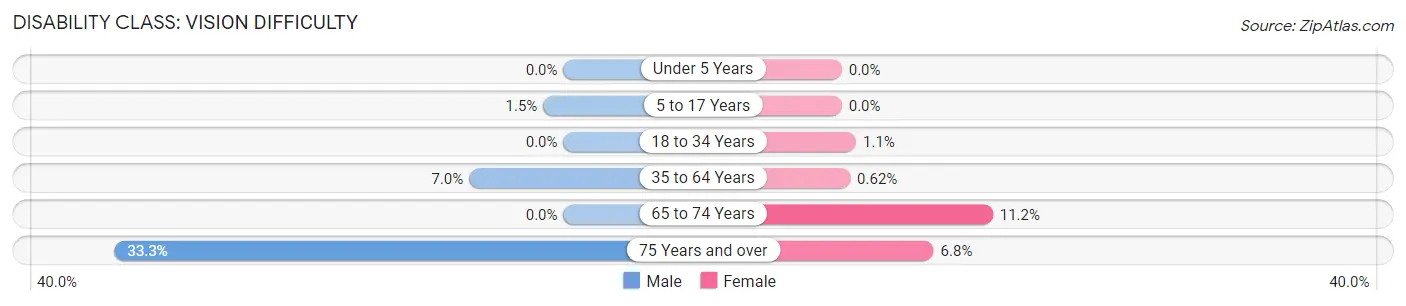
| Age Bracket | Male | Female |
| Under 5 Years | 0 (0.0%) | 0 (0.0%) |
| 5 to 17 Years | 2 (1.5%) | 0 (0.0%) |
| 18 to 34 Years | 0 (0.0%) | 2 (1.1%) |
| 35 to 64 Years | 24 (7.0%) | 2 (0.6%) |
| 65 to 74 Years | 0 (0.0%) | 12 (11.2%) |
| 75 Years and over | 18 (33.3%) | 6 (6.8%) |
Disability Class: Cognitive Difficulty
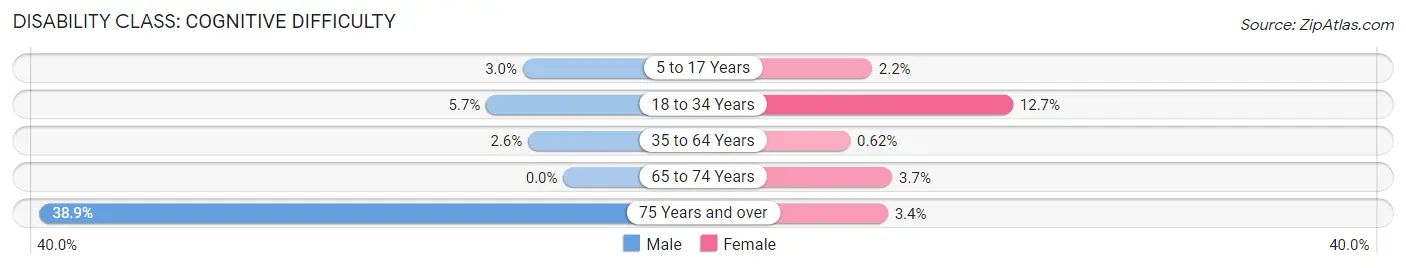
| Age Bracket | Male | Female |
| 5 to 17 Years | 4 (3.0%) | 4 (2.2%) |
| 18 to 34 Years | 11 (5.7%) | 24 (12.7%) |
| 35 to 64 Years | 9 (2.6%) | 2 (0.6%) |
| 65 to 74 Years | 0 (0.0%) | 4 (3.7%) |
| 75 Years and over | 21 (38.9%) | 3 (3.4%) |
Disability Class: Ambulatory Difficulty
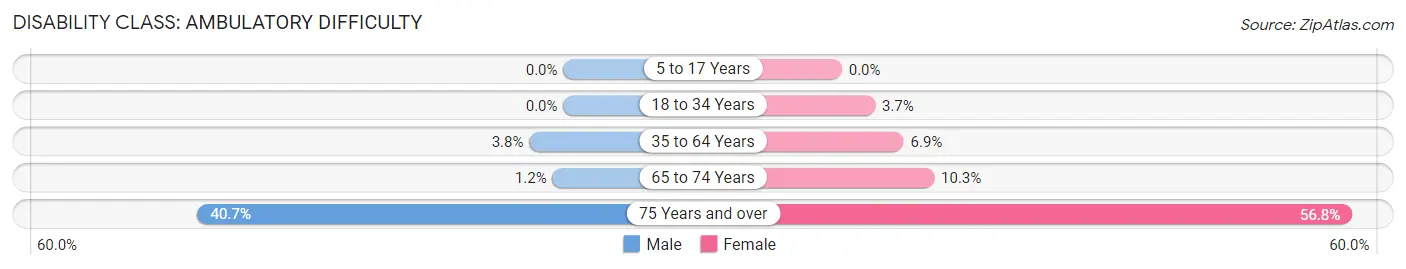
| Age Bracket | Male | Female |
| 5 to 17 Years | 0 (0.0%) | 0 (0.0%) |
| 18 to 34 Years | 0 (0.0%) | 7 (3.7%) |
| 35 to 64 Years | 13 (3.8%) | 22 (6.9%) |
| 65 to 74 Years | 1 (1.2%) | 11 (10.3%) |
| 75 Years and over | 22 (40.7%) | 50 (56.8%) |
Disability Class: Self-Care Difficulty
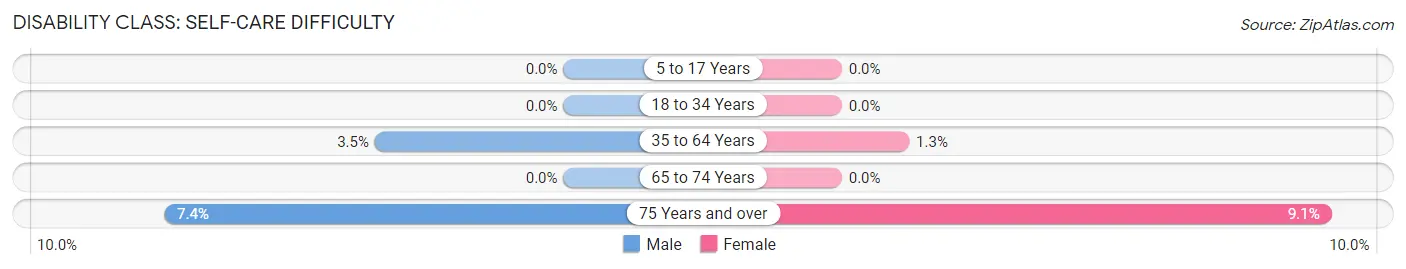
| Age Bracket | Male | Female |
| 5 to 17 Years | 0 (0.0%) | 0 (0.0%) |
| 18 to 34 Years | 0 (0.0%) | 0 (0.0%) |
| 35 to 64 Years | 12 (3.5%) | 4 (1.3%) |
| 65 to 74 Years | 0 (0.0%) | 0 (0.0%) |
| 75 Years and over | 4 (7.4%) | 8 (9.1%) |
Technology Access in Williamsport
Computing Device Access in Williamsport
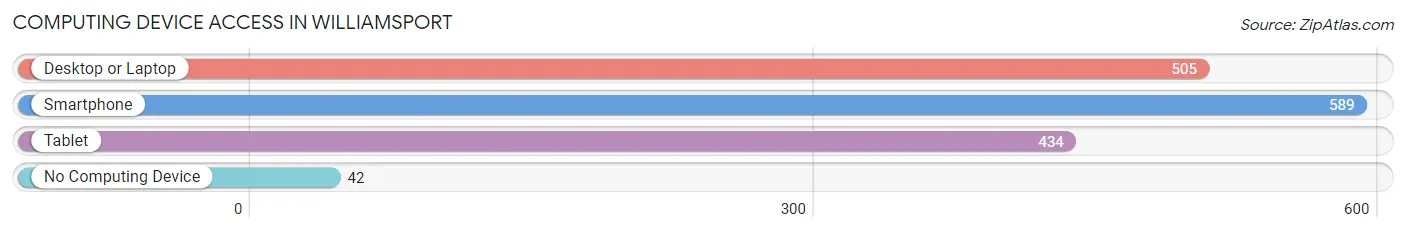
| Device Type | # Households | % Households |
| Desktop or Laptop | 505 | 73.9% |
| Smartphone | 589 | 86.2% |
| Tablet | 434 | 63.5% |
| No Computing Device | 42 | 6.1% |
| Total | 683 | 100.0% |
Internet Access in Williamsport
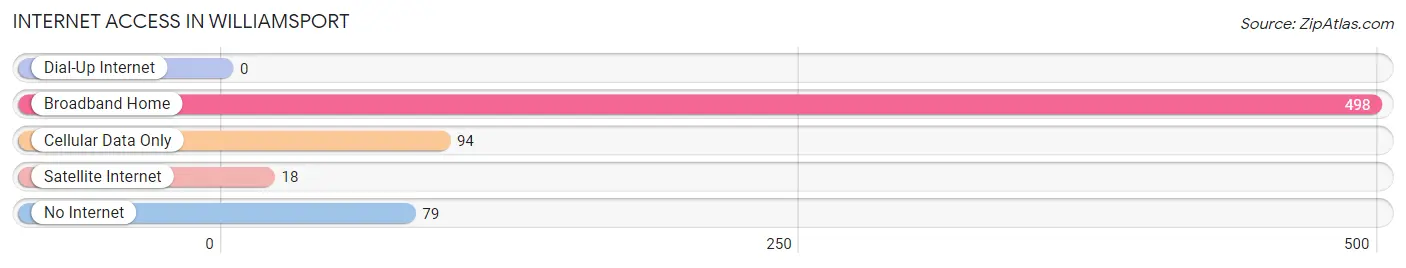
| Internet Type | # Households | % Households |
| Dial-Up Internet | 0 | 0.0% |
| Broadband Home | 498 | 72.9% |
| Cellular Data Only | 94 | 13.8% |
| Satellite Internet | 18 | 2.6% |
| No Internet | 79 | 11.6% |
| Total | 683 | 100.0% |
Williamsport Summary
Williamsport, Indiana is a small town located in Warren County, Indiana. It is situated on the banks of the Wabash River, approximately 30 miles northwest of Indianapolis. The town was founded in 1832 and has a population of approximately 1,500 people.
History
Williamsport was founded in 1832 by William Williams, a Quaker from North Carolina. He purchased the land from the government and named the town after himself. The town was originally a trading post and a stop on the Wabash and Erie Canal. The canal was a major transportation route for goods and people in the 19th century.
The town grew slowly but steadily over the years. In 1851, the first school was built and in 1853, the first church was established. The town was incorporated in 1867 and the first mayor was elected in 1868.
In the late 19th century, the town experienced a period of growth and prosperity. The Wabash and Erie Canal was replaced by the railroad, which brought more people and businesses to the area. The town also became a center for the lumber industry.
In the early 20th century, the town experienced a period of decline. The railroad was replaced by the automobile and the lumber industry declined. The town was hit hard by the Great Depression and many businesses closed.
Geography
Williamsport is located in Warren County, Indiana. It is situated on the banks of the Wabash River, approximately 30 miles northwest of Indianapolis. The town is surrounded by rolling hills and farmland. The climate is humid continental, with hot summers and cold winters.
Economy
The economy of Williamsport is largely based on agriculture. The town is home to several farms, which produce corn, soybeans, wheat, and other crops. The town also has a few small businesses, including a grocery store, a hardware store, and a few restaurants.
Demographics
As of the 2010 census, the population of Williamsport was 1,500. The racial makeup of the town was 97.3% White, 0.7% African American, 0.3% Native American, 0.3% Asian, and 1.3% from other races. The median household income was $37,500 and the median family income was $45,000. The per capita income was $18,000.
Conclusion
Williamsport, Indiana is a small town located in Warren County, Indiana. It was founded in 1832 and has a population of approximately 1,500 people. The town is situated on the banks of the Wabash River and is surrounded by rolling hills and farmland. The economy of Williamsport is largely based on agriculture and the town has a few small businesses. The racial makeup of the town is predominantly White, with a small percentage of African American, Native American, and Asian residents.
Common Questions
What is Per Capita Income in Williamsport?
Per Capita income in Williamsport is $31,660.
What is the Median Family Income in Williamsport?
Median Family Income in Williamsport is $69,655.
What is the Median Household income in Williamsport?
Median Household Income in Williamsport is $62,868.
What is Income or Wage Gap in Williamsport?
Income or Wage Gap in Williamsport is 43.1%.
Women in Williamsport earn 56.9 cents for every dollar earned by a man.
What is Family Income Deficit in Williamsport?
Family Income Deficit in Williamsport is $9,394.
Families that are below poverty line in Williamsport earn $9,394 less on average than the poverty threshold level.
What is Inequality or Gini Index in Williamsport?
Inequality or Gini Index in Williamsport is 0.42.
What is the Total Population of Williamsport?
Total Population of Williamsport is 1,847.
What is the Total Male Population of Williamsport?
Total Male Population of Williamsport is 866.
What is the Total Female Population of Williamsport?
Total Female Population of Williamsport is 981.
What is the Ratio of Males per 100 Females in Williamsport?
There are 88.28 Males per 100 Females in Williamsport.
What is the Ratio of Females per 100 Males in Williamsport?
There are 113.28 Females per 100 Males in Williamsport.
What is the Median Population Age in Williamsport?
Median Population Age in Williamsport is 43.1 Years.
What is the Average Family Size in Williamsport
Average Family Size in Williamsport is 2.9 People.
What is the Average Household Size in Williamsport
Average Household Size in Williamsport is 2.6 People.
How Large is the Labor Force in Williamsport?
There are 921 People in the Labor Forcein in Williamsport.
What is the Percentage of People in the Labor Force in Williamsport?
60.3% of People are in the Labor Force in Williamsport.
What is the Unemployment Rate in Williamsport?
Unemployment Rate in Williamsport is 1.2%.