West Lebanon, IN Map & Demographics
West Lebanon Map
West Lebanon Overview
$35,100
PER CAPITA INCOME
$100,833
AVG FAMILY INCOME
$74,500
AVG HOUSEHOLD INCOME
35.9%
WAGE / INCOME GAP [ % ]
64.1¢/ $1
WAGE / INCOME GAP [ $ ]
0.34
INEQUALITY / GINI INDEX
773
TOTAL POPULATION
360
MALE POPULATION
413
FEMALE POPULATION
87.17
MALES / 100 FEMALES
114.72
FEMALES / 100 MALES
53.1
MEDIAN AGE
2.9
AVG FAMILY SIZE
2.3
AVG HOUSEHOLD SIZE
414
LABOR FORCE [ PEOPLE ]
58.7%
PERCENT IN LABOR FORCE
12.6%
UNEMPLOYMENT RATE
West Lebanon Zip Codes
West Lebanon Area Codes
Income in West Lebanon
Income Overview in West Lebanon
Per Capita Income in West Lebanon is $35,100, while median incomes of families and households are $100,833 and $74,500 respectively.
| Characteristic | Number | Measure |
| Per Capita Income | 773 | $35,100 |
| Median Family Income | 216 | $100,833 |
| Mean Family Income | 216 | $96,891 |
| Median Household Income | 330 | $74,500 |
| Mean Household Income | 330 | $79,890 |
| Income Deficit | 216 | $0 |
| Wage / Income Gap (%) | 773 | 35.88% |
| Wage / Income Gap ($) | 773 | 64.12¢ per $1 |
| Gini / Inequality Index | 773 | 0.34 |
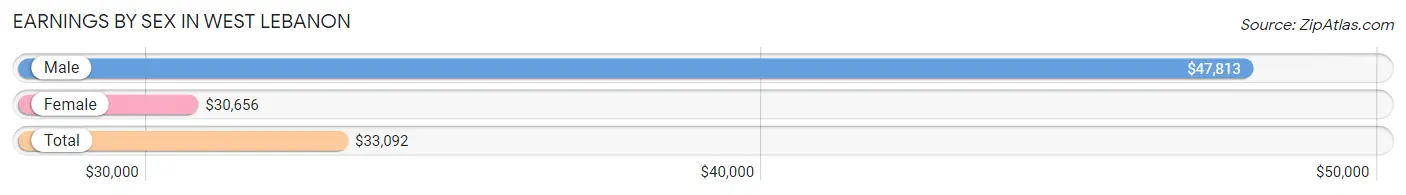
Earnings by Sex in West Lebanon
Average Earnings in West Lebanon are $33,092, $47,813 for men and $30,656 for women, a difference of 35.9%.
| Sex | Number | Average Earnings |
| Male | 241 (52.2%) | $47,813 |
| Female | 221 (47.8%) | $30,656 |
| Total | 462 (100.0%) | $33,092 |
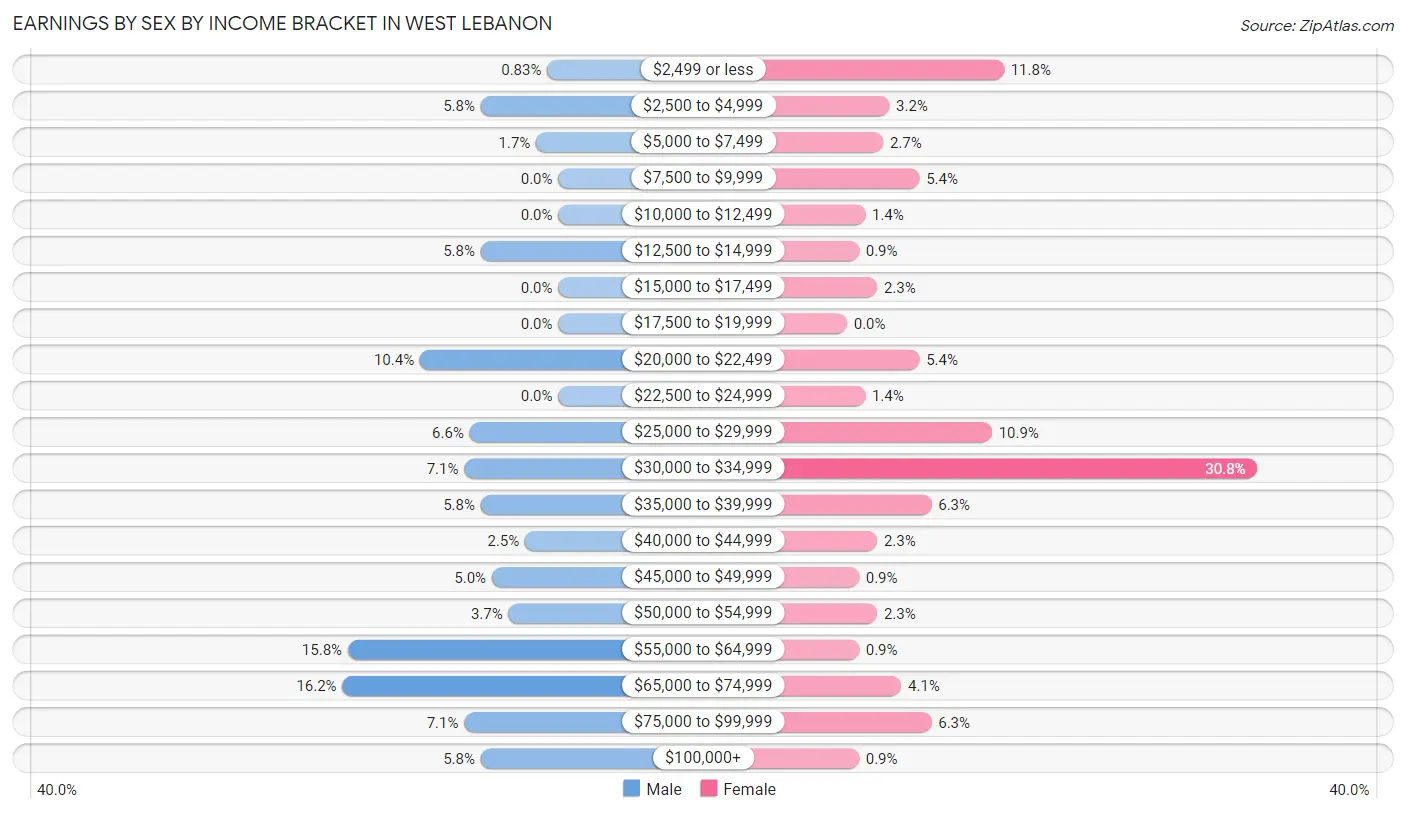
Earnings by Sex by Income Bracket in West Lebanon
The most common earnings brackets in West Lebanon are $65,000 to $74,999 for men (39 | 16.2%) and $30,000 to $34,999 for women (68 | 30.8%).
| Income | Male | Female |
| $2,499 or less | 2 (0.8%) | 26 (11.8%) |
| $2,500 to $4,999 | 14 (5.8%) | 7 (3.2%) |
| $5,000 to $7,499 | 4 (1.7%) | 6 (2.7%) |
| $7,500 to $9,999 | 0 (0.0%) | 12 (5.4%) |
| $10,000 to $12,499 | 0 (0.0%) | 3 (1.4%) |
| $12,500 to $14,999 | 14 (5.8%) | 2 (0.9%) |
| $15,000 to $17,499 | 0 (0.0%) | 5 (2.3%) |
| $17,500 to $19,999 | 0 (0.0%) | 0 (0.0%) |
| $20,000 to $22,499 | 25 (10.4%) | 12 (5.4%) |
| $22,500 to $24,999 | 0 (0.0%) | 3 (1.4%) |
| $25,000 to $29,999 | 16 (6.6%) | 24 (10.9%) |
| $30,000 to $34,999 | 17 (7.0%) | 68 (30.8%) |
| $35,000 to $39,999 | 14 (5.8%) | 14 (6.3%) |
| $40,000 to $44,999 | 6 (2.5%) | 5 (2.3%) |
| $45,000 to $49,999 | 12 (5.0%) | 2 (0.9%) |
| $50,000 to $54,999 | 9 (3.7%) | 5 (2.3%) |
| $55,000 to $64,999 | 38 (15.8%) | 2 (0.9%) |
| $65,000 to $74,999 | 39 (16.2%) | 9 (4.1%) |
| $75,000 to $99,999 | 17 (7.0%) | 14 (6.3%) |
| $100,000+ | 14 (5.8%) | 2 (0.9%) |
| Total | 241 (100.0%) | 221 (100.0%) |
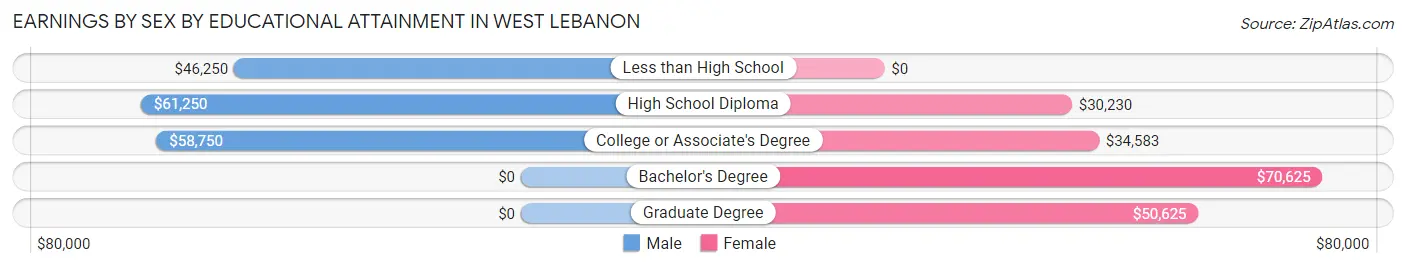
Earnings by Sex by Educational Attainment in West Lebanon
Average earnings in West Lebanon are $59,013 for men and $31,688 for women, a difference of 46.3%. Men with an educational attainment of high school diploma enjoy the highest average annual earnings of $61,250, while those with less than high school education earn the least with $46,250. Women with an educational attainment of bachelor's degree earn the most with the average annual earnings of $70,625, while those with high school diploma education have the smallest earnings of $30,230.
| Educational Attainment | Male Income | Female Income |
| Less than High School | $46,250 | $0 |
| High School Diploma | $61,250 | $30,230 |
| College or Associate's Degree | $58,750 | $34,583 |
| Bachelor's Degree | - | - |
| Graduate Degree | - | - |
| Total | $59,013 | $31,688 |
Family Income in West Lebanon
Family Income Brackets in West Lebanon
According to the West Lebanon family income data, there are 101 families falling into the $100,000 to $149,999 income range, which is the most common income bracket and makes up 46.8% of all families.
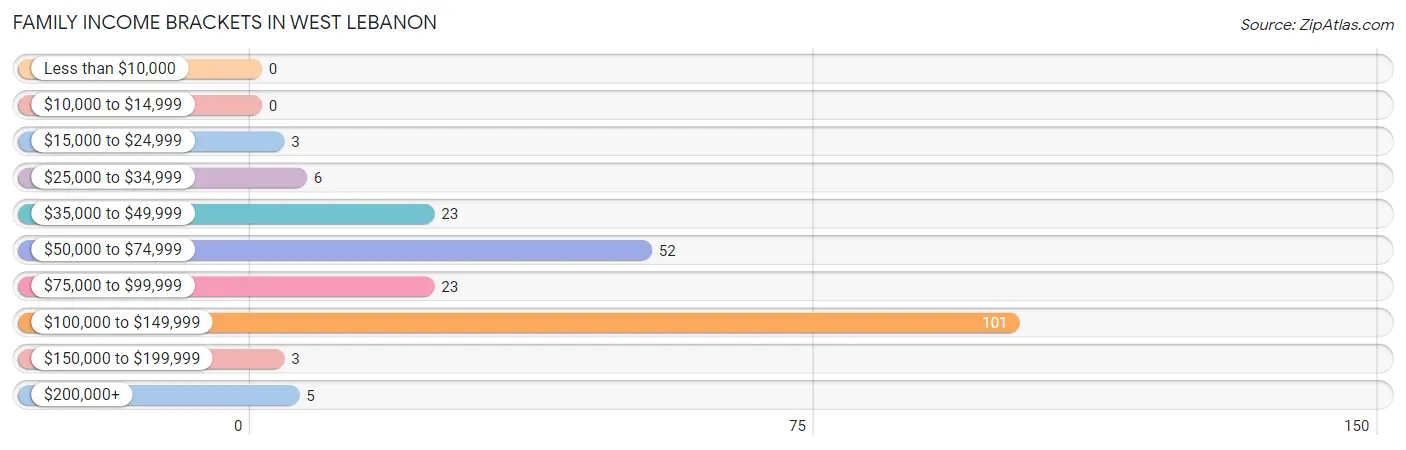
| Income Bracket | # Families | % Families |
| Less than $10,000 | 0 | 0.0% |
| $10,000 to $14,999 | 0 | 0.0% |
| $15,000 to $24,999 | 3 | 1.4% |
| $25,000 to $34,999 | 6 | 2.8% |
| $35,000 to $49,999 | 23 | 10.6% |
| $50,000 to $74,999 | 52 | 24.1% |
| $75,000 to $99,999 | 23 | 10.6% |
| $100,000 to $149,999 | 101 | 46.8% |
| $150,000 to $199,999 | 3 | 1.4% |
| $200,000+ | 5 | 2.3% |
Family Income by Famaliy Size in West Lebanon
4-person families (33 | 15.3%) account for the highest median family income in West Lebanon with $111,641 per family, while 2-person families (120 | 55.6%) have the highest median income of $37,375 per family member.
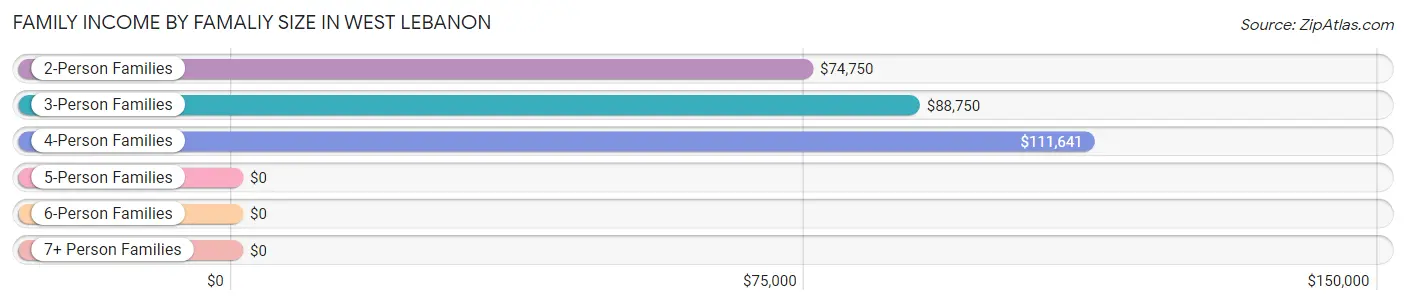
| Income Bracket | # Families | Median Income |
| 2-Person Families | 120 (55.6%) | $74,750 |
| 3-Person Families | 52 (24.1%) | $88,750 |
| 4-Person Families | 33 (15.3%) | $111,641 |
| 5-Person Families | 7 (3.2%) | $0 |
| 6-Person Families | 4 (1.8%) | $0 |
| 7+ Person Families | 0 (0.0%) | $0 |
| Total | 216 (100.0%) | $100,833 |
Family Income by Number of Earners in West Lebanon
The median family income in West Lebanon is $100,833, with families comprising 2 earners (99) having the highest median family income of $135,230, while families with no earners (26) have the lowest median family income of $51,389, accounting for 45.8% and 12.0% of families, respectively.
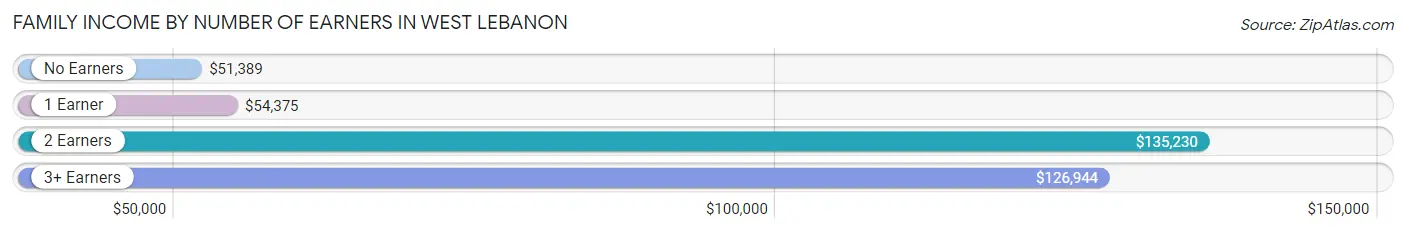
| Number of Earners | # Families | Median Income |
| No Earners | 26 (12.0%) | $51,389 |
| 1 Earner | 69 (31.9%) | $54,375 |
| 2 Earners | 99 (45.8%) | $135,230 |
| 3+ Earners | 22 (10.2%) | $126,944 |
| Total | 216 (100.0%) | $100,833 |
Household Income in West Lebanon
Household Income Brackets in West Lebanon
With 105 households falling in the category, the $100,000 to $149,999 income range is the most frequent in West Lebanon, accounting for 31.8% of all households. In contrast, only 4 households (1.2%) fall into the less than $10,000 income bracket, making it the least populous group.
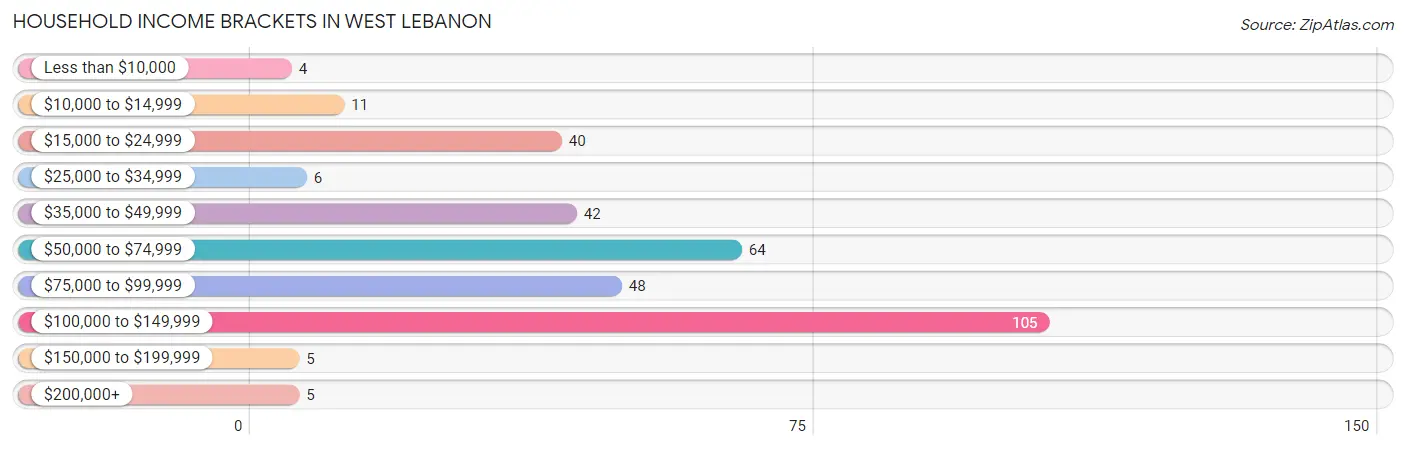
| Income Bracket | # Households | % Households |
| Less than $10,000 | 4 | 1.2% |
| $10,000 to $14,999 | 11 | 3.3% |
| $15,000 to $24,999 | 40 | 12.1% |
| $25,000 to $34,999 | 6 | 1.8% |
| $35,000 to $49,999 | 42 | 12.7% |
| $50,000 to $74,999 | 64 | 19.4% |
| $75,000 to $99,999 | 48 | 14.5% |
| $100,000 to $149,999 | 105 | 31.8% |
| $150,000 to $199,999 | 5 | 1.5% |
| $200,000+ | 5 | 1.5% |
Household Income by Householder Age in West Lebanon
The median household income in West Lebanon is $74,500, with the highest median household income of $76,875 found in the 25 to 44 years age bracket for the primary householder. A total of 68 households (20.6%) fall into this category. Meanwhile, the 15 to 24 years age bracket for the primary householder has the lowest median household income of $0, with 9 households (2.7%) in this group.
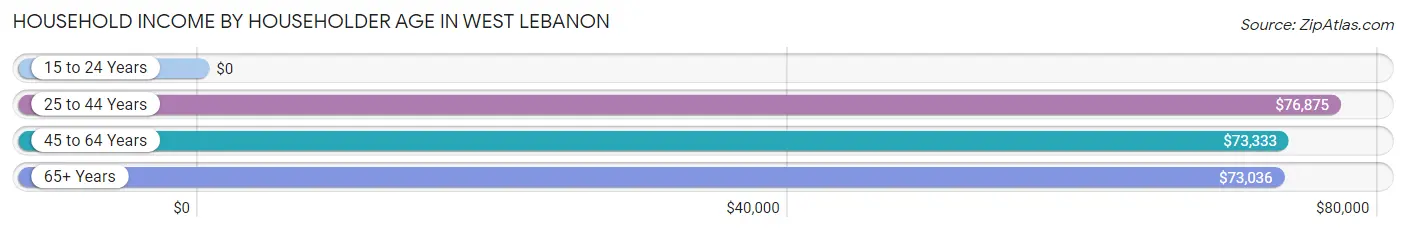
| Income Bracket | # Households | Median Income |
| 15 to 24 Years | 9 (2.7%) | $0 |
| 25 to 44 Years | 68 (20.6%) | $76,875 |
| 45 to 64 Years | 86 (26.1%) | $73,333 |
| 65+ Years | 167 (50.6%) | $73,036 |
| Total | 330 (100.0%) | $74,500 |
Poverty in West Lebanon
Income Below Poverty by Sex and Age in West Lebanon
With 2.5% poverty level for males and 3.6% for females among the residents of West Lebanon, 55 to 64 year old males and 18 to 24 year old females are the most vulnerable to poverty, with 4 males (16.7%) and 3 females (14.3%) in their respective age groups living below the poverty level.
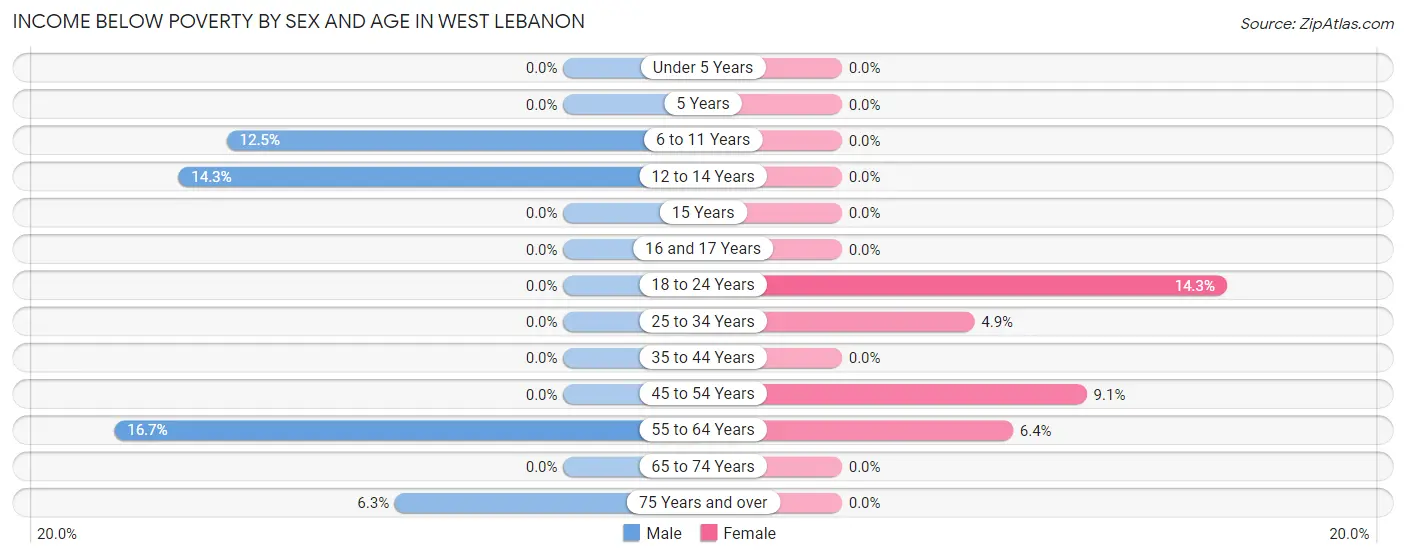
| Age Bracket | Male | Female |
| Under 5 Years | 0 (0.0%) | 0 (0.0%) |
| 5 Years | 0 (0.0%) | 0 (0.0%) |
| 6 to 11 Years | 1 (12.5%) | 0 (0.0%) |
| 12 to 14 Years | 2 (14.3%) | 0 (0.0%) |
| 15 Years | 0 (0.0%) | 0 (0.0%) |
| 16 and 17 Years | 0 (0.0%) | 0 (0.0%) |
| 18 to 24 Years | 0 (0.0%) | 3 (14.3%) |
| 25 to 34 Years | 0 (0.0%) | 3 (4.9%) |
| 35 to 44 Years | 0 (0.0%) | 0 (0.0%) |
| 45 to 54 Years | 0 (0.0%) | 5 (9.1%) |
| 55 to 64 Years | 4 (16.7%) | 4 (6.4%) |
| 65 to 74 Years | 0 (0.0%) | 0 (0.0%) |
| 75 Years and over | 2 (6.2%) | 0 (0.0%) |
| Total | 9 (2.5%) | 15 (3.6%) |
Income Above Poverty by Sex and Age in West Lebanon
According to the poverty statistics in West Lebanon, males aged under 5 years and females aged under 5 years are the age groups that are most secure financially, with 100.0% of males and 100.0% of females in these age groups living above the poverty line.
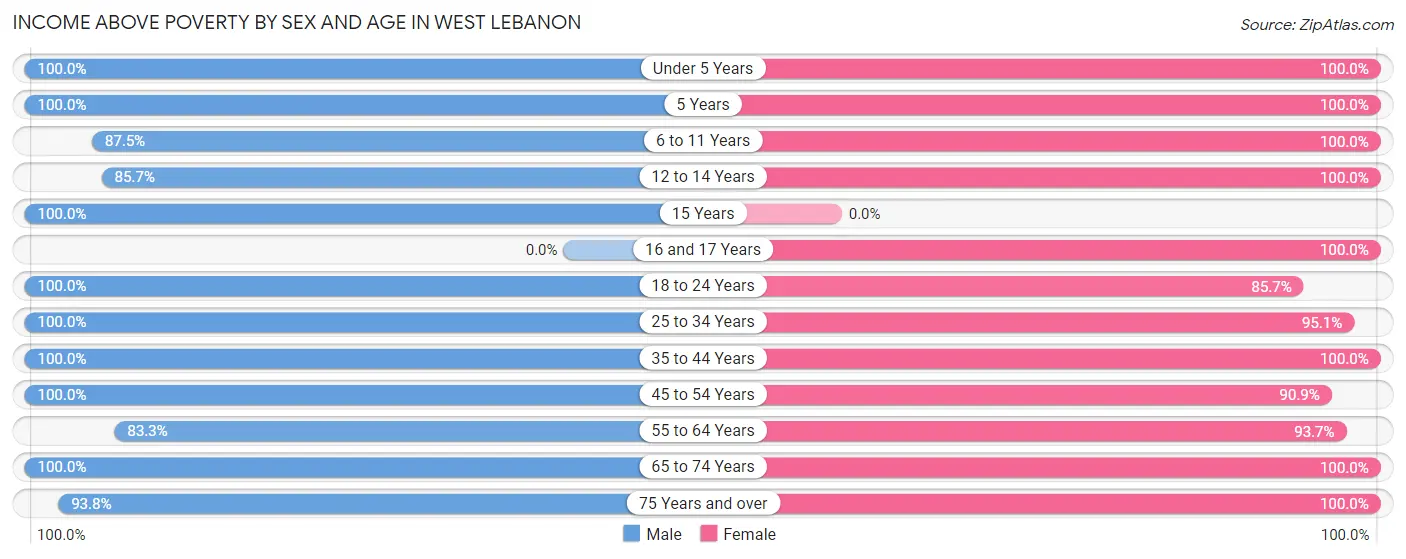
| Age Bracket | Male | Female |
| Under 5 Years | 15 (100.0%) | 12 (100.0%) |
| 5 Years | 6 (100.0%) | 3 (100.0%) |
| 6 to 11 Years | 7 (87.5%) | 2 (100.0%) |
| 12 to 14 Years | 12 (85.7%) | 3 (100.0%) |
| 15 Years | 5 (100.0%) | 0 (0.0%) |
| 16 and 17 Years | 0 (0.0%) | 23 (100.0%) |
| 18 to 24 Years | 81 (100.0%) | 18 (85.7%) |
| 25 to 34 Years | 40 (100.0%) | 58 (95.1%) |
| 35 to 44 Years | 10 (100.0%) | 7 (100.0%) |
| 45 to 54 Years | 34 (100.0%) | 50 (90.9%) |
| 55 to 64 Years | 20 (83.3%) | 59 (93.6%) |
| 65 to 74 Years | 91 (100.0%) | 68 (100.0%) |
| 75 Years and over | 30 (93.8%) | 95 (100.0%) |
| Total | 351 (97.5%) | 398 (96.4%) |
Income Below Poverty Among Married-Couple Families in West Lebanon
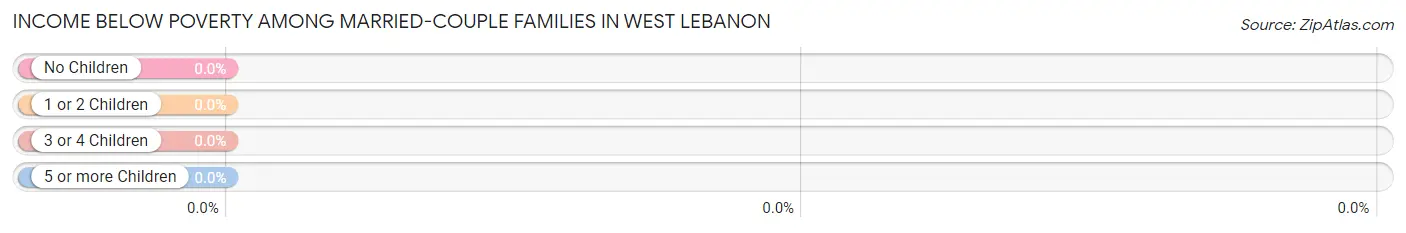
| Children | Above Poverty | Below Poverty |
| No Children | 131 (100.0%) | 0 (0.0%) |
| 1 or 2 Children | 35 (100.0%) | 0 (0.0%) |
| 3 or 4 Children | 9 (100.0%) | 0 (0.0%) |
| 5 or more Children | 0 (0.0%) | 0 (0.0%) |
| Total | 175 (100.0%) | 0 (0.0%) |
Income Below Poverty Among Single-Parent Households in West Lebanon
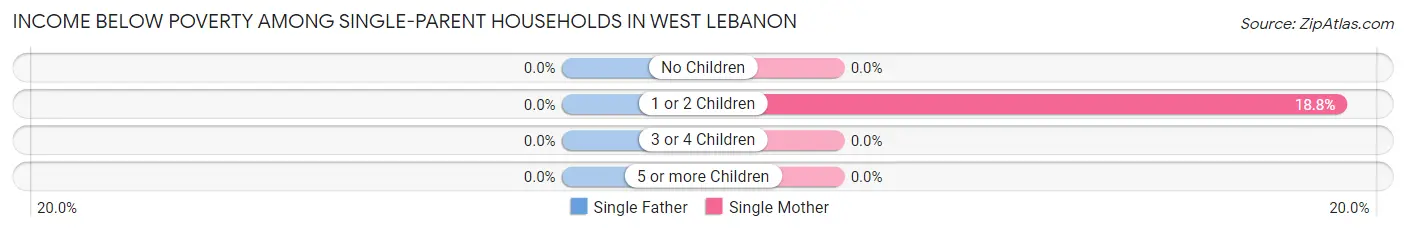
| Children | Single Father | Single Mother |
| No Children | 0 (0.0%) | 0 (0.0%) |
| 1 or 2 Children | 0 (0.0%) | 3 (18.8%) |
| 3 or 4 Children | 0 (0.0%) | 0 (0.0%) |
| 5 or more Children | 0 (0.0%) | 0 (0.0%) |
| Total | 0 (0.0%) | 3 (9.1%) |
Income Below Poverty Among Married-Couple vs Single-Parent Households in West Lebanon
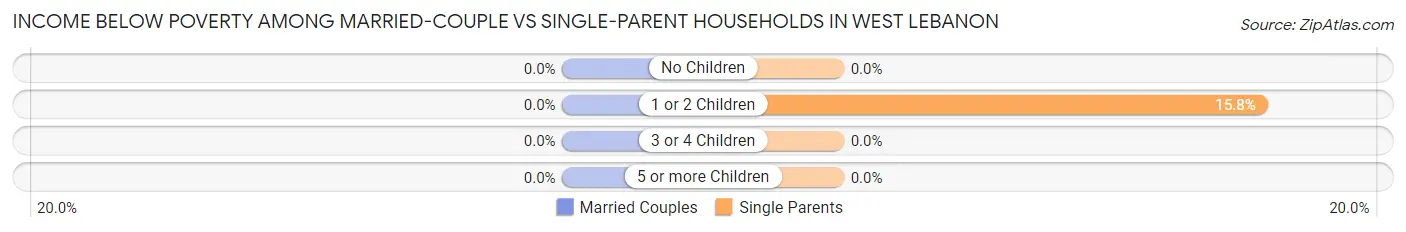
| Children | Married-Couple Families | Single-Parent Households |
| No Children | 0 (0.0%) | 0 (0.0%) |
| 1 or 2 Children | 0 (0.0%) | 3 (15.8%) |
| 3 or 4 Children | 0 (0.0%) | 0 (0.0%) |
| 5 or more Children | 0 (0.0%) | 0 (0.0%) |
| Total | 0 (0.0%) | 3 (7.3%) |
Race in West Lebanon
The most populous races in West Lebanon are White / Caucasian (766 | 99.1%), Hispanic or Latino (7 | 0.9%), and Two or more Races (4 | 0.5%).
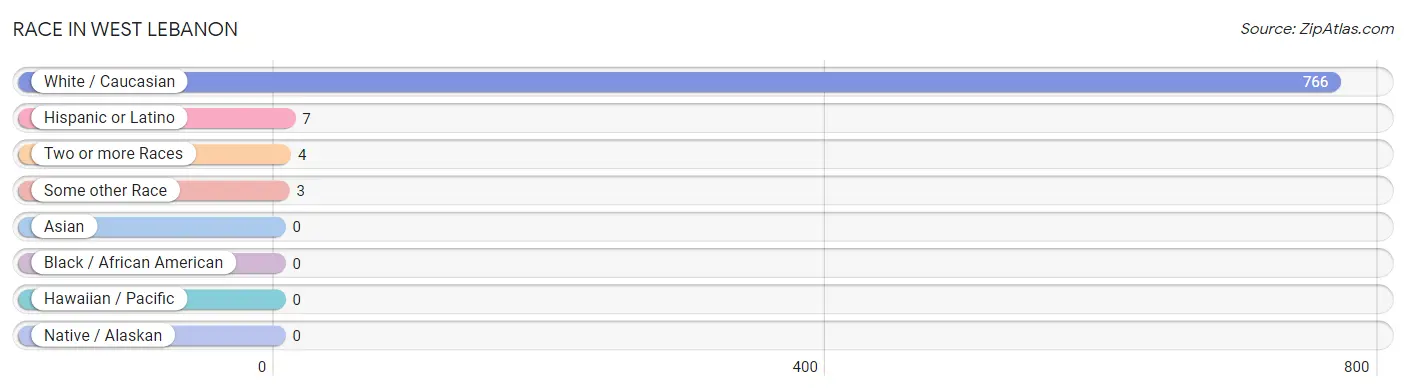
| Race | # Population | % Population |
| Asian | 0 | 0.0% |
| Black / African American | 0 | 0.0% |
| Hawaiian / Pacific | 0 | 0.0% |
| Hispanic or Latino | 7 | 0.9% |
| Native / Alaskan | 0 | 0.0% |
| White / Caucasian | 766 | 99.1% |
| Two or more Races | 4 | 0.5% |
| Some other Race | 3 | 0.4% |
| Total | 773 | 100.0% |
Ancestry in West Lebanon
The most populous ancestries reported in West Lebanon are English (116 | 15.0%), German (110 | 14.2%), Swedish (79 | 10.2%), American (73 | 9.4%), and Scottish (70 | 9.1%), together accounting for 58.0% of all West Lebanon residents.
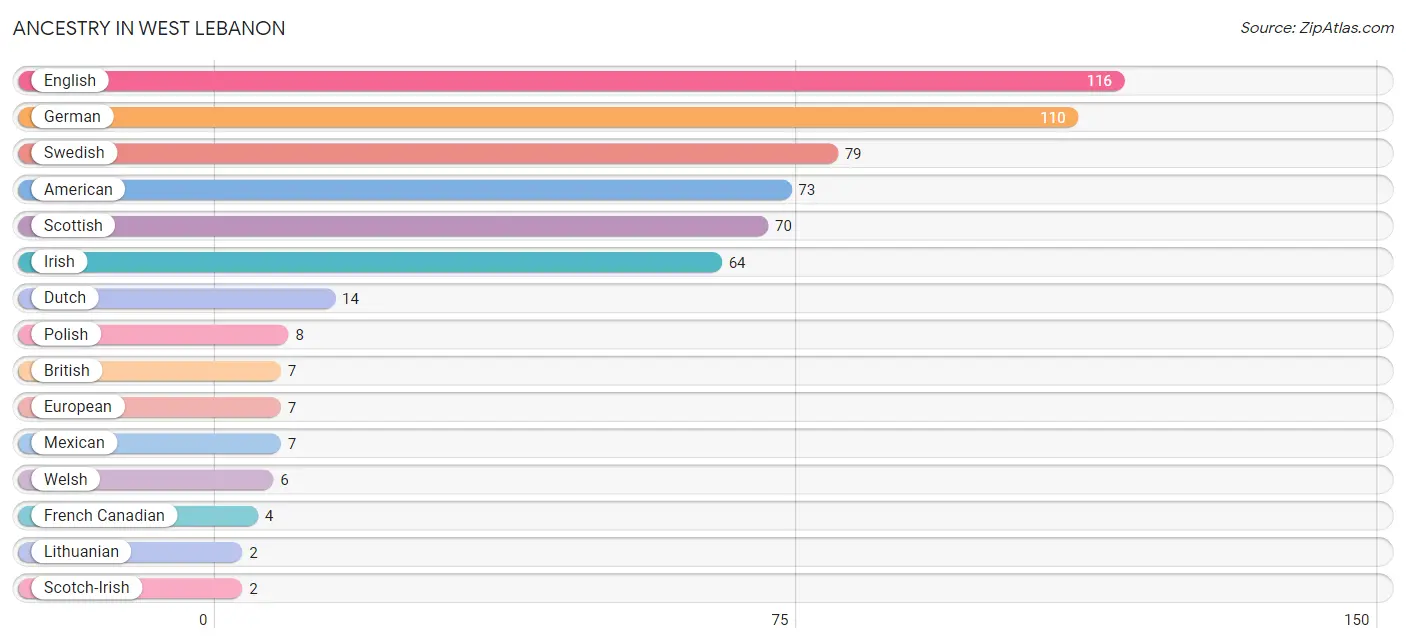
| Ancestry | # Population | % Population |
| American | 73 | 9.4% |
| British | 7 | 0.9% |
| Dutch | 14 | 1.8% |
| English | 116 | 15.0% |
| European | 7 | 0.9% |
| French | 1 | 0.1% |
| French Canadian | 4 | 0.5% |
| German | 110 | 14.2% |
| Irish | 64 | 8.3% |
| Lithuanian | 2 | 0.3% |
| Mexican | 7 | 0.9% |
| Polish | 8 | 1.0% |
| Scotch-Irish | 2 | 0.3% |
| Scottish | 70 | 9.1% |
| Swedish | 79 | 10.2% |
| Welsh | 6 | 0.8% | View All 16 Rows |
Immigrants in West Lebanon
The most numerous immigrant groups reported in West Lebanon came from Europe (2 | 0.3%), Germany (2 | 0.3%), and Western Europe (2 | 0.3%), together accounting for 0.8% of all West Lebanon residents.
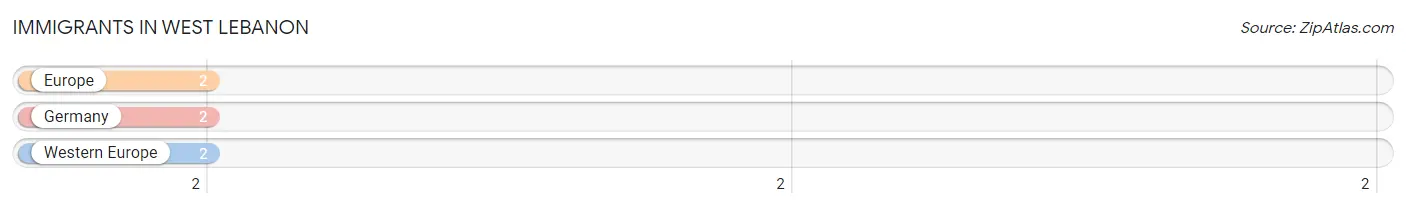
| Immigration Origin | # Population | % Population |
| Europe | 2 | 0.3% |
| Germany | 2 | 0.3% |
| Western Europe | 2 | 0.3% | View All 3 Rows |
Sex and Age in West Lebanon
Sex and Age in West Lebanon
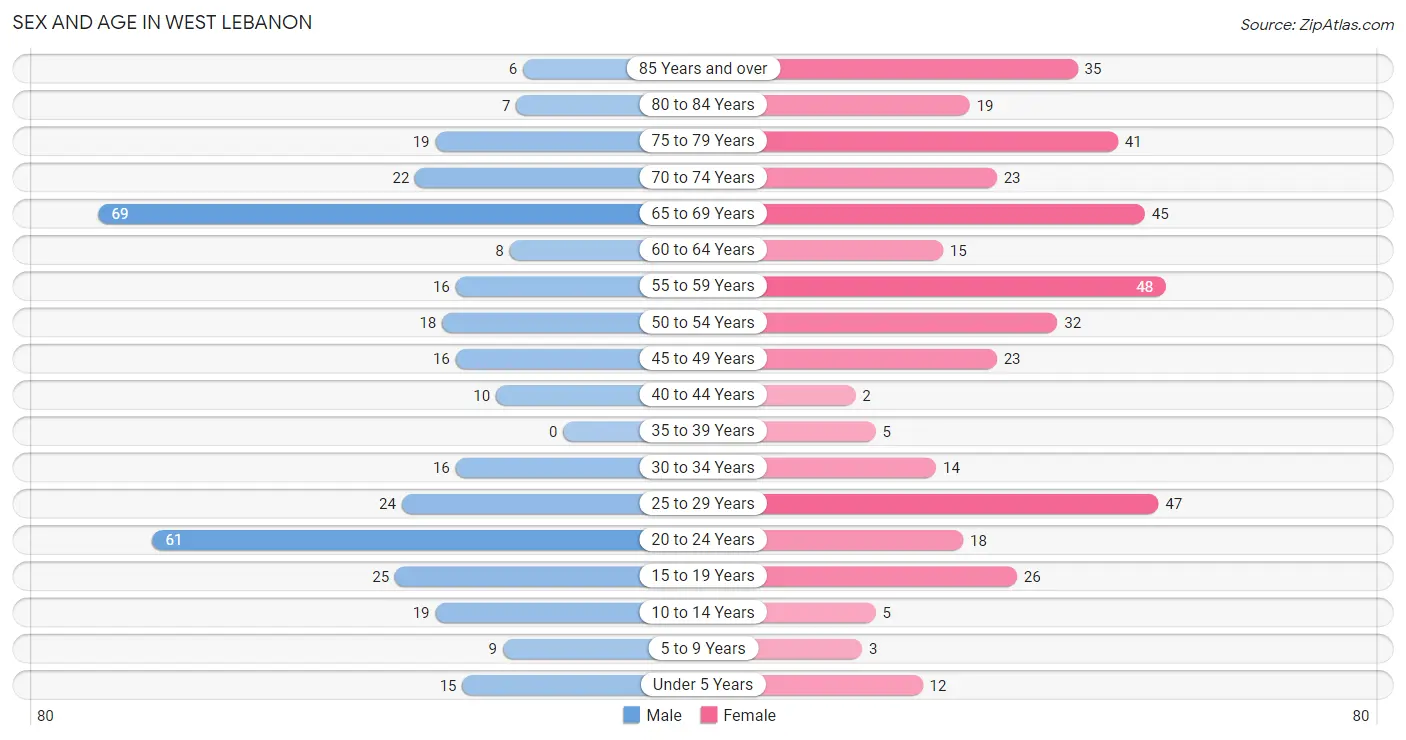
The most populous age groups in West Lebanon are 65 to 69 Years (69 | 19.2%) for men and 55 to 59 Years (48 | 11.6%) for women.
| Age Bracket | Male | Female |
| Under 5 Years | 15 (4.2%) | 12 (2.9%) |
| 5 to 9 Years | 9 (2.5%) | 3 (0.7%) |
| 10 to 14 Years | 19 (5.3%) | 5 (1.2%) |
| 15 to 19 Years | 25 (6.9%) | 26 (6.3%) |
| 20 to 24 Years | 61 (16.9%) | 18 (4.4%) |
| 25 to 29 Years | 24 (6.7%) | 47 (11.4%) |
| 30 to 34 Years | 16 (4.4%) | 14 (3.4%) |
| 35 to 39 Years | 0 (0.0%) | 5 (1.2%) |
| 40 to 44 Years | 10 (2.8%) | 2 (0.5%) |
| 45 to 49 Years | 16 (4.4%) | 23 (5.6%) |
| 50 to 54 Years | 18 (5.0%) | 32 (7.7%) |
| 55 to 59 Years | 16 (4.4%) | 48 (11.6%) |
| 60 to 64 Years | 8 (2.2%) | 15 (3.6%) |
| 65 to 69 Years | 69 (19.2%) | 45 (10.9%) |
| 70 to 74 Years | 22 (6.1%) | 23 (5.6%) |
| 75 to 79 Years | 19 (5.3%) | 41 (9.9%) |
| 80 to 84 Years | 7 (1.9%) | 19 (4.6%) |
| 85 Years and over | 6 (1.7%) | 35 (8.5%) |
| Total | 360 (100.0%) | 413 (100.0%) |
Families and Households in West Lebanon
Median Family Size in West Lebanon
The median family size in West Lebanon is 2.87 persons per family, with single female/mother families (33 | 15.3%) accounting for the largest median family size of 3.09 persons per family. On the other hand, single male/father families (8 | 3.7%) represent the smallest median family size with 1.88 persons per family.
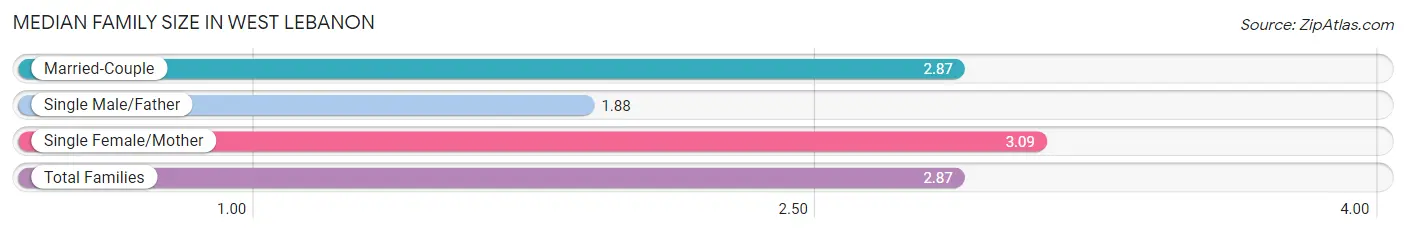
| Family Type | # Families | Family Size |
| Married-Couple | 175 (81.0%) | 2.87 |
| Single Male/Father | 8 (3.7%) | 1.88 |
| Single Female/Mother | 33 (15.3%) | 3.09 |
| Total Families | 216 (100.0%) | 2.87 |
Median Household Size in West Lebanon
The median household size in West Lebanon is 2.34 persons per household, with single female/mother households (33 | 10.0%) accounting for the largest median household size of 3.12 persons per household. non-family households (114 | 34.5%) represent the smallest median household size with 1.31 persons per household.
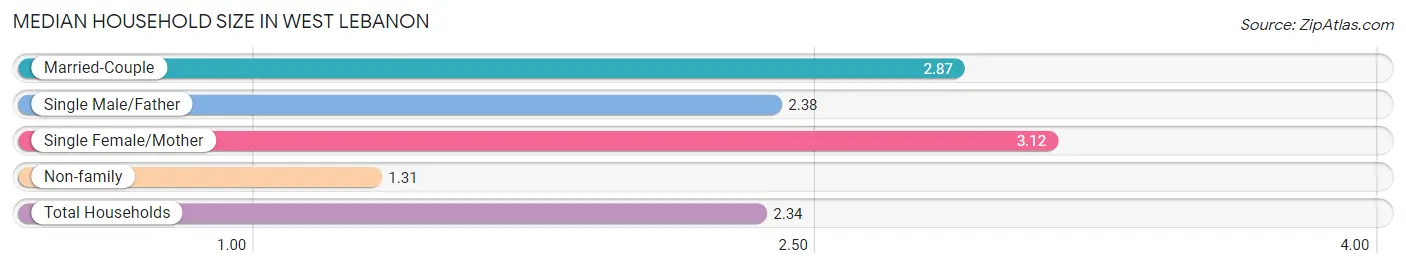
| Household Type | # Households | Household Size |
| Married-Couple | 175 (53.0%) | 2.87 |
| Single Male/Father | 8 (2.4%) | 2.38 |
| Single Female/Mother | 33 (10.0%) | 3.12 |
| Non-family | 114 (34.5%) | 1.31 |
| Total Households | 330 (100.0%) | 2.34 |
Household Size by Marriage Status in West Lebanon
Out of a total of 330 households in West Lebanon, 216 (65.4%) are family households, while 114 (34.5%) are nonfamily households. The most numerous type of family households are 2-person households, comprising 116, and the most common type of nonfamily households are 1-person households, comprising 89.
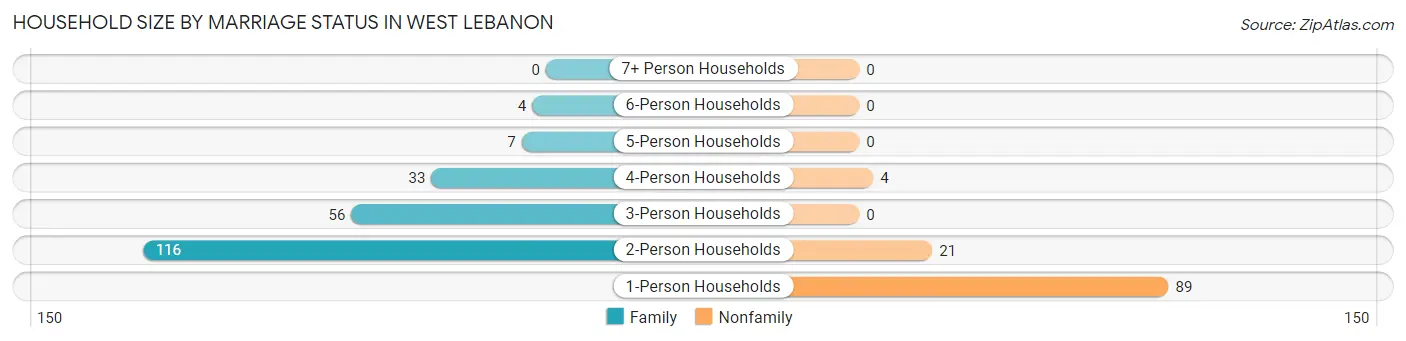
| Household Size | Family Households | Nonfamily Households |
| 1-Person Households | - | 89 (27.0%) |
| 2-Person Households | 116 (35.1%) | 21 (6.4%) |
| 3-Person Households | 56 (17.0%) | 0 (0.0%) |
| 4-Person Households | 33 (10.0%) | 4 (1.2%) |
| 5-Person Households | 7 (2.1%) | 0 (0.0%) |
| 6-Person Households | 4 (1.2%) | 0 (0.0%) |
| 7+ Person Households | 0 (0.0%) | 0 (0.0%) |
| Total | 216 (65.4%) | 114 (34.5%) |
Female Fertility in West Lebanon
Fertility by Age in West Lebanon
Average fertility rate in West Lebanon is 82.0 births per 1,000 women. Women in the age bracket of 20 to 34 years have the highest fertility rate with 165.0 births per 1,000 women. Women in the age bracket of 20 to 34 years acount for 100.0% of all women with births.
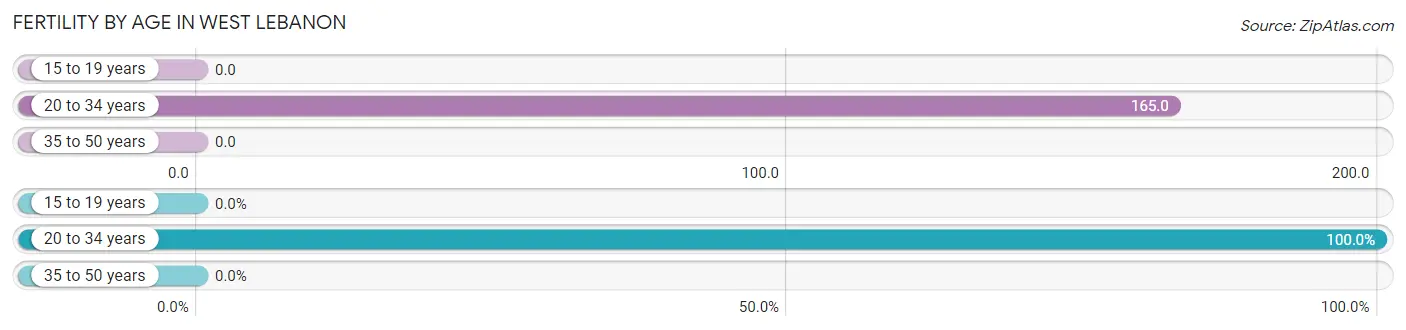
| Age Bracket | Women with Births | Births / 1,000 Women |
| 15 to 19 years | 0 (0.0%) | 0.0 |
| 20 to 34 years | 13 (100.0%) | 165.0 |
| 35 to 50 years | 0 (0.0%) | 0.0 |
| Total | 13 (100.0%) | 82.0 |
Fertility by Age by Marriage Status in West Lebanon
76.9% of women with births (13) in West Lebanon are married. The highest percentage of unmarried women with births falls into 20 to 34 years age bracket with 23.1% of them unmarried at the time of birth, while the lowest percentage of unmarried women with births belong to 20 to 34 years age bracket with 23.1% of them unmarried.
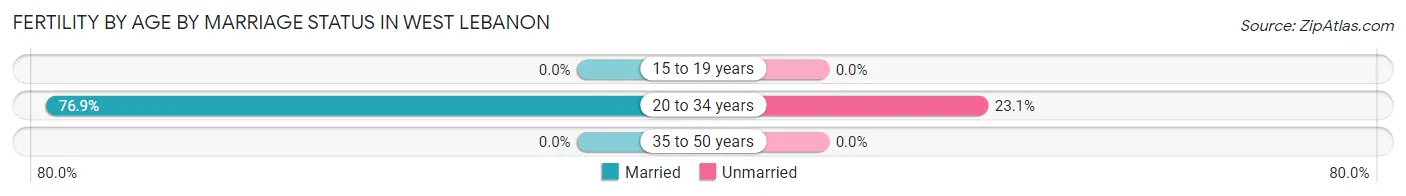
| Age Bracket | Married | Unmarried |
| 15 to 19 years | 0 (0.0%) | 0 (0.0%) |
| 20 to 34 years | 10 (76.9%) | 3 (23.1%) |
| 35 to 50 years | 0 (0.0%) | 0 (0.0%) |
| Total | 10 (76.9%) | 3 (23.1%) |
Fertility by Education in West Lebanon
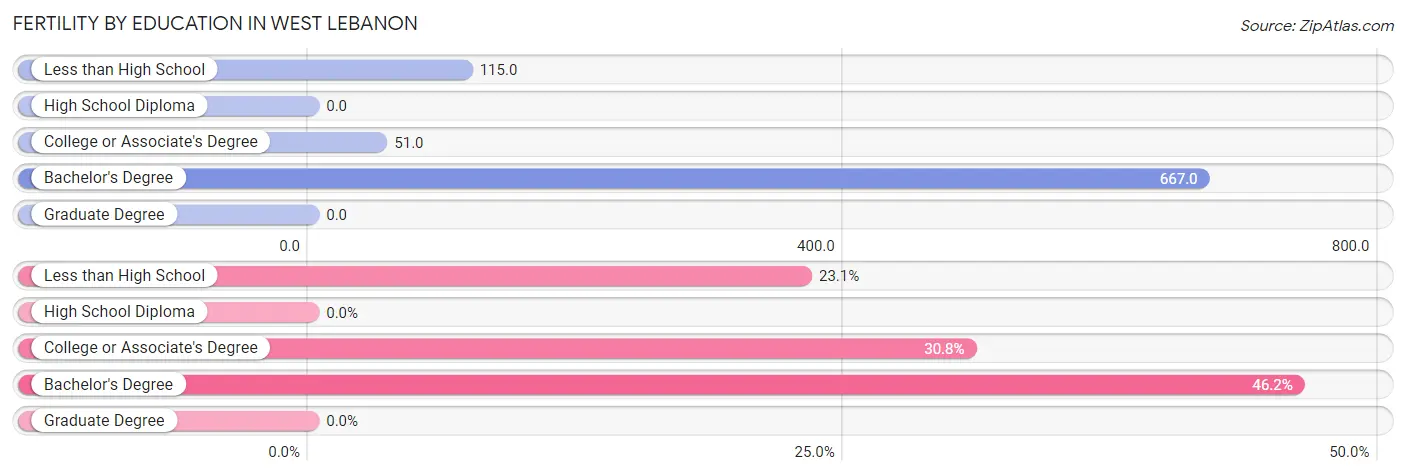
| Educational Attainment | Women with Births | Births / 1,000 Women |
| Less than High School | 3 (23.1%) | 115.0 |
| High School Diploma | 0 (0.0%) | 0.0 |
| College or Associate's Degree | 4 (30.8%) | 51.0 |
| Bachelor's Degree | 6 (46.2%) | 667.0 |
| Graduate Degree | 0 (0.0%) | 0.0 |
| Total | 13 (100.0%) | 82.0 |
Fertility by Education by Marriage Status in West Lebanon
23.1% of women with births in West Lebanon are unmarried. Women with the educational attainment of college or associate's degree are most likely to be married with 100.0% of them married at childbirth, while women with the educational attainment of less than high school are least likely to be married with 100.0% of them unmarried at childbirth.
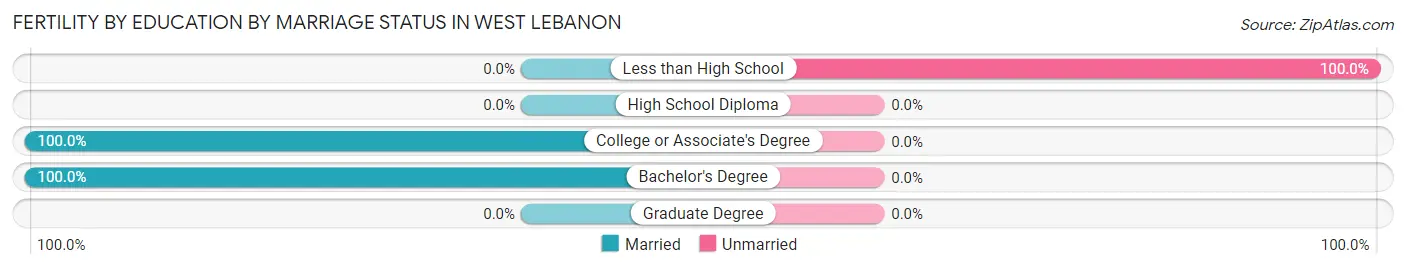
| Educational Attainment | Married | Unmarried |
| Less than High School | 0 (0.0%) | 3 (100.0%) |
| High School Diploma | 0 (0.0%) | 0 (0.0%) |
| College or Associate's Degree | 4 (100.0%) | 0 (0.0%) |
| Bachelor's Degree | 6 (100.0%) | 0 (0.0%) |
| Graduate Degree | 0 (0.0%) | 0 (0.0%) |
| Total | 10 (76.9%) | 3 (23.1%) |
Employment Characteristics in West Lebanon
Employment by Class of Employer in West Lebanon
Among the 362 employed individuals in West Lebanon, private company employees (310 | 85.6%), local government employees (13 | 3.6%), and not-for-profit organizations (11 | 3.0%) make up the most common classes of employment.
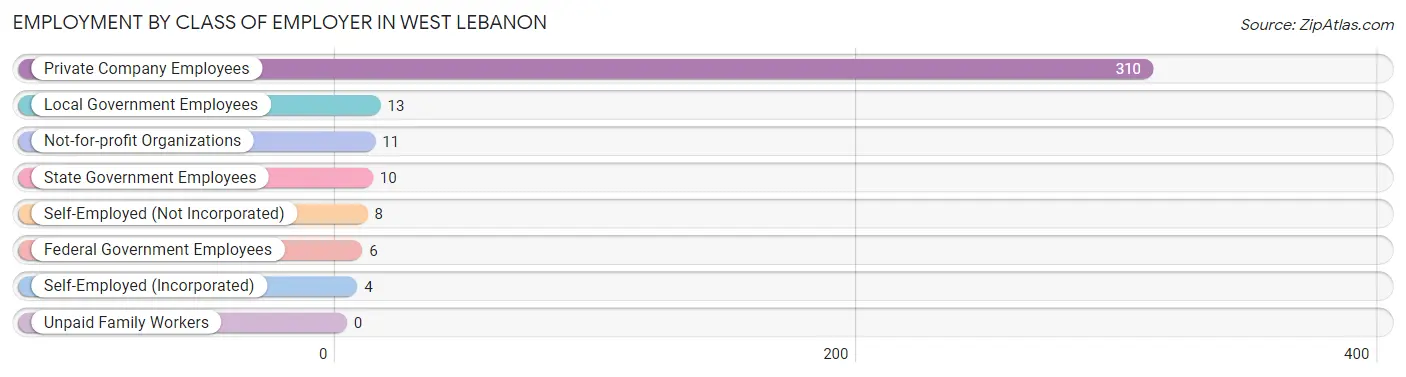
| Employer Class | # Employees | % Employees |
| Private Company Employees | 310 | 85.6% |
| Self-Employed (Incorporated) | 4 | 1.1% |
| Self-Employed (Not Incorporated) | 8 | 2.2% |
| Not-for-profit Organizations | 11 | 3.0% |
| Local Government Employees | 13 | 3.6% |
| State Government Employees | 10 | 2.8% |
| Federal Government Employees | 6 | 1.7% |
| Unpaid Family Workers | 0 | 0.0% |
| Total | 362 | 100.0% |
Employment Status by Age in West Lebanon
According to the labor force statistics for West Lebanon, out of the total population over 16 years of age (705), 58.7% or 414 individuals are in the labor force, with 12.6% or 52 of them unemployed. The age group with the highest labor force participation rate is 20 to 24 years, with 100.0% or 79 individuals in the labor force. Within the labor force, the 65 to 74 years age range has the highest percentage of unemployed individuals, with 40.9% or 38 of them being unemployed.
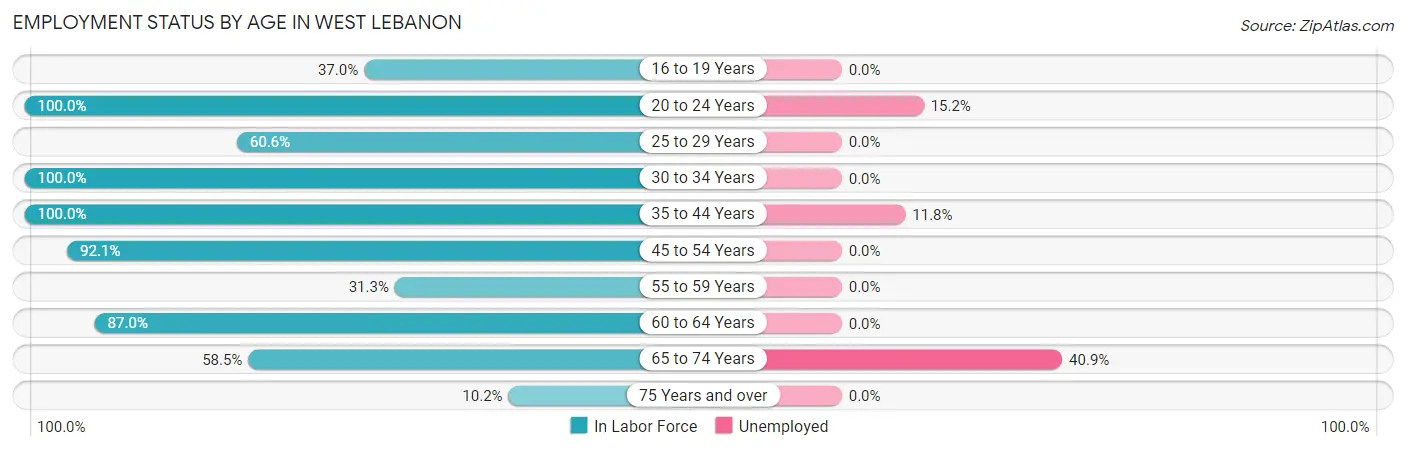
| Age Bracket | In Labor Force | Unemployed |
| 16 to 19 Years | 17 (37.0%) | 0 (0.0%) |
| 20 to 24 Years | 79 (100.0%) | 12 (15.2%) |
| 25 to 29 Years | 43 (60.6%) | 0 (0.0%) |
| 30 to 34 Years | 30 (100.0%) | 0 (0.0%) |
| 35 to 44 Years | 17 (100.0%) | 2 (11.8%) |
| 45 to 54 Years | 82 (92.1%) | 0 (0.0%) |
| 55 to 59 Years | 20 (31.3%) | 0 (0.0%) |
| 60 to 64 Years | 20 (87.0%) | 0 (0.0%) |
| 65 to 74 Years | 93 (58.5%) | 38 (40.9%) |
| 75 Years and over | 13 (10.2%) | 0 (0.0%) |
| Total | 414 (58.7%) | 52 (12.6%) |
Employment Status by Educational Attainment in West Lebanon
According to labor force statistics for West Lebanon, 72.1% of individuals (212) out of the total population between 25 and 64 years of age (294) are in the labor force, with 0.9% or 2 of them being unemployed. The group with the highest labor force participation rate are those with the educational attainment of less than high school, with 100.0% or 14 individuals in the labor force. Within the labor force, individuals with college / associate degree education have the highest percentage of unemployment, with 1.9% or 2 of them being unemployed.
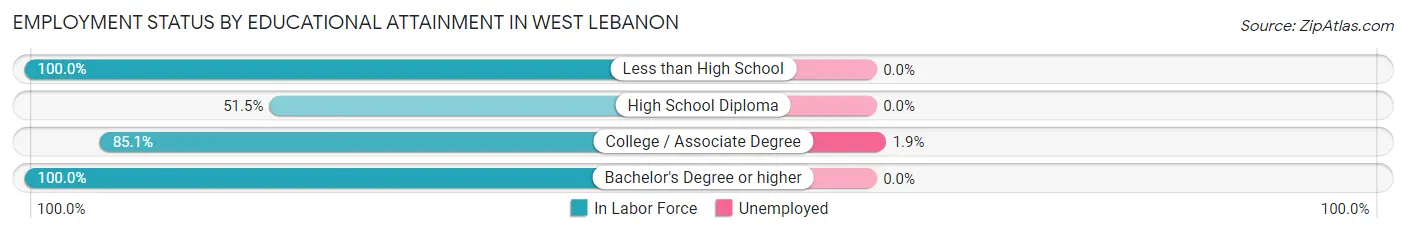
| Educational Attainment | In Labor Force | Unemployed |
| Less than High School | 14 (100.0%) | 0 (0.0%) |
| High School Diploma | 68 (51.5%) | 0 (0.0%) |
| College / Associate Degree | 103 (85.1%) | 2 (1.9%) |
| Bachelor's Degree or higher | 27 (100.0%) | 0 (0.0%) |
| Total | 212 (72.1%) | 3 (0.9%) |
Employment Occupations by Sex in West Lebanon
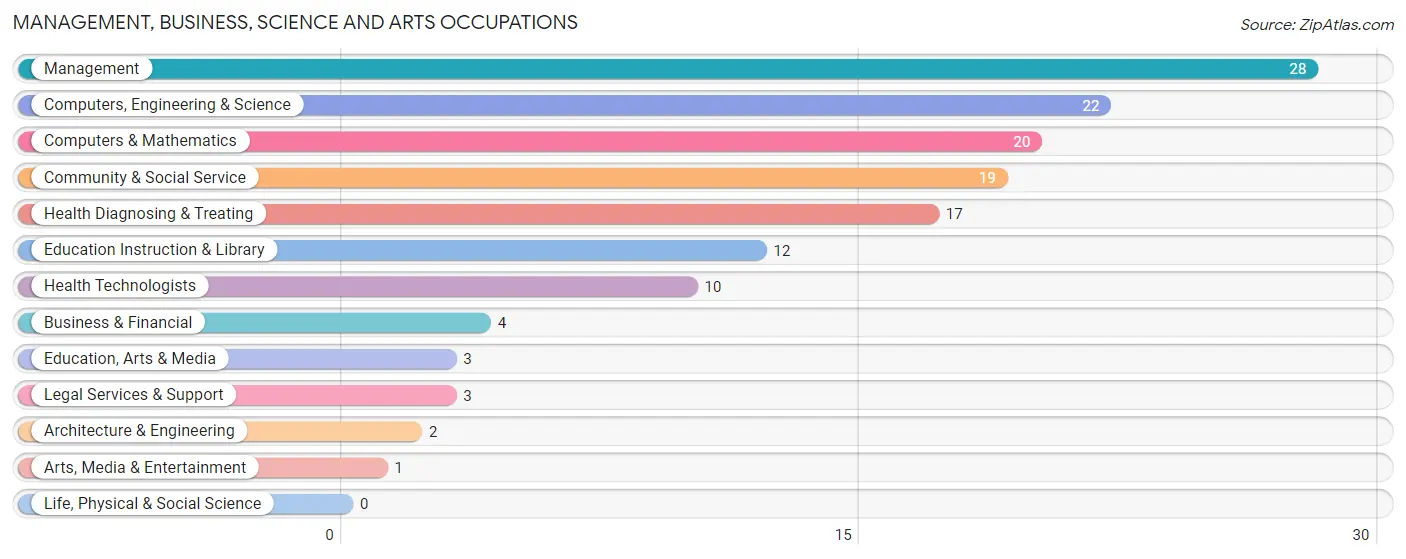
Management, Business, Science and Arts Occupations
The most common Management, Business, Science and Arts occupations in West Lebanon are Management (28 | 7.7%), Computers, Engineering & Science (22 | 6.1%), Computers & Mathematics (20 | 5.5%), Community & Social Service (19 | 5.2%), and Health Diagnosing & Treating (17 | 4.7%).
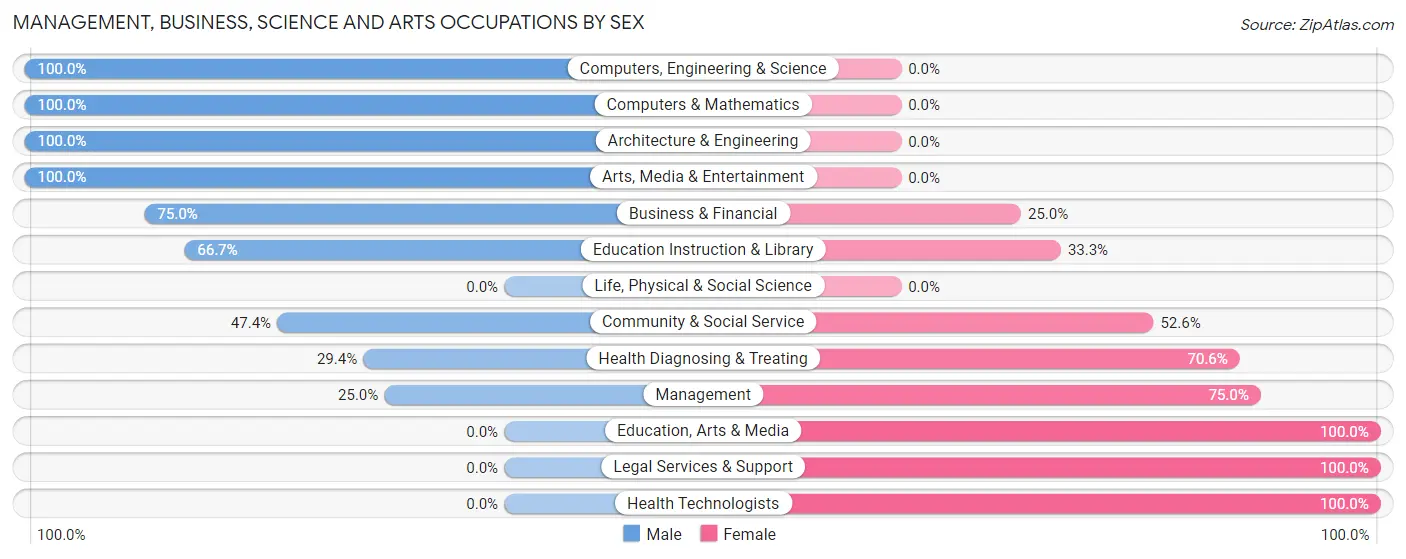
Management, Business, Science and Arts Occupations by Sex
Within the Management, Business, Science and Arts occupations in West Lebanon, the most male-oriented occupations are Computers, Engineering & Science (100.0%), Computers & Mathematics (100.0%), and Architecture & Engineering (100.0%), while the most female-oriented occupations are Education, Arts & Media (100.0%), Legal Services & Support (100.0%), and Health Technologists (100.0%).
| Occupation | Male | Female |
| Management | 7 (25.0%) | 21 (75.0%) |
| Business & Financial | 3 (75.0%) | 1 (25.0%) |
| Computers, Engineering & Science | 22 (100.0%) | 0 (0.0%) |
| Computers & Mathematics | 20 (100.0%) | 0 (0.0%) |
| Architecture & Engineering | 2 (100.0%) | 0 (0.0%) |
| Life, Physical & Social Science | 0 (0.0%) | 0 (0.0%) |
| Community & Social Service | 9 (47.4%) | 10 (52.6%) |
| Education, Arts & Media | 0 (0.0%) | 3 (100.0%) |
| Legal Services & Support | 0 (0.0%) | 3 (100.0%) |
| Education Instruction & Library | 8 (66.7%) | 4 (33.3%) |
| Arts, Media & Entertainment | 1 (100.0%) | 0 (0.0%) |
| Health Diagnosing & Treating | 5 (29.4%) | 12 (70.6%) |
| Health Technologists | 0 (0.0%) | 10 (100.0%) |
| Total (Category) | 46 (51.1%) | 44 (48.9%) |
| Total (Overall) | 211 (58.3%) | 151 (41.7%) |
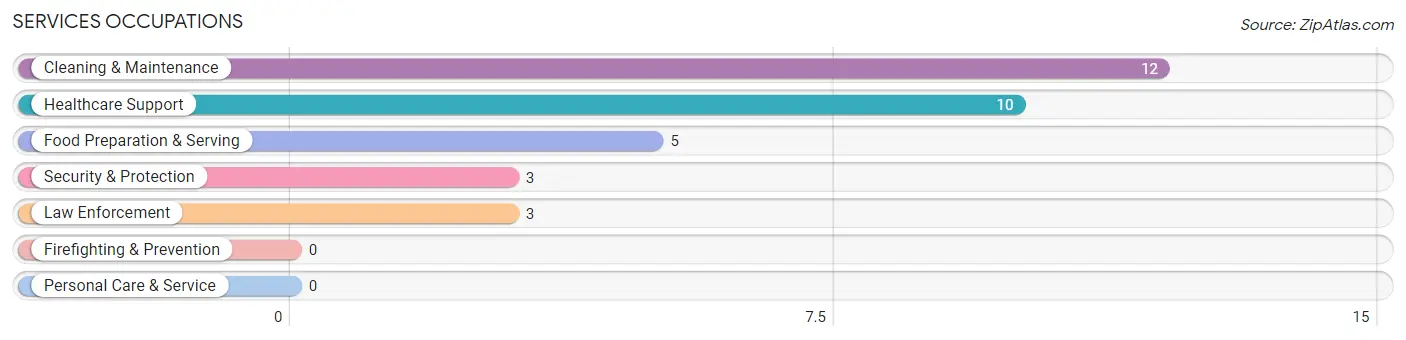
Services Occupations
The most common Services occupations in West Lebanon are Cleaning & Maintenance (12 | 3.3%), Healthcare Support (10 | 2.8%), Food Preparation & Serving (5 | 1.4%), Security & Protection (3 | 0.8%), and Law Enforcement (3 | 0.8%).
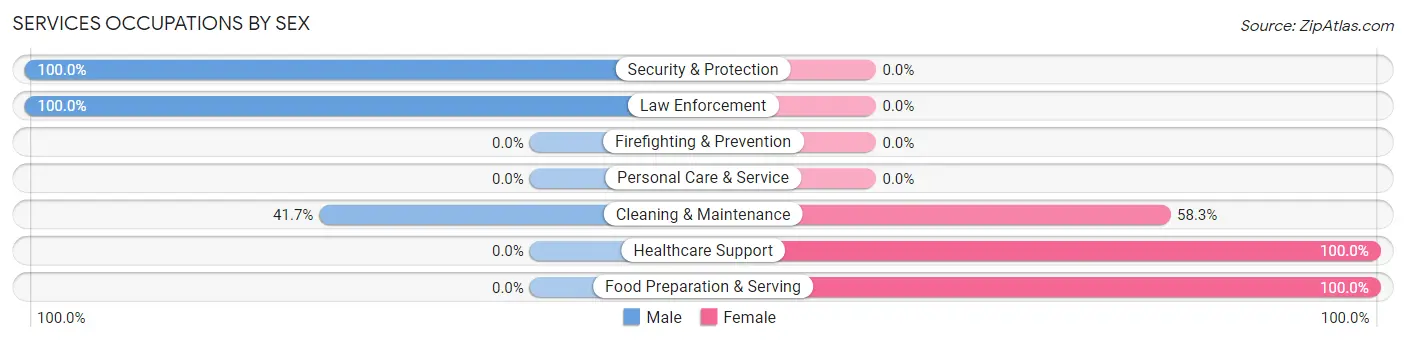
Services Occupations by Sex
Within the Services occupations in West Lebanon, the most male-oriented occupations are Security & Protection (100.0%), Law Enforcement (100.0%), and Cleaning & Maintenance (41.7%), while the most female-oriented occupations are Healthcare Support (100.0%), Food Preparation & Serving (100.0%), and Cleaning & Maintenance (58.3%).
| Occupation | Male | Female |
| Healthcare Support | 0 (0.0%) | 10 (100.0%) |
| Security & Protection | 3 (100.0%) | 0 (0.0%) |
| Firefighting & Prevention | 0 (0.0%) | 0 (0.0%) |
| Law Enforcement | 3 (100.0%) | 0 (0.0%) |
| Food Preparation & Serving | 0 (0.0%) | 5 (100.0%) |
| Cleaning & Maintenance | 5 (41.7%) | 7 (58.3%) |
| Personal Care & Service | 0 (0.0%) | 0 (0.0%) |
| Total (Category) | 8 (26.7%) | 22 (73.3%) |
| Total (Overall) | 211 (58.3%) | 151 (41.7%) |
Sales and Office Occupations
The most common Sales and Office occupations in West Lebanon are Sales & Related (40 | 11.1%), and Office & Administration (38 | 10.5%).
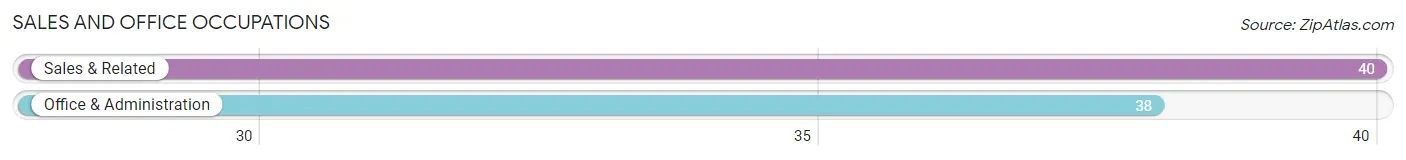
Sales and Office Occupations by Sex
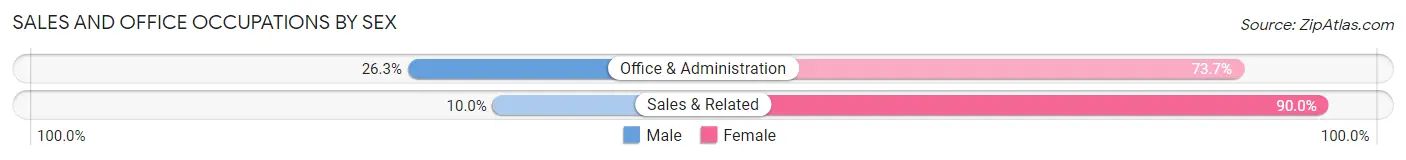
| Occupation | Male | Female |
| Sales & Related | 4 (10.0%) | 36 (90.0%) |
| Office & Administration | 10 (26.3%) | 28 (73.7%) |
| Total (Category) | 14 (17.9%) | 64 (82.1%) |
| Total (Overall) | 211 (58.3%) | 151 (41.7%) |
Natural Resources, Construction and Maintenance Occupations
The most common Natural Resources, Construction and Maintenance occupations in West Lebanon are Construction & Extraction (60 | 16.6%), and Installation, Maintenance & Repair (21 | 5.8%).
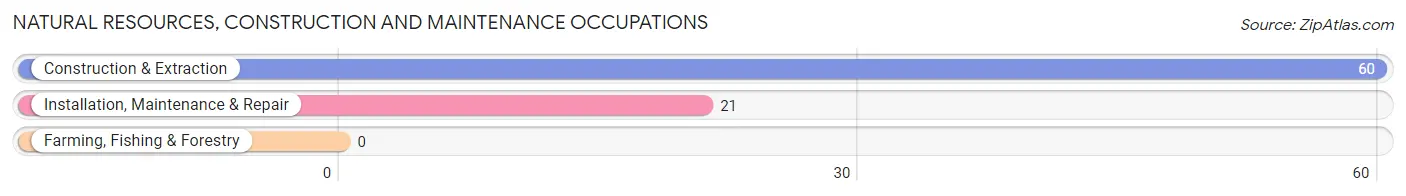
Natural Resources, Construction and Maintenance Occupations by Sex
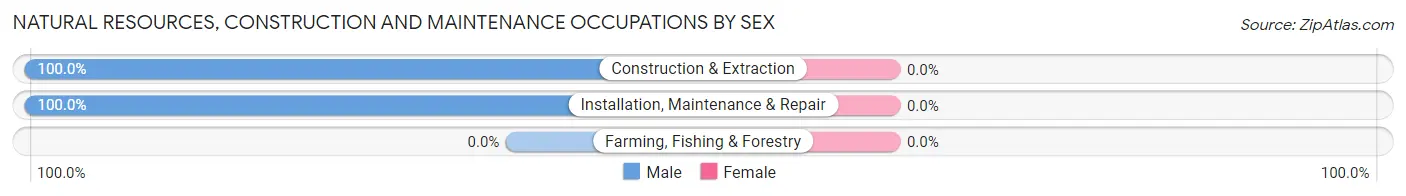
| Occupation | Male | Female |
| Farming, Fishing & Forestry | 0 (0.0%) | 0 (0.0%) |
| Construction & Extraction | 60 (100.0%) | 0 (0.0%) |
| Installation, Maintenance & Repair | 21 (100.0%) | 0 (0.0%) |
| Total (Category) | 81 (100.0%) | 0 (0.0%) |
| Total (Overall) | 211 (58.3%) | 151 (41.7%) |
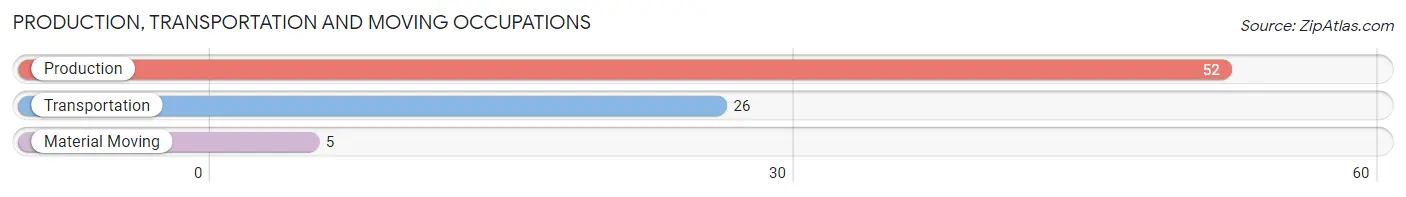
Production, Transportation and Moving Occupations
The most common Production, Transportation and Moving occupations in West Lebanon are Production (52 | 14.4%), Transportation (26 | 7.2%), and Material Moving (5 | 1.4%).
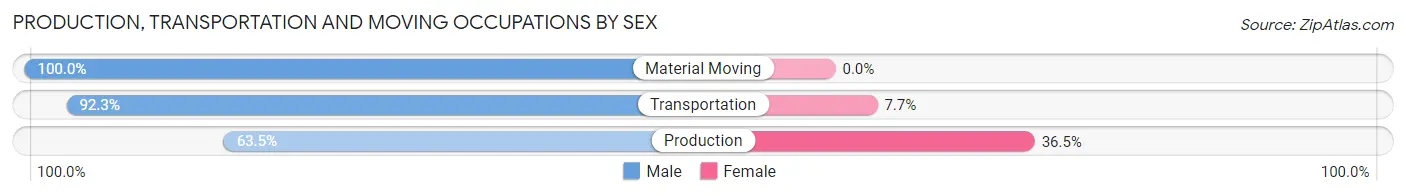
Production, Transportation and Moving Occupations by Sex
| Occupation | Male | Female |
| Production | 33 (63.5%) | 19 (36.5%) |
| Transportation | 24 (92.3%) | 2 (7.7%) |
| Material Moving | 5 (100.0%) | 0 (0.0%) |
| Total (Category) | 62 (74.7%) | 21 (25.3%) |
| Total (Overall) | 211 (58.3%) | 151 (41.7%) |
Employment Industries by Sex in West Lebanon
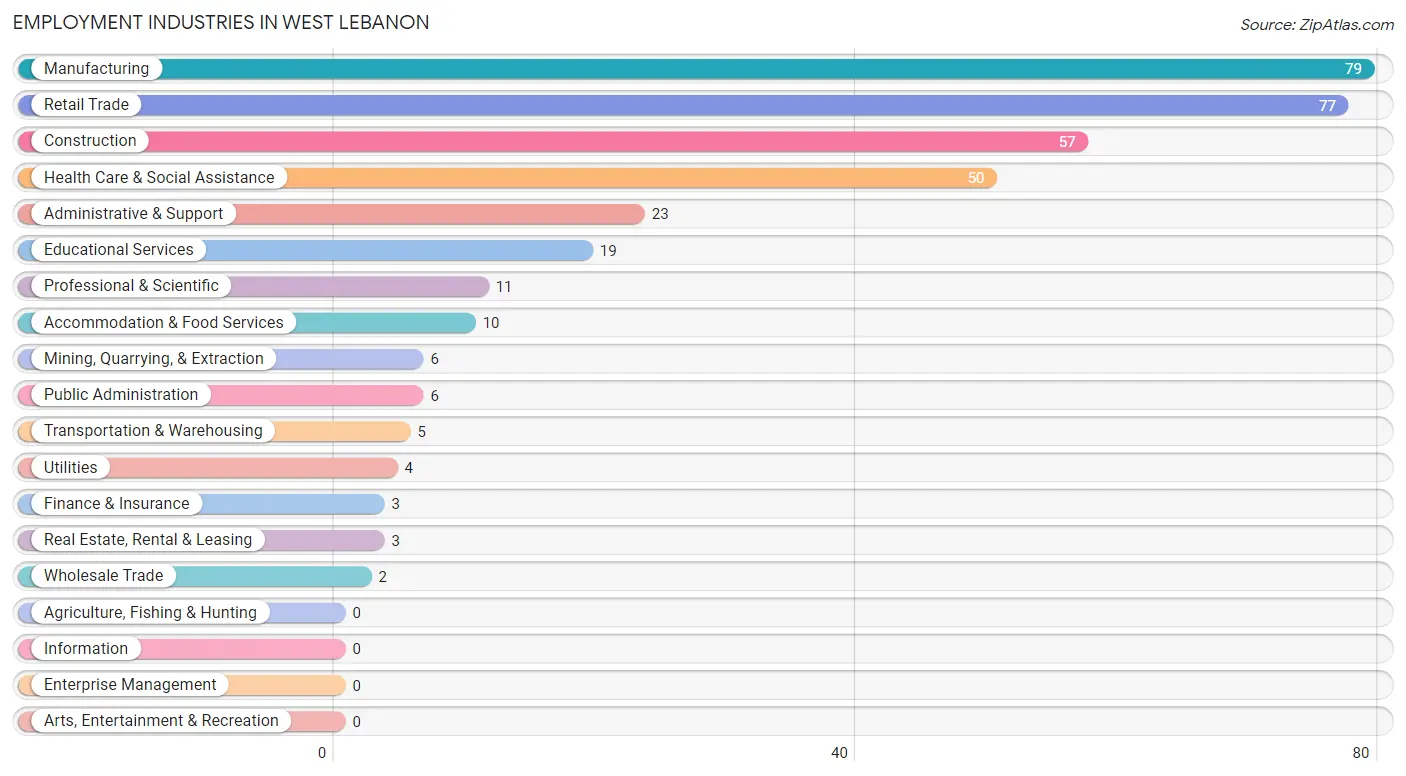
Employment Industries in West Lebanon
The major employment industries in West Lebanon include Manufacturing (79 | 21.8%), Retail Trade (77 | 21.3%), Construction (57 | 15.8%), Health Care & Social Assistance (50 | 13.8%), and Administrative & Support (23 | 6.4%).
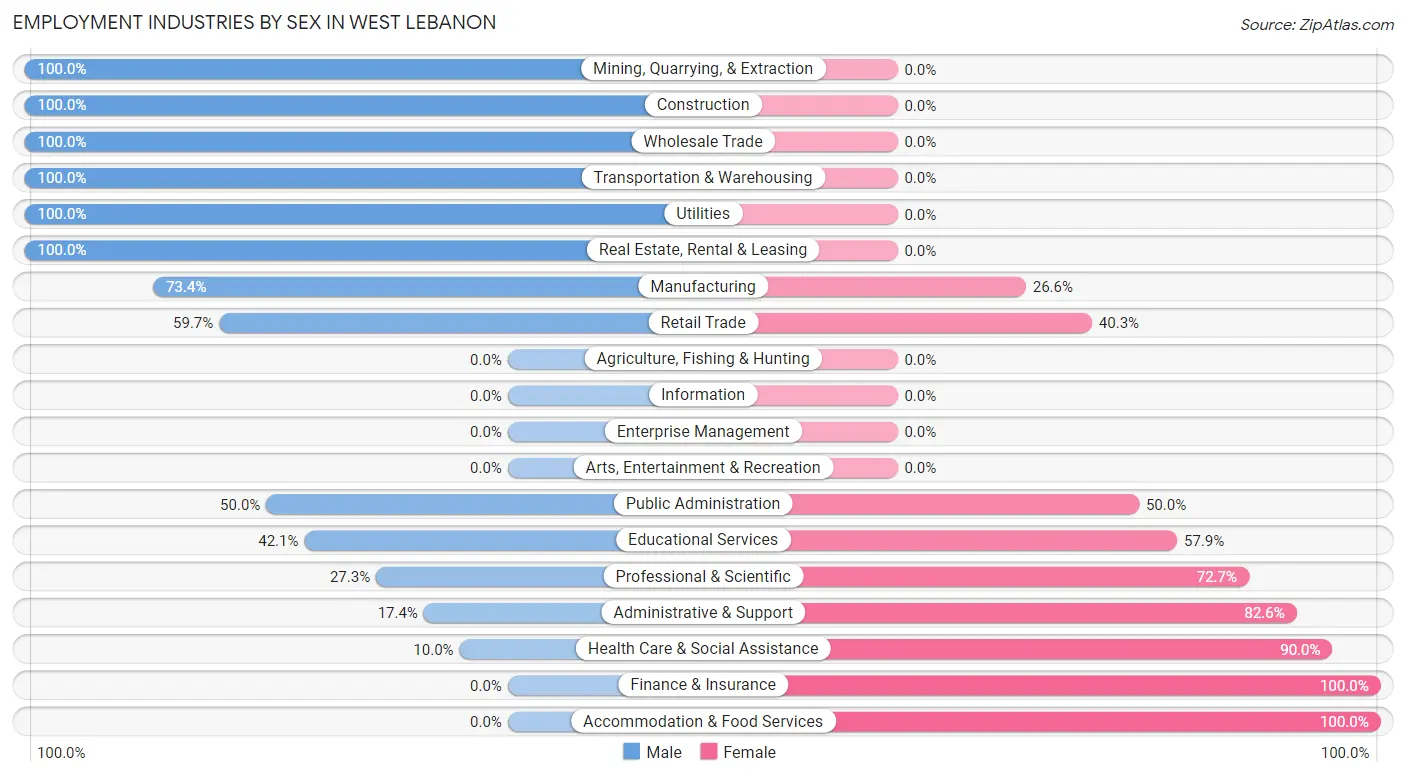
Employment Industries by Sex in West Lebanon
The West Lebanon industries that see more men than women are Mining, Quarrying, & Extraction (100.0%), Construction (100.0%), and Wholesale Trade (100.0%), whereas the industries that tend to have a higher number of women are Finance & Insurance (100.0%), Accommodation & Food Services (100.0%), and Health Care & Social Assistance (90.0%).
| Industry | Male | Female |
| Agriculture, Fishing & Hunting | 0 (0.0%) | 0 (0.0%) |
| Mining, Quarrying, & Extraction | 6 (100.0%) | 0 (0.0%) |
| Construction | 57 (100.0%) | 0 (0.0%) |
| Manufacturing | 58 (73.4%) | 21 (26.6%) |
| Wholesale Trade | 2 (100.0%) | 0 (0.0%) |
| Retail Trade | 46 (59.7%) | 31 (40.3%) |
| Transportation & Warehousing | 5 (100.0%) | 0 (0.0%) |
| Utilities | 4 (100.0%) | 0 (0.0%) |
| Information | 0 (0.0%) | 0 (0.0%) |
| Finance & Insurance | 0 (0.0%) | 3 (100.0%) |
| Real Estate, Rental & Leasing | 3 (100.0%) | 0 (0.0%) |
| Professional & Scientific | 3 (27.3%) | 8 (72.7%) |
| Enterprise Management | 0 (0.0%) | 0 (0.0%) |
| Administrative & Support | 4 (17.4%) | 19 (82.6%) |
| Educational Services | 8 (42.1%) | 11 (57.9%) |
| Health Care & Social Assistance | 5 (10.0%) | 45 (90.0%) |
| Arts, Entertainment & Recreation | 0 (0.0%) | 0 (0.0%) |
| Accommodation & Food Services | 0 (0.0%) | 10 (100.0%) |
| Public Administration | 3 (50.0%) | 3 (50.0%) |
| Total | 211 (58.3%) | 151 (41.7%) |
Education in West Lebanon
School Enrollment in West Lebanon
The most common levels of schooling among the 116 students in West Lebanon are high school (43 | 37.1%), college / undergraduate (27 | 23.3%), and middle school (23 | 19.8%).
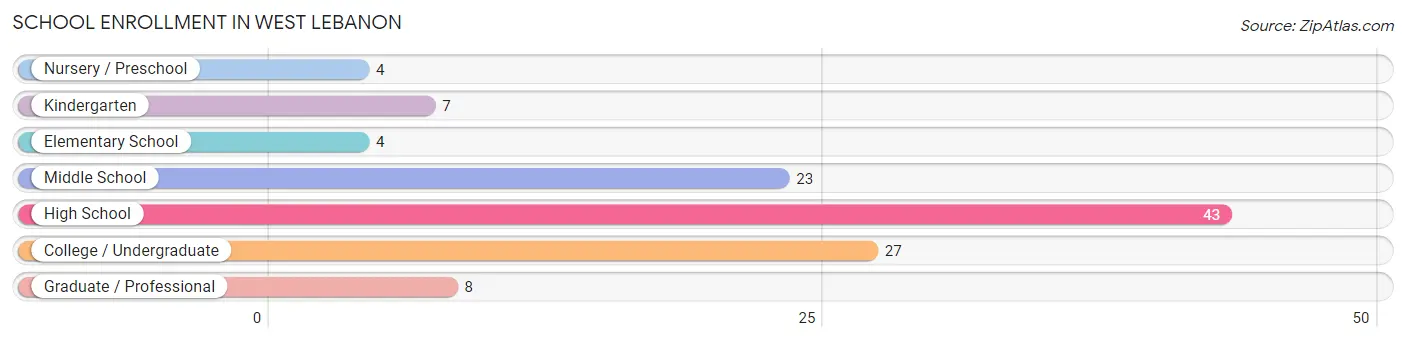
| School Level | # Students | % Students |
| Nursery / Preschool | 4 | 3.5% |
| Kindergarten | 7 | 6.0% |
| Elementary School | 4 | 3.5% |
| Middle School | 23 | 19.8% |
| High School | 43 | 37.1% |
| College / Undergraduate | 27 | 23.3% |
| Graduate / Professional | 8 | 6.9% |
| Total | 116 | 100.0% |
School Enrollment by Age by Funding Source in West Lebanon
Out of a total of 116 students who are enrolled in schools in West Lebanon, 8 (6.9%) attend a private institution, while the remaining 108 (93.1%) are enrolled in public schools. The age group of 35 years and over has the highest likelihood of being enrolled in private schools, with 8 (100.0% in the age bracket) enrolled. Conversely, the age group of 3 to 4 year olds has the lowest likelihood of being enrolled in a private school, with 4 (100.0% in the age bracket) attending a public institution.
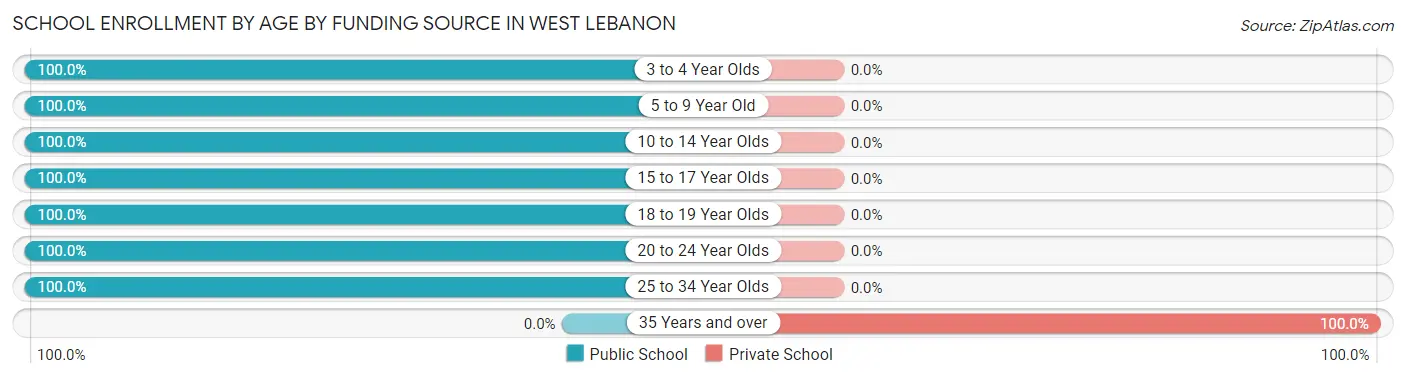
| Age Bracket | Public School | Private School |
| 3 to 4 Year Olds | 4 (100.0%) | 0 (0.0%) |
| 5 to 9 Year Old | 10 (100.0%) | 0 (0.0%) |
| 10 to 14 Year Olds | 24 (100.0%) | 0 (0.0%) |
| 15 to 17 Year Olds | 28 (100.0%) | 0 (0.0%) |
| 18 to 19 Year Olds | 15 (100.0%) | 0 (0.0%) |
| 20 to 24 Year Olds | 24 (100.0%) | 0 (0.0%) |
| 25 to 34 Year Olds | 3 (100.0%) | 0 (0.0%) |
| 35 Years and over | 0 (0.0%) | 8 (100.0%) |
| Total | 108 (93.1%) | 8 (6.9%) |
Educational Attainment by Field of Study in West Lebanon
Education (12 | 40.0%), multidisciplinary studies (6 | 20.0%), science & technology (4 | 13.3%), business (3 | 10.0%), and liberal arts & history (2 | 6.7%) are the most common fields of study among 30 individuals in West Lebanon who have obtained a bachelor's degree or higher.
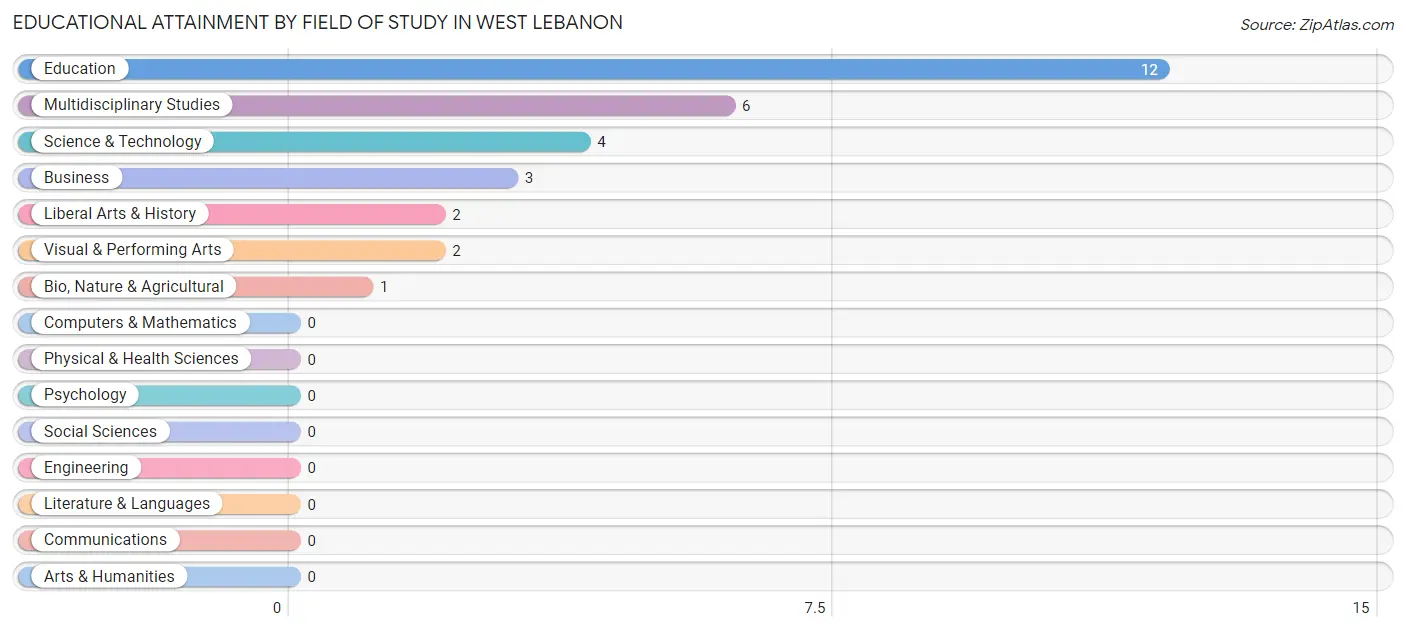
| Field of Study | # Graduates | % Graduates |
| Computers & Mathematics | 0 | 0.0% |
| Bio, Nature & Agricultural | 1 | 3.3% |
| Physical & Health Sciences | 0 | 0.0% |
| Psychology | 0 | 0.0% |
| Social Sciences | 0 | 0.0% |
| Engineering | 0 | 0.0% |
| Multidisciplinary Studies | 6 | 20.0% |
| Science & Technology | 4 | 13.3% |
| Business | 3 | 10.0% |
| Education | 12 | 40.0% |
| Literature & Languages | 0 | 0.0% |
| Liberal Arts & History | 2 | 6.7% |
| Visual & Performing Arts | 2 | 6.7% |
| Communications | 0 | 0.0% |
| Arts & Humanities | 0 | 0.0% |
| Total | 30 | 100.0% |
Transportation & Commute in West Lebanon
Vehicle Availability by Sex in West Lebanon
The most prevalent vehicle ownership categories in West Lebanon are males with 3 vehicles (85, accounting for 40.3%) and females with 3 vehicles (30, making up 56.3%).
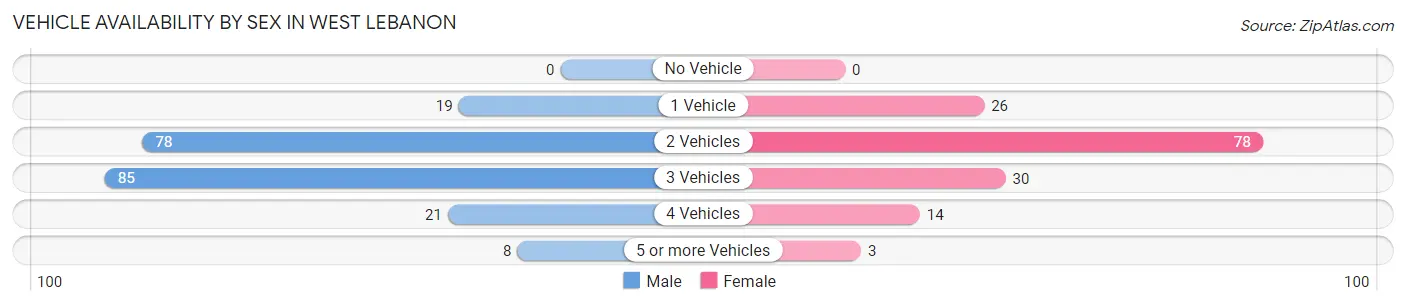
| Vehicles Available | Male | Female |
| No Vehicle | 0 (0.0%) | 0 (0.0%) |
| 1 Vehicle | 19 (9.0%) | 26 (17.2%) |
| 2 Vehicles | 78 (37.0%) | 78 (51.7%) |
| 3 Vehicles | 85 (40.3%) | 30 (19.9%) |
| 4 Vehicles | 21 (10.0%) | 14 (9.3%) |
| 5 or more Vehicles | 8 (3.8%) | 3 (2.0%) |
| Total | 211 (100.0%) | 151 (100.0%) |
Commute Time in West Lebanon
The most frequently occuring commute durations in West Lebanon are 45 to 59 minutes (88 commuters, 24.6%), 60 to 89 minutes (67 commuters, 18.8%), and 10 to 14 minutes (47 commuters, 13.2%).
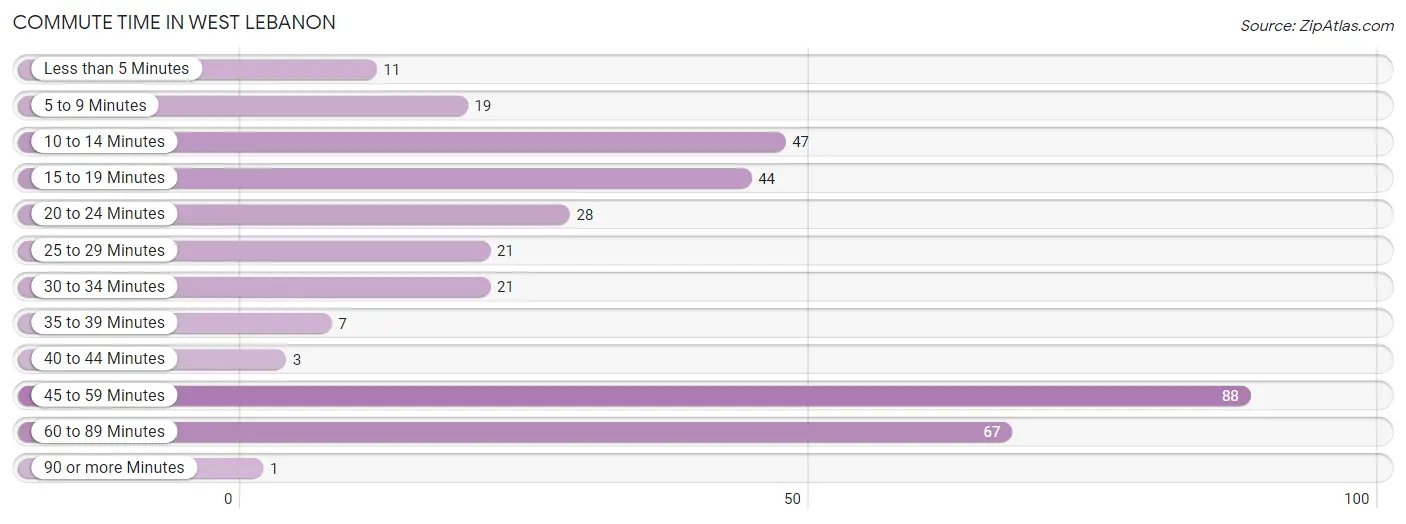
| Commute Time | # Commuters | % Commuters |
| Less than 5 Minutes | 11 | 3.1% |
| 5 to 9 Minutes | 19 | 5.3% |
| 10 to 14 Minutes | 47 | 13.2% |
| 15 to 19 Minutes | 44 | 12.3% |
| 20 to 24 Minutes | 28 | 7.8% |
| 25 to 29 Minutes | 21 | 5.9% |
| 30 to 34 Minutes | 21 | 5.9% |
| 35 to 39 Minutes | 7 | 2.0% |
| 40 to 44 Minutes | 3 | 0.8% |
| 45 to 59 Minutes | 88 | 24.6% |
| 60 to 89 Minutes | 67 | 18.8% |
| 90 or more Minutes | 1 | 0.3% |
Commute Time by Sex in West Lebanon
The most common commute times in West Lebanon are 45 to 59 minutes (71 commuters, 33.7%) for males and 60 to 89 minutes (41 commuters, 28.1%) for females.
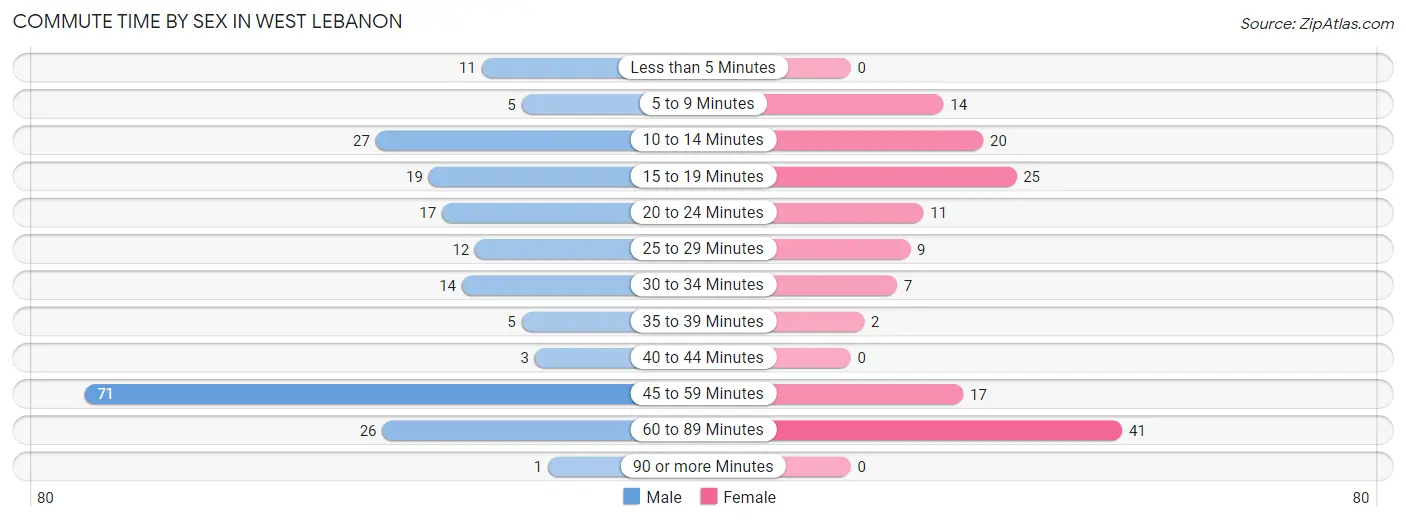
| Commute Time | Male | Female |
| Less than 5 Minutes | 11 (5.2%) | 0 (0.0%) |
| 5 to 9 Minutes | 5 (2.4%) | 14 (9.6%) |
| 10 to 14 Minutes | 27 (12.8%) | 20 (13.7%) |
| 15 to 19 Minutes | 19 (9.0%) | 25 (17.1%) |
| 20 to 24 Minutes | 17 (8.1%) | 11 (7.5%) |
| 25 to 29 Minutes | 12 (5.7%) | 9 (6.2%) |
| 30 to 34 Minutes | 14 (6.6%) | 7 (4.8%) |
| 35 to 39 Minutes | 5 (2.4%) | 2 (1.4%) |
| 40 to 44 Minutes | 3 (1.4%) | 0 (0.0%) |
| 45 to 59 Minutes | 71 (33.7%) | 17 (11.6%) |
| 60 to 89 Minutes | 26 (12.3%) | 41 (28.1%) |
| 90 or more Minutes | 1 (0.5%) | 0 (0.0%) |
Time of Departure to Work by Sex in West Lebanon
The most frequent times of departure to work in West Lebanon are 6:00 AM to 6:29 AM (60, 28.4%) for males and 6:30 AM to 6:59 AM (41, 28.1%) for females.
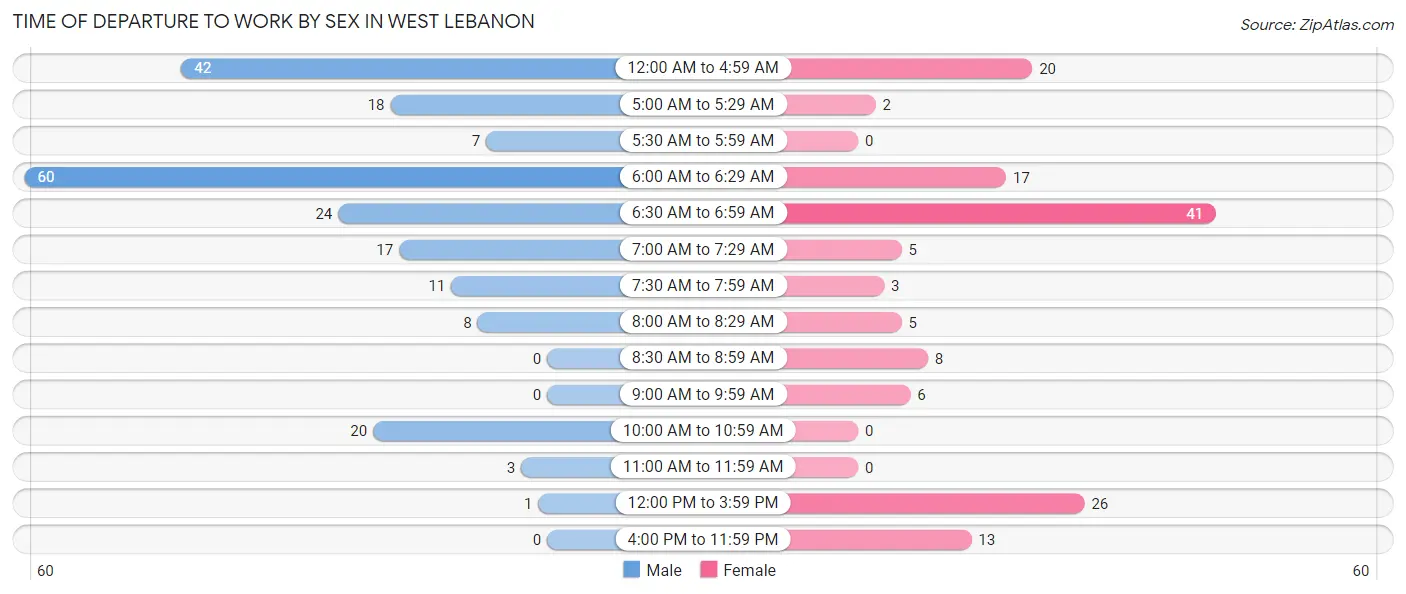
| Time of Departure | Male | Female |
| 12:00 AM to 4:59 AM | 42 (19.9%) | 20 (13.7%) |
| 5:00 AM to 5:29 AM | 18 (8.5%) | 2 (1.4%) |
| 5:30 AM to 5:59 AM | 7 (3.3%) | 0 (0.0%) |
| 6:00 AM to 6:29 AM | 60 (28.4%) | 17 (11.6%) |
| 6:30 AM to 6:59 AM | 24 (11.4%) | 41 (28.1%) |
| 7:00 AM to 7:29 AM | 17 (8.1%) | 5 (3.4%) |
| 7:30 AM to 7:59 AM | 11 (5.2%) | 3 (2.1%) |
| 8:00 AM to 8:29 AM | 8 (3.8%) | 5 (3.4%) |
| 8:30 AM to 8:59 AM | 0 (0.0%) | 8 (5.5%) |
| 9:00 AM to 9:59 AM | 0 (0.0%) | 6 (4.1%) |
| 10:00 AM to 10:59 AM | 20 (9.5%) | 0 (0.0%) |
| 11:00 AM to 11:59 AM | 3 (1.4%) | 0 (0.0%) |
| 12:00 PM to 3:59 PM | 1 (0.5%) | 26 (17.8%) |
| 4:00 PM to 11:59 PM | 0 (0.0%) | 13 (8.9%) |
| Total | 211 (100.0%) | 146 (100.0%) |
Housing Occupancy in West Lebanon
Occupancy by Ownership in West Lebanon
Of the total 330 dwellings in West Lebanon, owner-occupied units account for 242 (73.3%), while renter-occupied units make up 88 (26.7%).
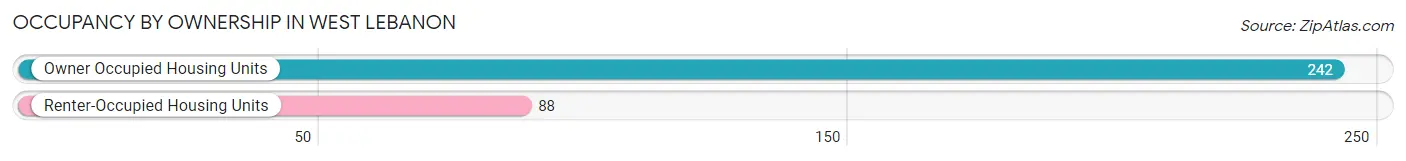
| Occupancy | # Housing Units | % Housing Units |
| Owner Occupied Housing Units | 242 | 73.3% |
| Renter-Occupied Housing Units | 88 | 26.7% |
| Total Occupied Housing Units | 330 | 100.0% |
Occupancy by Household Size in West Lebanon
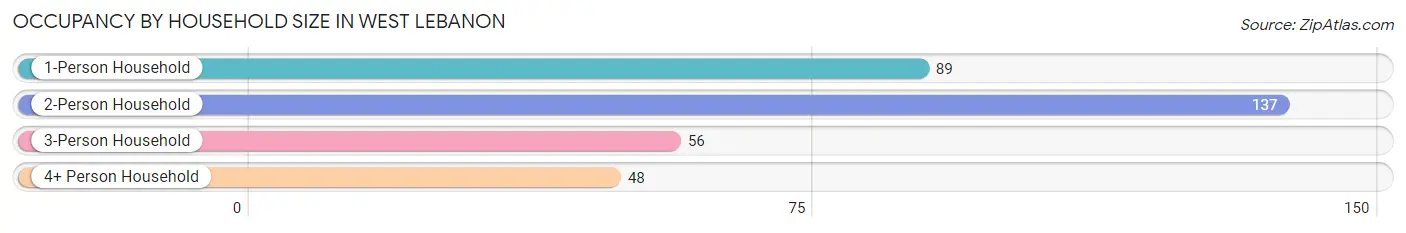
| Household Size | # Housing Units | % Housing Units |
| 1-Person Household | 89 | 27.0% |
| 2-Person Household | 137 | 41.5% |
| 3-Person Household | 56 | 17.0% |
| 4+ Person Household | 48 | 14.5% |
| Total Housing Units | 330 | 100.0% |
Occupancy by Ownership by Household Size in West Lebanon
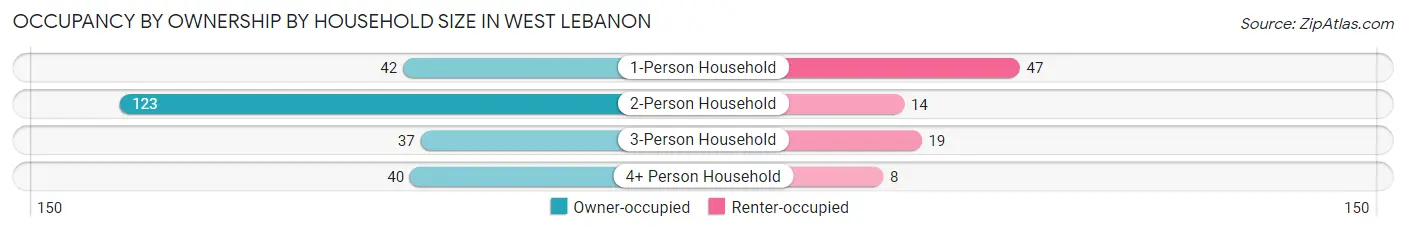
| Household Size | Owner-occupied | Renter-occupied |
| 1-Person Household | 42 (47.2%) | 47 (52.8%) |
| 2-Person Household | 123 (89.8%) | 14 (10.2%) |
| 3-Person Household | 37 (66.1%) | 19 (33.9%) |
| 4+ Person Household | 40 (83.3%) | 8 (16.7%) |
| Total Housing Units | 242 (73.3%) | 88 (26.7%) |
Occupancy by Educational Attainment in West Lebanon
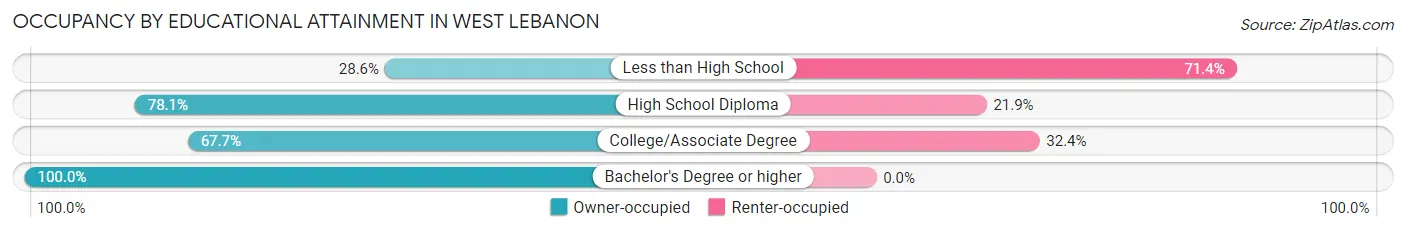
| Household Size | Owner-occupied | Renter-occupied |
| Less than High School | 6 (28.6%) | 15 (71.4%) |
| High School Diploma | 143 (78.1%) | 40 (21.9%) |
| College/Associate Degree | 69 (67.6%) | 33 (32.4%) |
| Bachelor's Degree or higher | 24 (100.0%) | 0 (0.0%) |
Occupancy by Age of Householder in West Lebanon
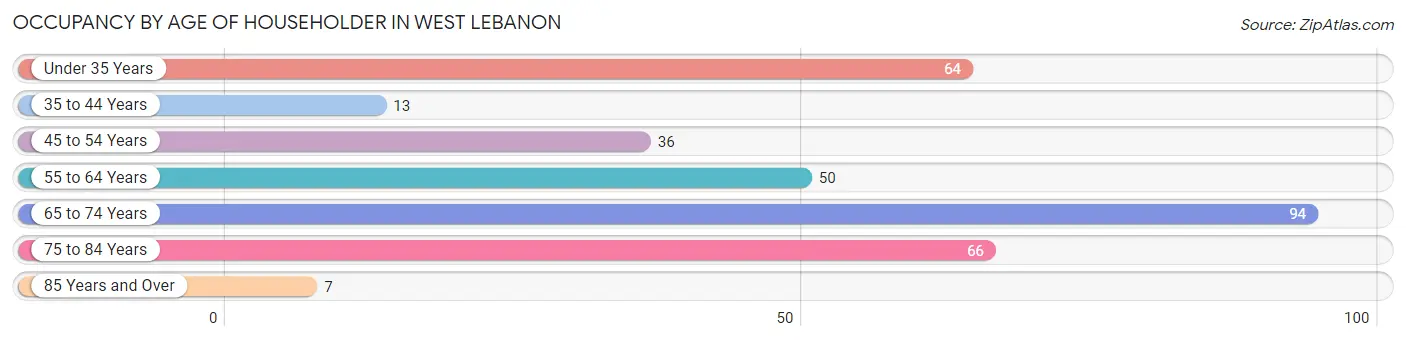
| Age Bracket | # Households | % Households |
| Under 35 Years | 64 | 19.4% |
| 35 to 44 Years | 13 | 3.9% |
| 45 to 54 Years | 36 | 10.9% |
| 55 to 64 Years | 50 | 15.1% |
| 65 to 74 Years | 94 | 28.5% |
| 75 to 84 Years | 66 | 20.0% |
| 85 Years and Over | 7 | 2.1% |
| Total | 330 | 100.0% |
Housing Finances in West Lebanon
Median Income by Occupancy in West Lebanon
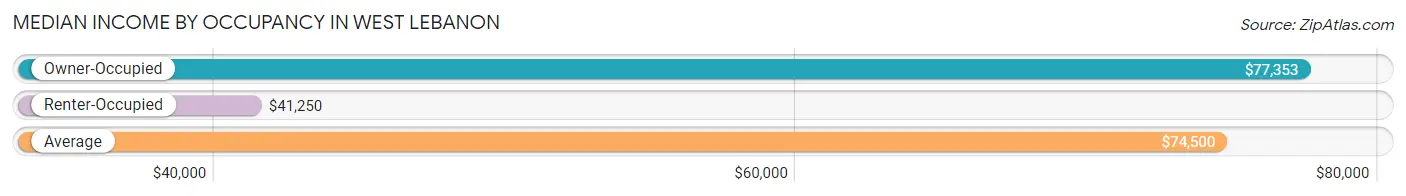
| Occupancy Type | # Households | Median Income |
| Owner-Occupied | 242 (73.3%) | $77,353 |
| Renter-Occupied | 88 (26.7%) | $41,250 |
| Average | 330 (100.0%) | $74,500 |
Occupancy by Householder Income Bracket in West Lebanon
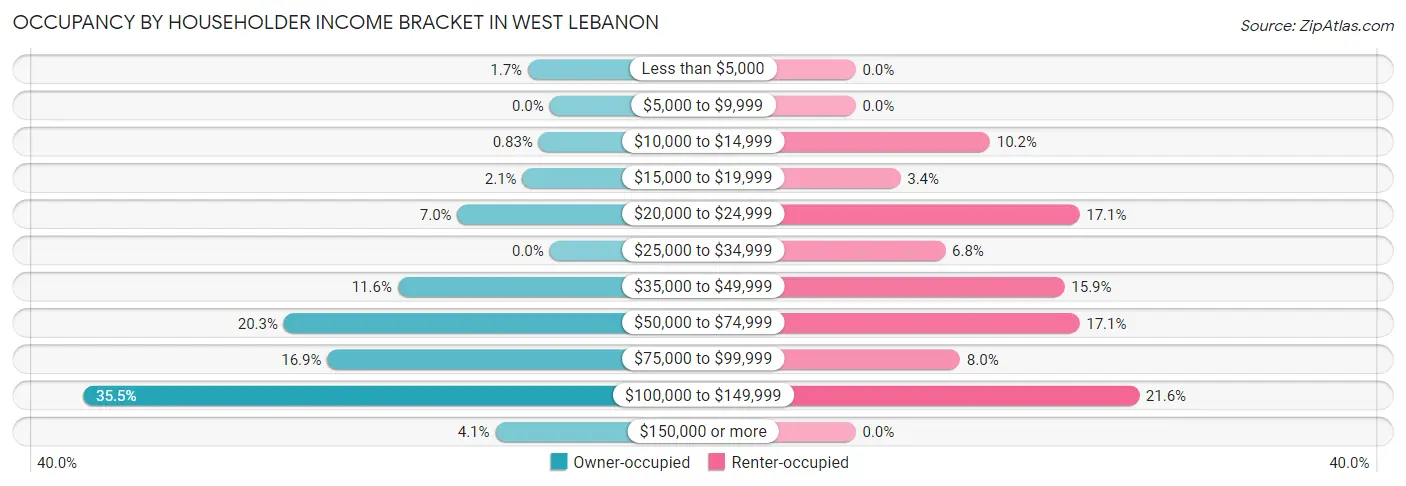
| Income Bracket | Owner-occupied | Renter-occupied |
| Less than $5,000 | 4 (1.7%) | 0 (0.0%) |
| $5,000 to $9,999 | 0 (0.0%) | 0 (0.0%) |
| $10,000 to $14,999 | 2 (0.8%) | 9 (10.2%) |
| $15,000 to $19,999 | 5 (2.1%) | 3 (3.4%) |
| $20,000 to $24,999 | 17 (7.0%) | 15 (17.1%) |
| $25,000 to $34,999 | 0 (0.0%) | 6 (6.8%) |
| $35,000 to $49,999 | 28 (11.6%) | 14 (15.9%) |
| $50,000 to $74,999 | 49 (20.3%) | 15 (17.1%) |
| $75,000 to $99,999 | 41 (16.9%) | 7 (8.0%) |
| $100,000 to $149,999 | 86 (35.5%) | 19 (21.6%) |
| $150,000 or more | 10 (4.1%) | 0 (0.0%) |
| Total | 242 (100.0%) | 88 (100.0%) |
Monthly Housing Cost Tiers in West Lebanon
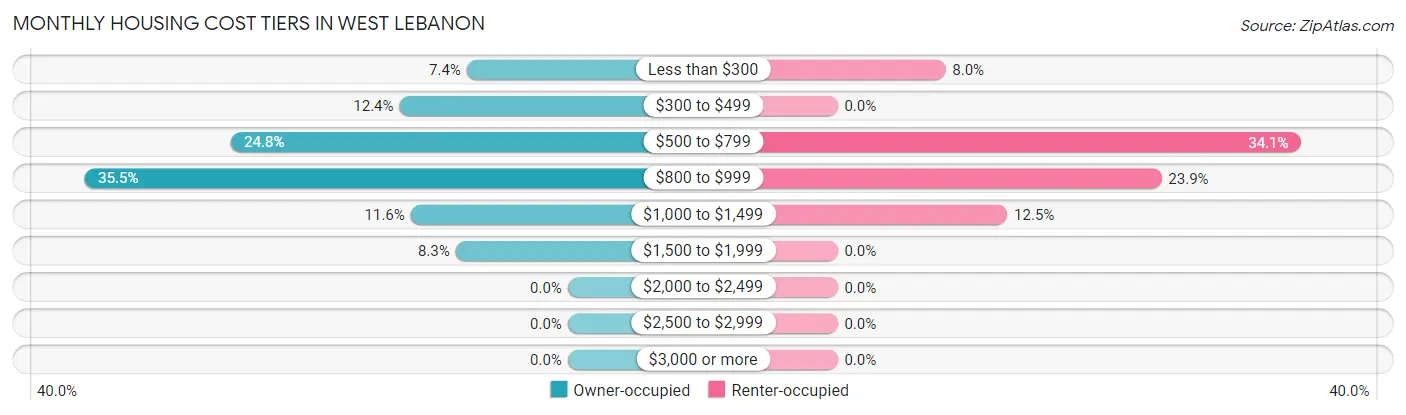
| Monthly Cost | Owner-occupied | Renter-occupied |
| Less than $300 | 18 (7.4%) | 7 (8.0%) |
| $300 to $499 | 30 (12.4%) | 0 (0.0%) |
| $500 to $799 | 60 (24.8%) | 30 (34.1%) |
| $800 to $999 | 86 (35.5%) | 21 (23.9%) |
| $1,000 to $1,499 | 28 (11.6%) | 11 (12.5%) |
| $1,500 to $1,999 | 20 (8.3%) | 0 (0.0%) |
| $2,000 to $2,499 | 0 (0.0%) | 0 (0.0%) |
| $2,500 to $2,999 | 0 (0.0%) | 0 (0.0%) |
| $3,000 or more | 0 (0.0%) | 0 (0.0%) |
| Total | 242 (100.0%) | 88 (100.0%) |
Physical Housing Characteristics in West Lebanon
Housing Structures in West Lebanon
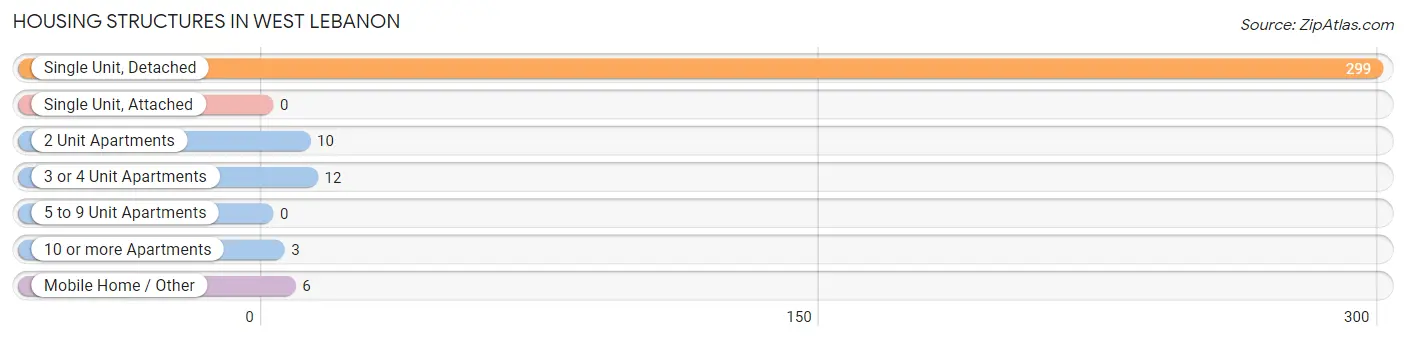
| Structure Type | # Housing Units | % Housing Units |
| Single Unit, Detached | 299 | 90.6% |
| Single Unit, Attached | 0 | 0.0% |
| 2 Unit Apartments | 10 | 3.0% |
| 3 or 4 Unit Apartments | 12 | 3.6% |
| 5 to 9 Unit Apartments | 0 | 0.0% |
| 10 or more Apartments | 3 | 0.9% |
| Mobile Home / Other | 6 | 1.8% |
| Total | 330 | 100.0% |
Housing Structures by Occupancy in West Lebanon
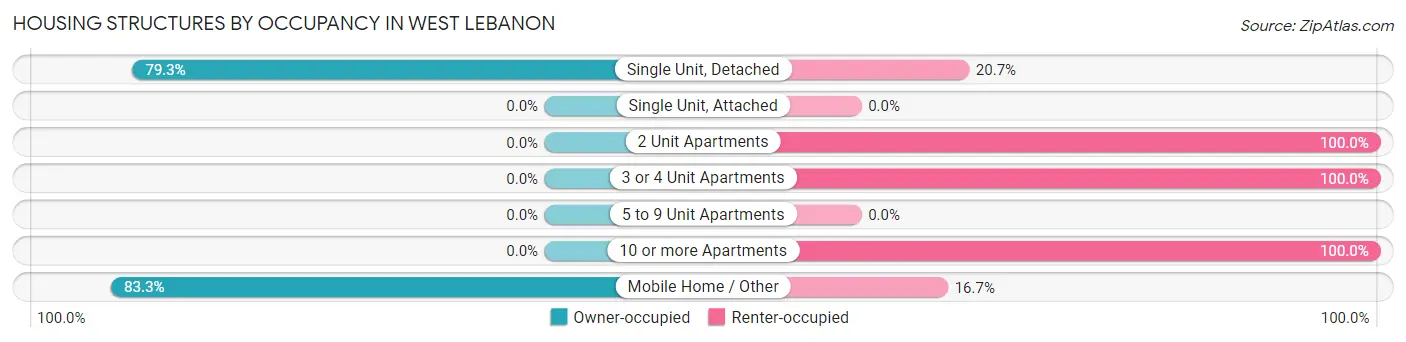
| Structure Type | Owner-occupied | Renter-occupied |
| Single Unit, Detached | 237 (79.3%) | 62 (20.7%) |
| Single Unit, Attached | 0 (0.0%) | 0 (0.0%) |
| 2 Unit Apartments | 0 (0.0%) | 10 (100.0%) |
| 3 or 4 Unit Apartments | 0 (0.0%) | 12 (100.0%) |
| 5 to 9 Unit Apartments | 0 (0.0%) | 0 (0.0%) |
| 10 or more Apartments | 0 (0.0%) | 3 (100.0%) |
| Mobile Home / Other | 5 (83.3%) | 1 (16.7%) |
| Total | 242 (73.3%) | 88 (26.7%) |
Housing Structures by Number of Rooms in West Lebanon
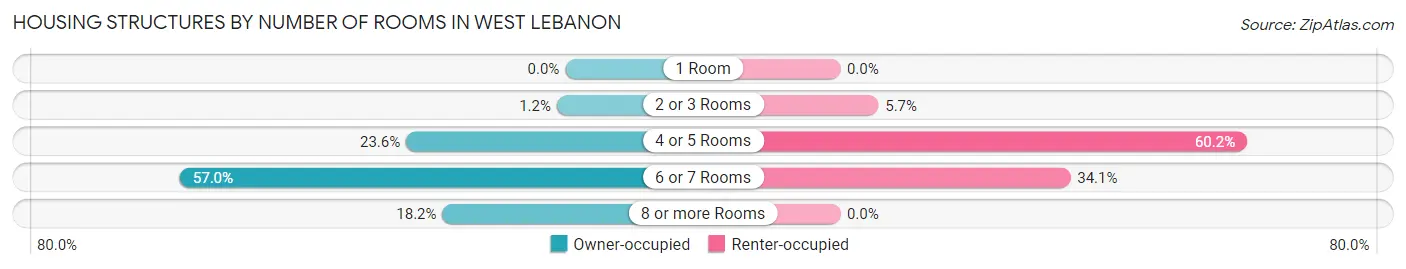
| Number of Rooms | Owner-occupied | Renter-occupied |
| 1 Room | 0 (0.0%) | 0 (0.0%) |
| 2 or 3 Rooms | 3 (1.2%) | 5 (5.7%) |
| 4 or 5 Rooms | 57 (23.5%) | 53 (60.2%) |
| 6 or 7 Rooms | 138 (57.0%) | 30 (34.1%) |
| 8 or more Rooms | 44 (18.2%) | 0 (0.0%) |
| Total | 242 (100.0%) | 88 (100.0%) |
Housing Structure by Heating Type in West Lebanon
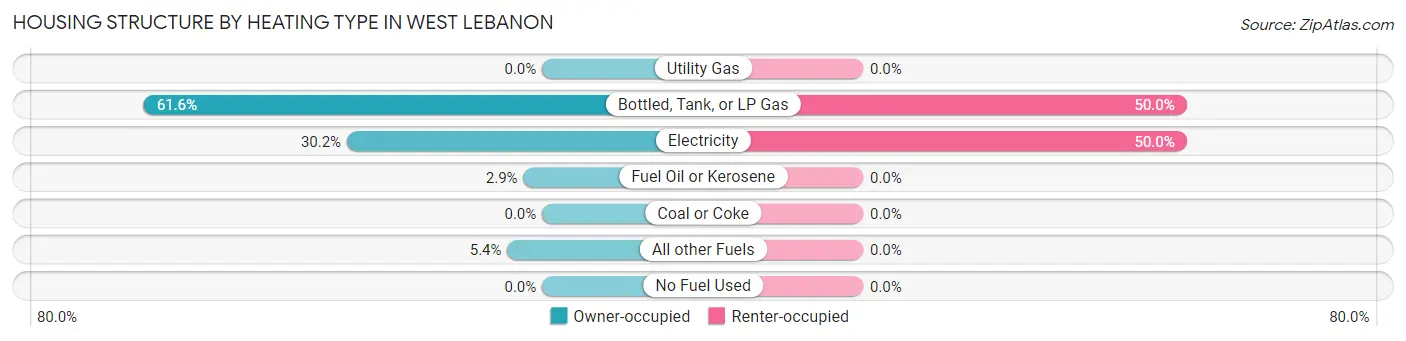
| Heating Type | Owner-occupied | Renter-occupied |
| Utility Gas | 0 (0.0%) | 0 (0.0%) |
| Bottled, Tank, or LP Gas | 149 (61.6%) | 44 (50.0%) |
| Electricity | 73 (30.2%) | 44 (50.0%) |
| Fuel Oil or Kerosene | 7 (2.9%) | 0 (0.0%) |
| Coal or Coke | 0 (0.0%) | 0 (0.0%) |
| All other Fuels | 13 (5.4%) | 0 (0.0%) |
| No Fuel Used | 0 (0.0%) | 0 (0.0%) |
| Total | 242 (100.0%) | 88 (100.0%) |
Household Vehicle Usage in West Lebanon
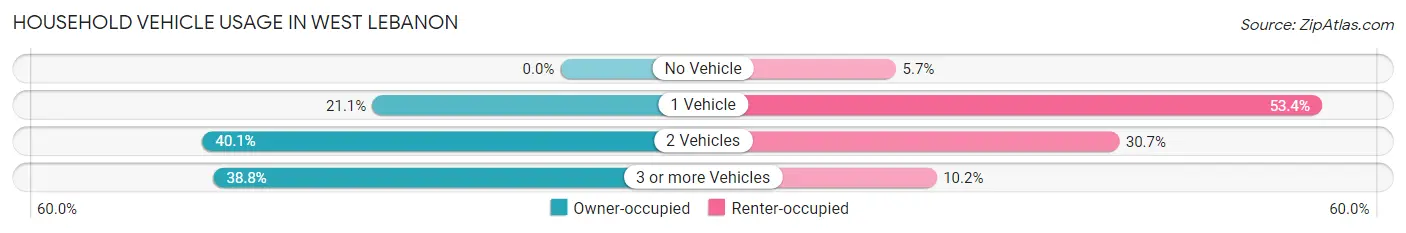
| Vehicles per Household | Owner-occupied | Renter-occupied |
| No Vehicle | 0 (0.0%) | 5 (5.7%) |
| 1 Vehicle | 51 (21.1%) | 47 (53.4%) |
| 2 Vehicles | 97 (40.1%) | 27 (30.7%) |
| 3 or more Vehicles | 94 (38.8%) | 9 (10.2%) |
| Total | 242 (100.0%) | 88 (100.0%) |
Real Estate & Mortgages in West Lebanon
Real Estate and Mortgage Overview in West Lebanon
| Characteristic | Without Mortgage | With Mortgage |
| Housing Units | 80 | 162 |
| Median Property Value | $82,900 | $97,000 |
| Median Household Income | $59,038 | $10 |
| Monthly Housing Costs | $450 | $0 |
| Real Estate Taxes | $363 | $0 |
Property Value by Mortgage Status in West Lebanon
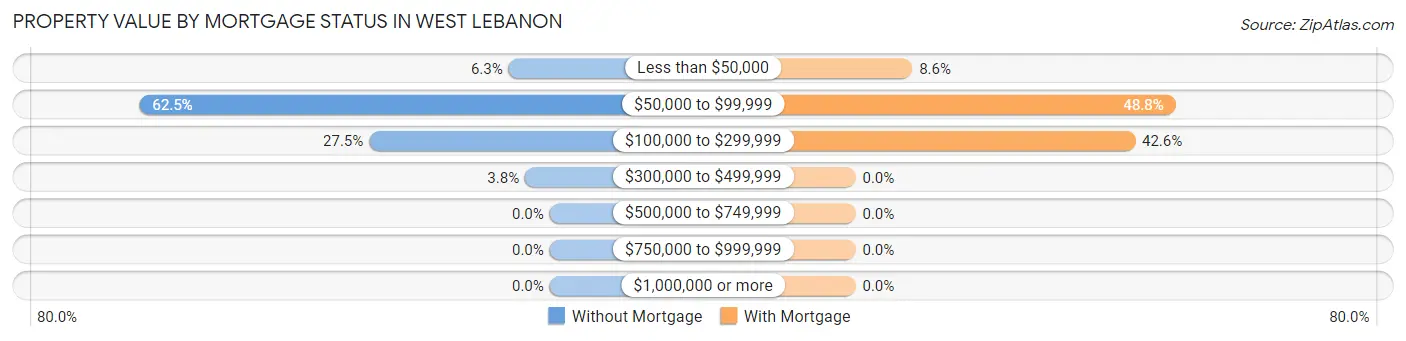
| Property Value | Without Mortgage | With Mortgage |
| Less than $50,000 | 5 (6.2%) | 14 (8.6%) |
| $50,000 to $99,999 | 50 (62.5%) | 79 (48.8%) |
| $100,000 to $299,999 | 22 (27.5%) | 69 (42.6%) |
| $300,000 to $499,999 | 3 (3.7%) | 0 (0.0%) |
| $500,000 to $749,999 | 0 (0.0%) | 0 (0.0%) |
| $750,000 to $999,999 | 0 (0.0%) | 0 (0.0%) |
| $1,000,000 or more | 0 (0.0%) | 0 (0.0%) |
| Total | 80 (100.0%) | 162 (100.0%) |
Household Income by Mortgage Status in West Lebanon
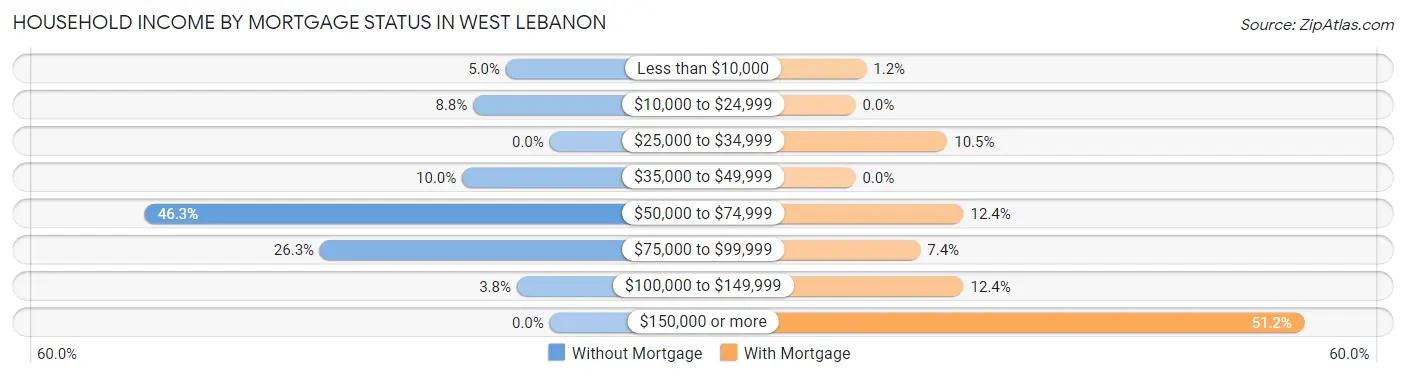
| Household Income | Without Mortgage | With Mortgage |
| Less than $10,000 | 4 (5.0%) | 2 (1.2%) |
| $10,000 to $24,999 | 7 (8.7%) | 0 (0.0%) |
| $25,000 to $34,999 | 0 (0.0%) | 17 (10.5%) |
| $35,000 to $49,999 | 8 (10.0%) | 0 (0.0%) |
| $50,000 to $74,999 | 37 (46.3%) | 20 (12.3%) |
| $75,000 to $99,999 | 21 (26.3%) | 12 (7.4%) |
| $100,000 to $149,999 | 3 (3.7%) | 20 (12.3%) |
| $150,000 or more | 0 (0.0%) | 83 (51.2%) |
| Total | 80 (100.0%) | 162 (100.0%) |
Property Value to Household Income Ratio in West Lebanon
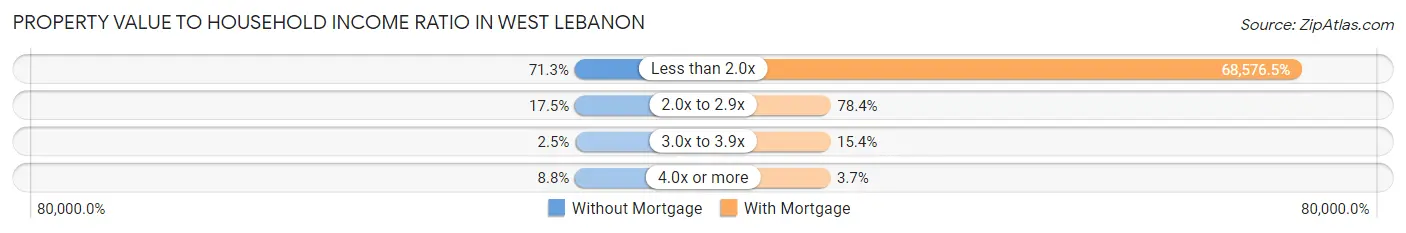
| Value-to-Income Ratio | Without Mortgage | With Mortgage |
| Less than 2.0x | 57 (71.3%) | 111,094 (68,576.5%) |
| 2.0x to 2.9x | 14 (17.5%) | 127 (78.4%) |
| 3.0x to 3.9x | 2 (2.5%) | 25 (15.4%) |
| 4.0x or more | 7 (8.7%) | 6 (3.7%) |
| Total | 80 (100.0%) | 162 (100.0%) |
Real Estate Taxes by Mortgage Status in West Lebanon
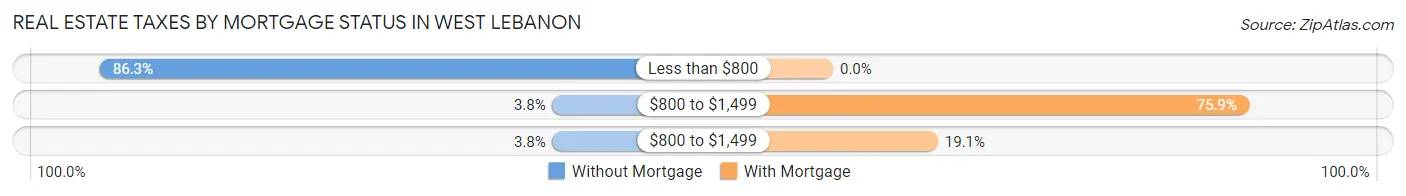
| Property Taxes | Without Mortgage | With Mortgage |
| Less than $800 | 69 (86.3%) | 0 (0.0%) |
| $800 to $1,499 | 3 (3.7%) | 123 (75.9%) |
| $800 to $1,499 | 3 (3.7%) | 31 (19.1%) |
| Total | 80 (100.0%) | 162 (100.0%) |
Health & Disability in West Lebanon
Health Insurance Coverage by Age in West Lebanon
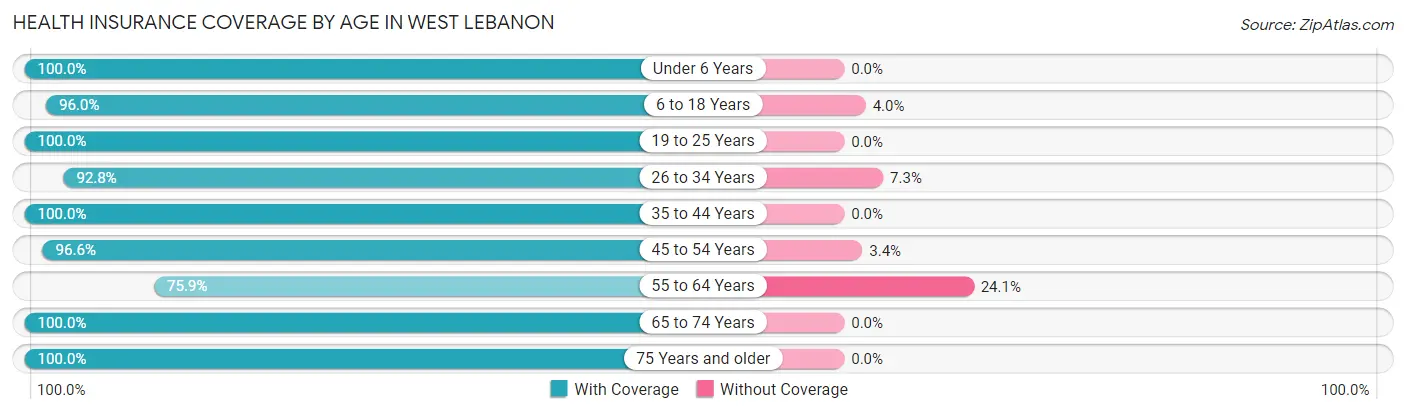
| Age Bracket | With Coverage | Without Coverage |
| Under 6 Years | 36 (100.0%) | 0 (0.0%) |
| 6 to 18 Years | 72 (96.0%) | 3 (4.0%) |
| 19 to 25 Years | 114 (100.0%) | 0 (0.0%) |
| 26 to 34 Years | 64 (92.7%) | 5 (7.2%) |
| 35 to 44 Years | 17 (100.0%) | 0 (0.0%) |
| 45 to 54 Years | 86 (96.6%) | 3 (3.4%) |
| 55 to 64 Years | 66 (75.9%) | 21 (24.1%) |
| 65 to 74 Years | 159 (100.0%) | 0 (0.0%) |
| 75 Years and older | 127 (100.0%) | 0 (0.0%) |
| Total | 741 (95.9%) | 32 (4.1%) |
Health Insurance Coverage by Citizenship Status in West Lebanon
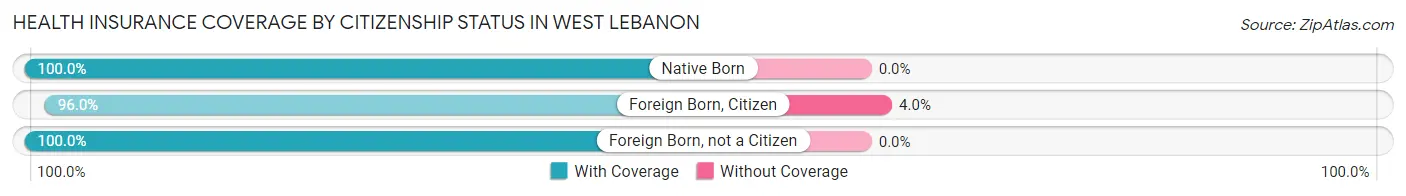
| Citizenship Status | With Coverage | Without Coverage |
| Native Born | 36 (100.0%) | 0 (0.0%) |
| Foreign Born, Citizen | 72 (96.0%) | 3 (4.0%) |
| Foreign Born, not a Citizen | 114 (100.0%) | 0 (0.0%) |
Health Insurance Coverage by Household Income in West Lebanon
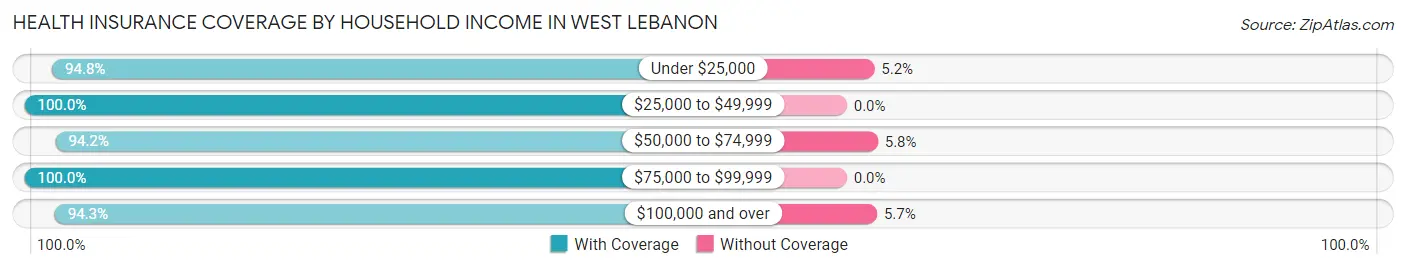
| Household Income | With Coverage | Without Coverage |
| Under $25,000 | 55 (94.8%) | 3 (5.2%) |
| $25,000 to $49,999 | 88 (100.0%) | 0 (0.0%) |
| $50,000 to $74,999 | 130 (94.2%) | 8 (5.8%) |
| $75,000 to $99,999 | 118 (100.0%) | 0 (0.0%) |
| $100,000 and over | 350 (94.3%) | 21 (5.7%) |
Public vs Private Health Insurance Coverage by Age in West Lebanon
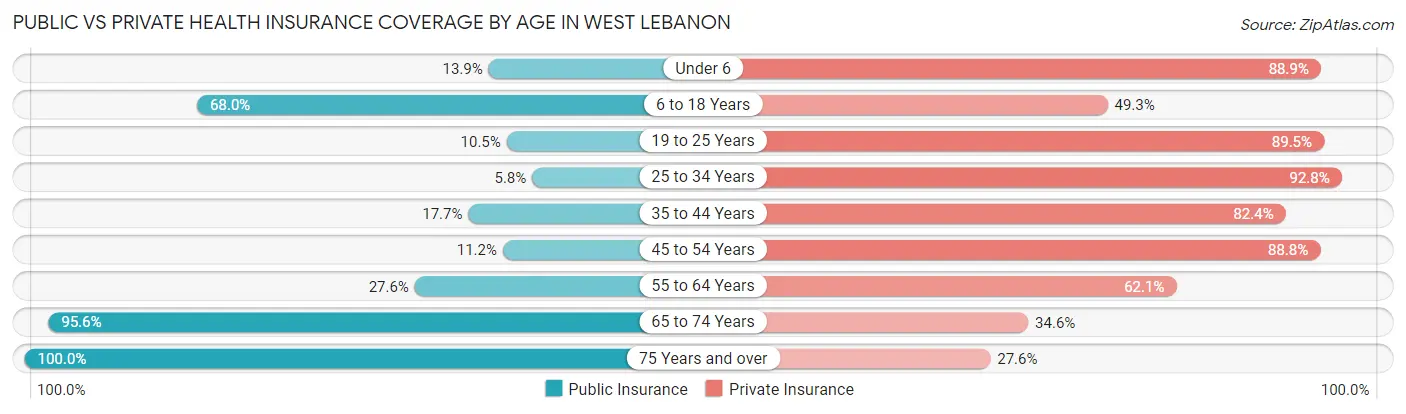
| Age Bracket | Public Insurance | Private Insurance |
| Under 6 | 5 (13.9%) | 32 (88.9%) |
| 6 to 18 Years | 51 (68.0%) | 37 (49.3%) |
| 19 to 25 Years | 12 (10.5%) | 102 (89.5%) |
| 25 to 34 Years | 4 (5.8%) | 64 (92.7%) |
| 35 to 44 Years | 3 (17.6%) | 14 (82.4%) |
| 45 to 54 Years | 10 (11.2%) | 79 (88.8%) |
| 55 to 64 Years | 24 (27.6%) | 54 (62.1%) |
| 65 to 74 Years | 152 (95.6%) | 55 (34.6%) |
| 75 Years and over | 127 (100.0%) | 35 (27.6%) |
| Total | 388 (50.2%) | 472 (61.1%) |
Disability Status by Sex by Age in West Lebanon
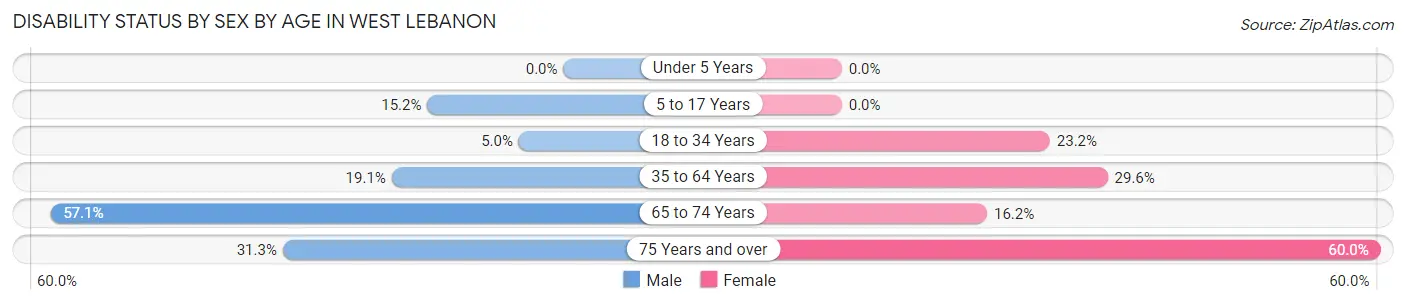
| Age Bracket | Male | Female |
| Under 5 Years | 0 (0.0%) | 0 (0.0%) |
| 5 to 17 Years | 5 (15.1%) | 0 (0.0%) |
| 18 to 34 Years | 6 (5.0%) | 19 (23.2%) |
| 35 to 64 Years | 13 (19.1%) | 37 (29.6%) |
| 65 to 74 Years | 52 (57.1%) | 11 (16.2%) |
| 75 Years and over | 10 (31.2%) | 57 (60.0%) |
Disability Class by Sex by Age in West Lebanon
Disability Class: Hearing Difficulty
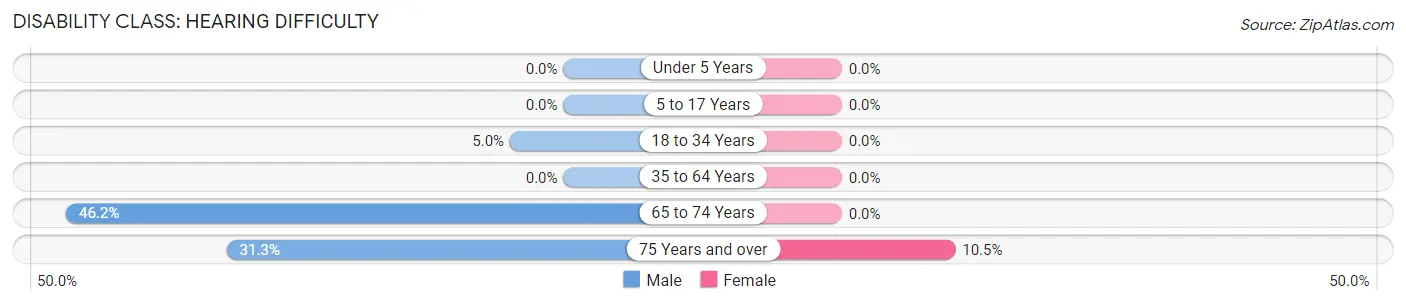
| Age Bracket | Male | Female |
| Under 5 Years | 0 (0.0%) | 0 (0.0%) |
| 5 to 17 Years | 0 (0.0%) | 0 (0.0%) |
| 18 to 34 Years | 6 (5.0%) | 0 (0.0%) |
| 35 to 64 Years | 0 (0.0%) | 0 (0.0%) |
| 65 to 74 Years | 42 (46.2%) | 0 (0.0%) |
| 75 Years and over | 10 (31.2%) | 10 (10.5%) |
Disability Class: Vision Difficulty
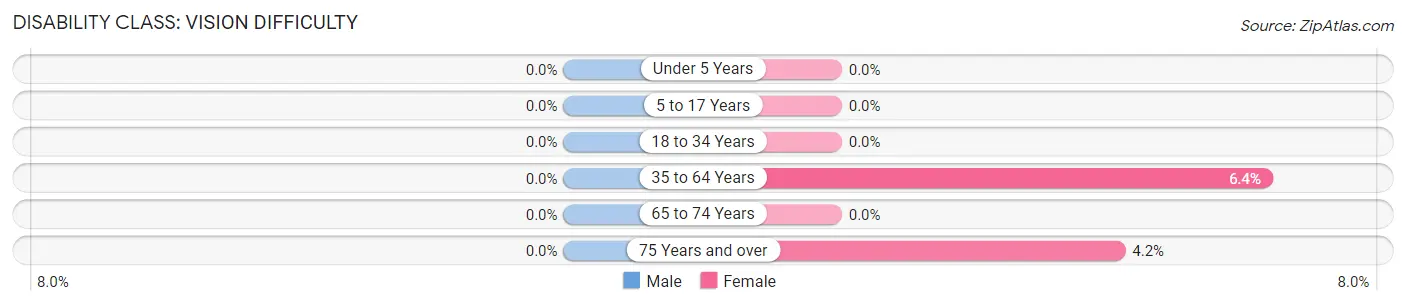
| Age Bracket | Male | Female |
| Under 5 Years | 0 (0.0%) | 0 (0.0%) |
| 5 to 17 Years | 0 (0.0%) | 0 (0.0%) |
| 18 to 34 Years | 0 (0.0%) | 0 (0.0%) |
| 35 to 64 Years | 0 (0.0%) | 8 (6.4%) |
| 65 to 74 Years | 0 (0.0%) | 0 (0.0%) |
| 75 Years and over | 0 (0.0%) | 4 (4.2%) |
Disability Class: Cognitive Difficulty
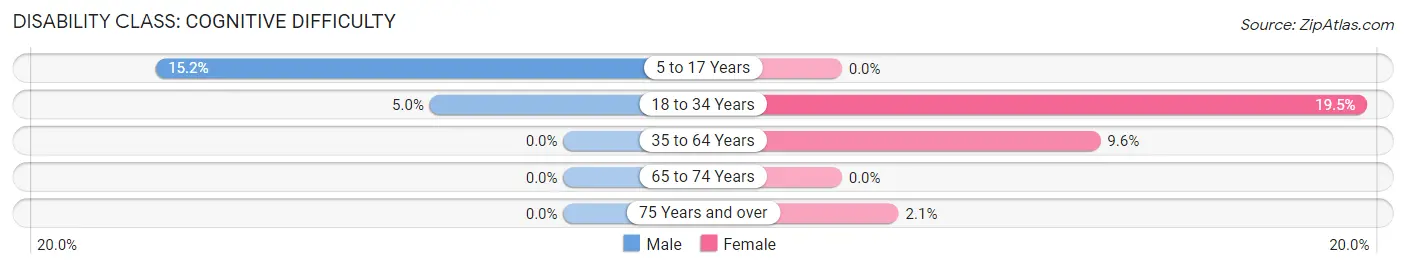
| Age Bracket | Male | Female |
| 5 to 17 Years | 5 (15.1%) | 0 (0.0%) |
| 18 to 34 Years | 6 (5.0%) | 16 (19.5%) |
| 35 to 64 Years | 0 (0.0%) | 12 (9.6%) |
| 65 to 74 Years | 0 (0.0%) | 0 (0.0%) |
| 75 Years and over | 0 (0.0%) | 2 (2.1%) |
Disability Class: Ambulatory Difficulty
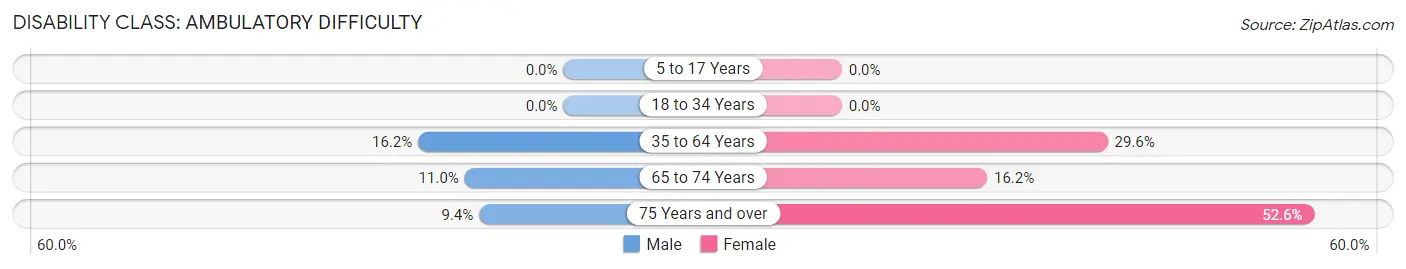
| Age Bracket | Male | Female |
| 5 to 17 Years | 0 (0.0%) | 0 (0.0%) |
| 18 to 34 Years | 0 (0.0%) | 0 (0.0%) |
| 35 to 64 Years | 11 (16.2%) | 37 (29.6%) |
| 65 to 74 Years | 10 (11.0%) | 11 (16.2%) |
| 75 Years and over | 3 (9.4%) | 50 (52.6%) |
Disability Class: Self-Care Difficulty
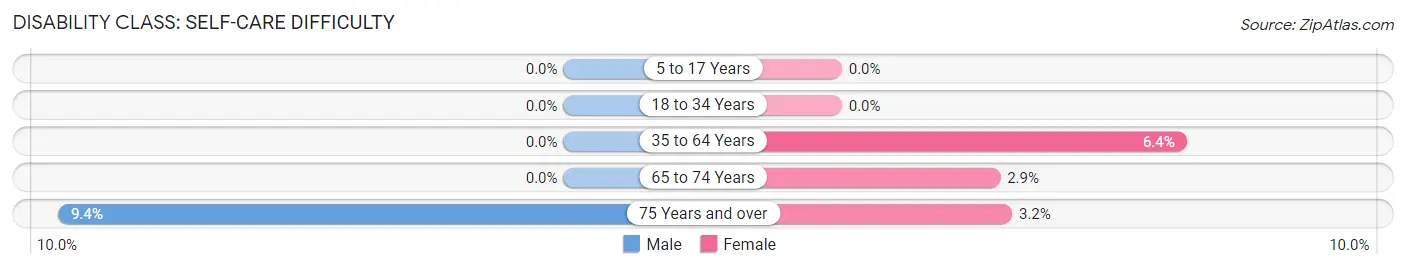
| Age Bracket | Male | Female |
| 5 to 17 Years | 0 (0.0%) | 0 (0.0%) |
| 18 to 34 Years | 0 (0.0%) | 0 (0.0%) |
| 35 to 64 Years | 0 (0.0%) | 8 (6.4%) |
| 65 to 74 Years | 0 (0.0%) | 2 (2.9%) |
| 75 Years and over | 3 (9.4%) | 3 (3.2%) |
Technology Access in West Lebanon
Computing Device Access in West Lebanon
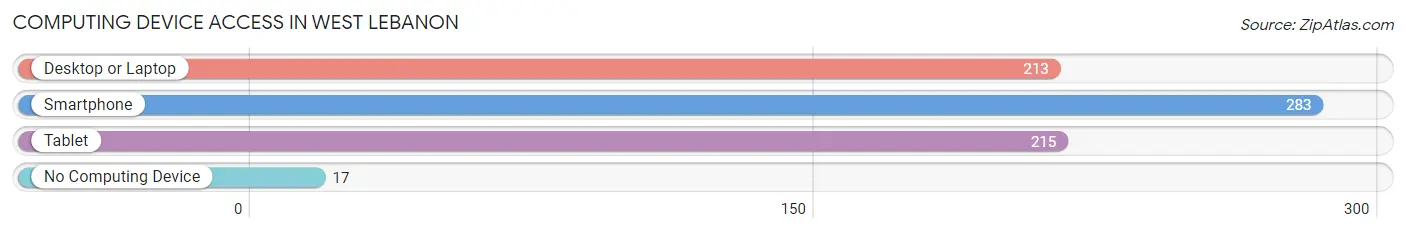
| Device Type | # Households | % Households |
| Desktop or Laptop | 213 | 64.5% |
| Smartphone | 283 | 85.8% |
| Tablet | 215 | 65.1% |
| No Computing Device | 17 | 5.1% |
| Total | 330 | 100.0% |
Internet Access in West Lebanon
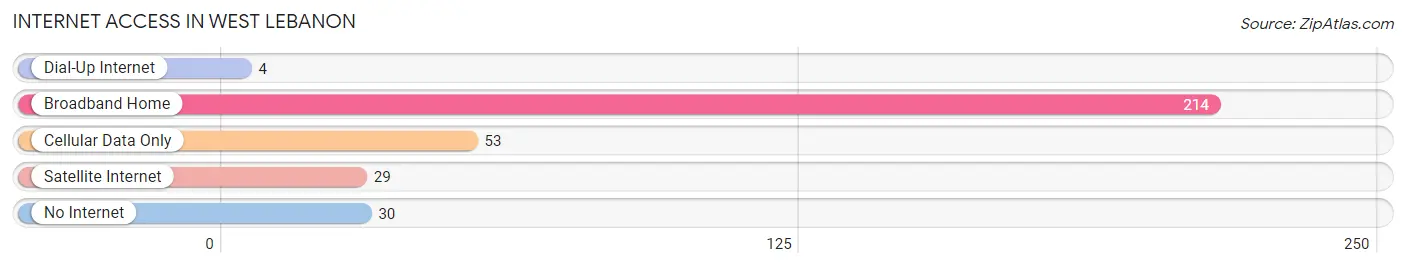
| Internet Type | # Households | % Households |
| Dial-Up Internet | 4 | 1.2% |
| Broadband Home | 214 | 64.8% |
| Cellular Data Only | 53 | 16.1% |
| Satellite Internet | 29 | 8.8% |
| No Internet | 30 | 9.1% |
| Total | 330 | 100.0% |
West Lebanon Summary
Lebanon is a small town located in the state of Indiana, in the United States. It is situated in the northwest corner of the state, in Warren County. The town is located on the banks of the Wabash River, and is part of the Lafayette metropolitan area. The population of West Lebanon was 1,845 at the 2010 census.
History
West Lebanon was founded in 1837 by a group of settlers from Lebanon, Ohio. The town was originally known as Lebanon, but the name was changed to West Lebanon in 1845 to avoid confusion with the town of Lebanon in Boone County. The town was incorporated in 1867.
The town was an important stop on the Wabash and Erie Canal, which was built in the early 19th century. The canal was used to transport goods and people between the Great Lakes and the Ohio River. The canal was abandoned in the late 19th century, but the town still retains its historic charm.
Geography
West Lebanon is located at 40°25'25"N, 86°51'45"W (40.423, -86.862). The town is situated on the banks of the Wabash River, and is part of the Lafayette metropolitan area. The town is located in the northwest corner of the state, in Warren County.
The town has a total area of 1.2 square miles, all of which is land. The town is located in a rural area, and is surrounded by farmland.
Economy
West Lebanon is a small, rural town, and the economy is largely based on agriculture. The town is home to several small businesses, including a grocery store, a hardware store, and a few restaurants.
The town is also home to a few manufacturing companies, including a plastics manufacturer and a metal fabrication company. The town is also home to a few small technology companies, including a software development company and a web design firm.
Demographics
As of the 2010 census, the population of West Lebanon was 1,845. The racial makeup of the town was 97.3% White, 0.7% African American, 0.2% Native American, 0.2% Asian, 0.2% from other races, and 1.4% from two or more races. Hispanic or Latino of any race were 1.2% of the population.
The median income for a household in the town was $41,250, and the median income for a family was $50,000. The per capita income for the town was $20,845. About 8.3% of families and 10.2% of the population were below the poverty line, including 14.3% of those under age 18 and 6.2% of those age 65 or over.
West Lebanon is a small, rural town with a rich history and a strong sense of community. The town is home to a variety of businesses, and the economy is largely based on agriculture. The town is also home to a few small technology companies, and the population is diverse. West Lebanon is a great place to live and work, and is a great example of small-town America.
Common Questions
What is Per Capita Income in West Lebanon?
Per Capita income in West Lebanon is $35,100.
What is the Median Family Income in West Lebanon?
Median Family Income in West Lebanon is $100,833.
What is the Median Household income in West Lebanon?
Median Household Income in West Lebanon is $74,500.
What is Income or Wage Gap in West Lebanon?
Income or Wage Gap in West Lebanon is 35.9%.
Women in West Lebanon earn 64.1 cents for every dollar earned by a man.
What is Inequality or Gini Index in West Lebanon?
Inequality or Gini Index in West Lebanon is 0.34.
What is the Total Population of West Lebanon?
Total Population of West Lebanon is 773.
What is the Total Male Population of West Lebanon?
Total Male Population of West Lebanon is 360.
What is the Total Female Population of West Lebanon?
Total Female Population of West Lebanon is 413.
What is the Ratio of Males per 100 Females in West Lebanon?
There are 87.17 Males per 100 Females in West Lebanon.
What is the Ratio of Females per 100 Males in West Lebanon?
There are 114.72 Females per 100 Males in West Lebanon.
What is the Median Population Age in West Lebanon?
Median Population Age in West Lebanon is 53.1 Years.
What is the Average Family Size in West Lebanon
Average Family Size in West Lebanon is 2.9 People.
What is the Average Household Size in West Lebanon
Average Household Size in West Lebanon is 2.3 People.
How Large is the Labor Force in West Lebanon?
There are 414 People in the Labor Forcein in West Lebanon.
What is the Percentage of People in the Labor Force in West Lebanon?
58.7% of People are in the Labor Force in West Lebanon.
What is the Unemployment Rate in West Lebanon?
Unemployment Rate in West Lebanon is 12.6%.