Veedersburg, IN Map & Demographics
Veedersburg Map
Veedersburg Overview
$29,524
PER CAPITA INCOME
$59,444
AVG FAMILY INCOME
$48,750
AVG HOUSEHOLD INCOME
28.4%
WAGE / INCOME GAP [ % ]
71.6¢/ $1
WAGE / INCOME GAP [ $ ]
0.45
INEQUALITY / GINI INDEX
1,948
TOTAL POPULATION
962
MALE POPULATION
986
FEMALE POPULATION
97.57
MALES / 100 FEMALES
102.49
FEMALES / 100 MALES
47.4
MEDIAN AGE
2.5
AVG FAMILY SIZE
2.2
AVG HOUSEHOLD SIZE
911
LABOR FORCE [ PEOPLE ]
57.1%
PERCENT IN LABOR FORCE
9.0%
UNEMPLOYMENT RATE
Veedersburg Zip Codes
Veedersburg Area Codes
Income in Veedersburg
Income Overview in Veedersburg
Per Capita Income in Veedersburg is $29,524, while median incomes of families and households are $59,444 and $48,750 respectively.
| Characteristic | Number | Measure |
| Per Capita Income | 1,948 | $29,524 |
| Median Family Income | 642 | $59,444 |
| Mean Family Income | 642 | $76,352 |
| Median Household Income | 865 | $48,750 |
| Mean Household Income | 865 | $66,456 |
| Income Deficit | 642 | $0 |
| Wage / Income Gap (%) | 1,948 | 28.36% |
| Wage / Income Gap ($) | 1,948 | 71.64¢ per $1 |
| Gini / Inequality Index | 1,948 | 0.45 |
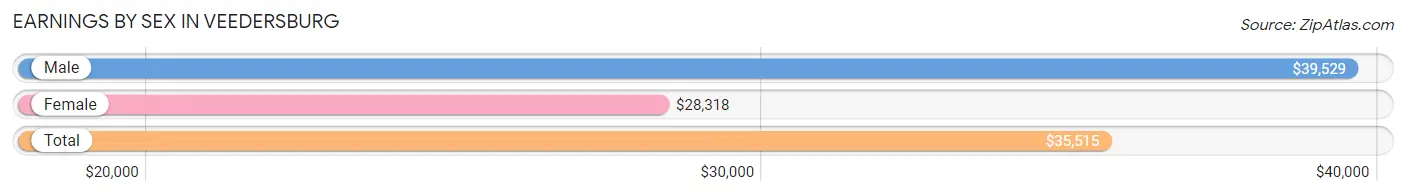
Earnings by Sex in Veedersburg
Average Earnings in Veedersburg are $35,515, $39,529 for men and $28,318 for women, a difference of 28.4%.
| Sex | Number | Average Earnings |
| Male | 506 (54.1%) | $39,529 |
| Female | 430 (45.9%) | $28,318 |
| Total | 936 (100.0%) | $35,515 |
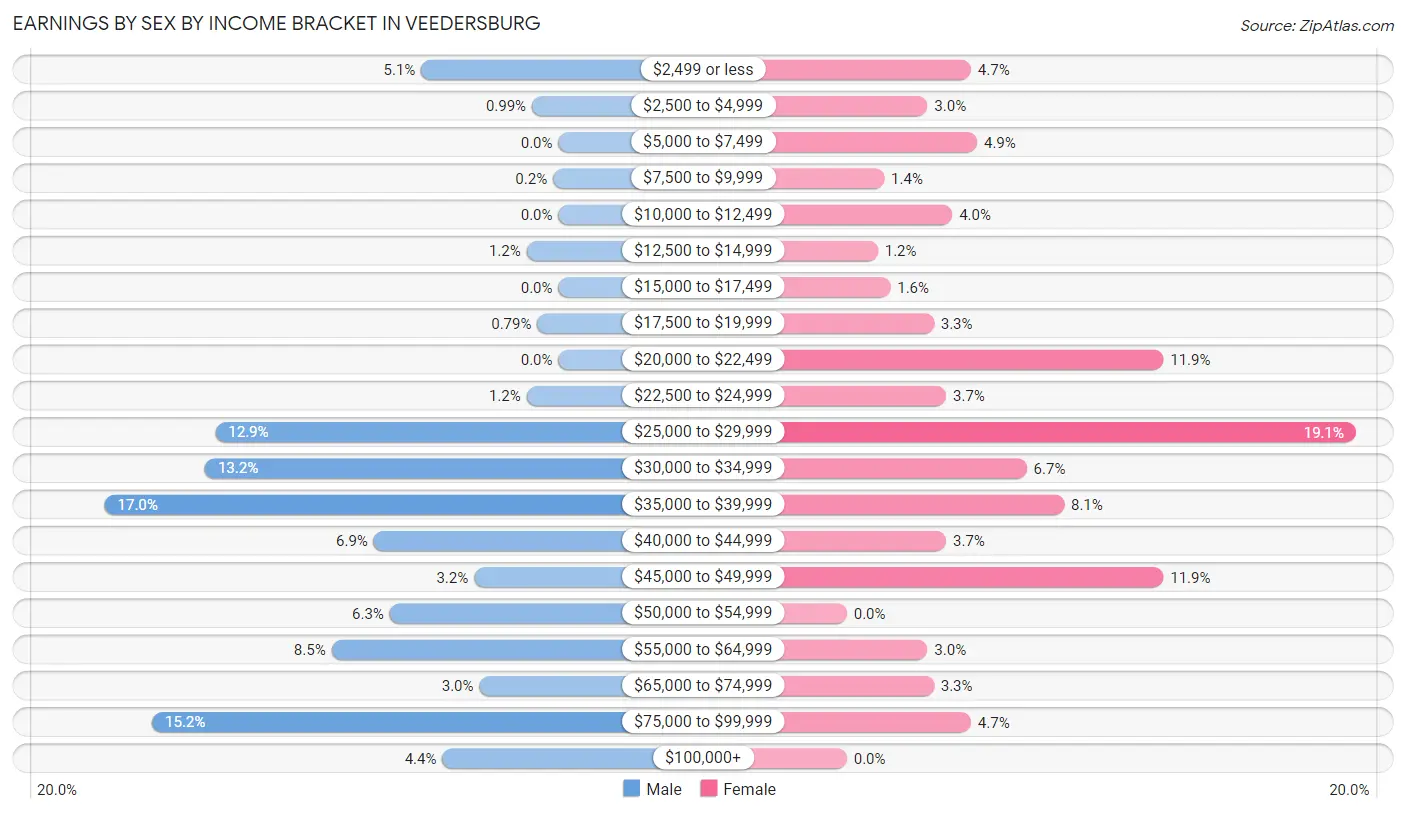
Earnings by Sex by Income Bracket in Veedersburg
The most common earnings brackets in Veedersburg are $35,000 to $39,999 for men (86 | 17.0%) and $25,000 to $29,999 for women (82 | 19.1%).
| Income | Male | Female |
| $2,499 or less | 26 (5.1%) | 20 (4.6%) |
| $2,500 to $4,999 | 5 (1.0%) | 13 (3.0%) |
| $5,000 to $7,499 | 0 (0.0%) | 21 (4.9%) |
| $7,500 to $9,999 | 1 (0.2%) | 6 (1.4%) |
| $10,000 to $12,499 | 0 (0.0%) | 17 (4.0%) |
| $12,500 to $14,999 | 6 (1.2%) | 5 (1.2%) |
| $15,000 to $17,499 | 0 (0.0%) | 7 (1.6%) |
| $17,500 to $19,999 | 4 (0.8%) | 14 (3.3%) |
| $20,000 to $22,499 | 0 (0.0%) | 51 (11.9%) |
| $22,500 to $24,999 | 6 (1.2%) | 16 (3.7%) |
| $25,000 to $29,999 | 65 (12.9%) | 82 (19.1%) |
| $30,000 to $34,999 | 67 (13.2%) | 29 (6.7%) |
| $35,000 to $39,999 | 86 (17.0%) | 35 (8.1%) |
| $40,000 to $44,999 | 35 (6.9%) | 16 (3.7%) |
| $45,000 to $49,999 | 16 (3.2%) | 51 (11.9%) |
| $50,000 to $54,999 | 32 (6.3%) | 0 (0.0%) |
| $55,000 to $64,999 | 43 (8.5%) | 13 (3.0%) |
| $65,000 to $74,999 | 15 (3.0%) | 14 (3.3%) |
| $75,000 to $99,999 | 77 (15.2%) | 20 (4.6%) |
| $100,000+ | 22 (4.3%) | 0 (0.0%) |
| Total | 506 (100.0%) | 430 (100.0%) |
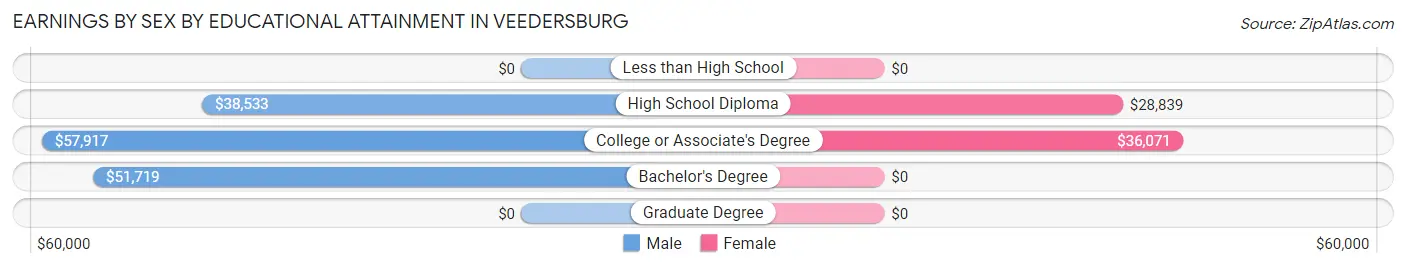
Earnings by Sex by Educational Attainment in Veedersburg
Average earnings in Veedersburg are $39,764 for men and $29,273 for women, a difference of 26.4%. Men with an educational attainment of college or associate's degree enjoy the highest average annual earnings of $57,917, while those with high school diploma education earn the least with $38,533. Women with an educational attainment of college or associate's degree earn the most with the average annual earnings of $36,071, while those with high school diploma education have the smallest earnings of $28,839.
| Educational Attainment | Male Income | Female Income |
| Less than High School | - | - |
| High School Diploma | $38,533 | $28,839 |
| College or Associate's Degree | $57,917 | $36,071 |
| Bachelor's Degree | $51,719 | $0 |
| Graduate Degree | - | - |
| Total | $39,764 | $29,273 |
Family Income in Veedersburg
Family Income Brackets in Veedersburg
According to the Veedersburg family income data, there are 136 families falling into the $35,000 to $49,999 income range, which is the most common income bracket and makes up 21.2% of all families. Conversely, the $10,000 to $14,999 income bracket is the least frequent group with only 13 families (2.0%) belonging to this category.
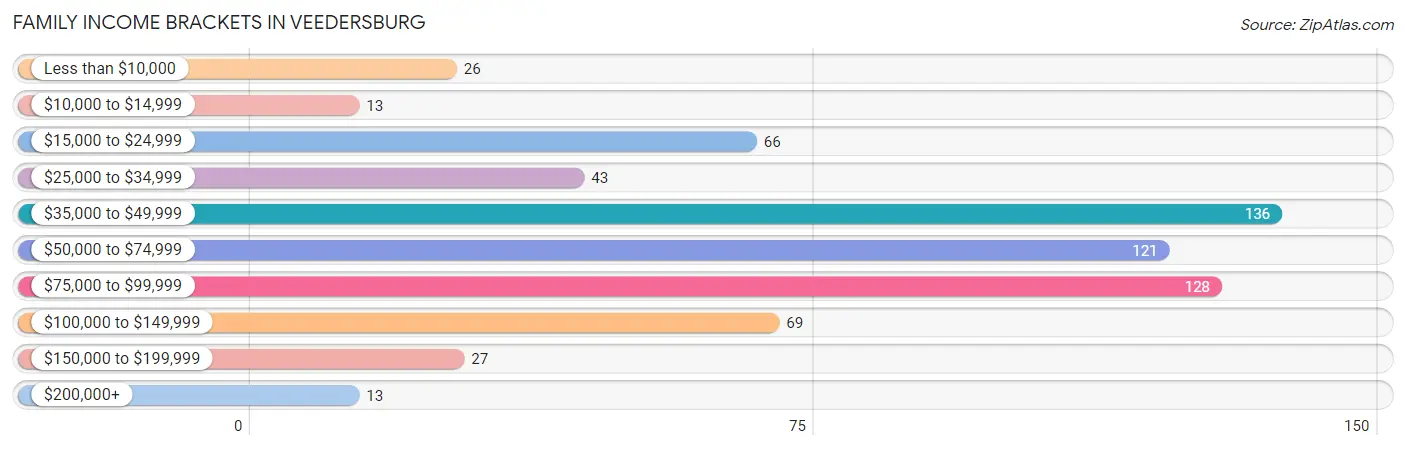
| Income Bracket | # Families | % Families |
| Less than $10,000 | 26 | 4.0% |
| $10,000 to $14,999 | 13 | 2.0% |
| $15,000 to $24,999 | 66 | 10.3% |
| $25,000 to $34,999 | 43 | 6.7% |
| $35,000 to $49,999 | 136 | 21.2% |
| $50,000 to $74,999 | 121 | 18.8% |
| $75,000 to $99,999 | 128 | 19.9% |
| $100,000 to $149,999 | 69 | 10.7% |
| $150,000 to $199,999 | 27 | 4.2% |
| $200,000+ | 13 | 2.0% |
Family Income by Famaliy Size in Veedersburg
2-person families (392 | 61.1%) account for the highest median family income in Veedersburg with $63,550 per family, while 2-person families (392 | 61.1%) have the highest median income of $31,775 per family member.
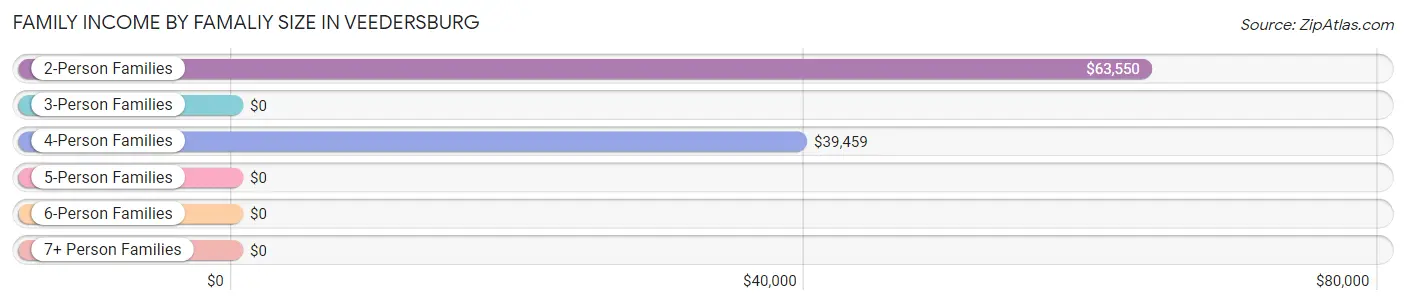
| Income Bracket | # Families | Median Income |
| 2-Person Families | 392 (61.1%) | $63,550 |
| 3-Person Families | 132 (20.6%) | $0 |
| 4-Person Families | 105 (16.4%) | $39,459 |
| 5-Person Families | 13 (2.0%) | $0 |
| 6-Person Families | 0 (0.0%) | $0 |
| 7+ Person Families | 0 (0.0%) | $0 |
| Total | 642 (100.0%) | $59,444 |
Family Income by Number of Earners in Veedersburg
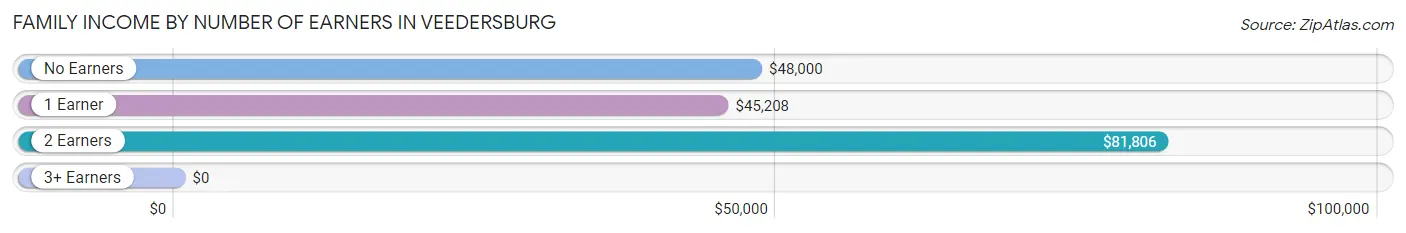
| Number of Earners | # Families | Median Income |
| No Earners | 126 (19.6%) | $48,000 |
| 1 Earner | 289 (45.0%) | $45,208 |
| 2 Earners | 203 (31.6%) | $81,806 |
| 3+ Earners | 24 (3.7%) | $0 |
| Total | 642 (100.0%) | $59,444 |
Household Income in Veedersburg
Household Income Brackets in Veedersburg
With 178 households falling in the category, the $35,000 to $49,999 income range is the most frequent in Veedersburg, accounting for 20.6% of all households. In contrast, only 13 households (1.5%) fall into the $200,000+ income bracket, making it the least populous group.
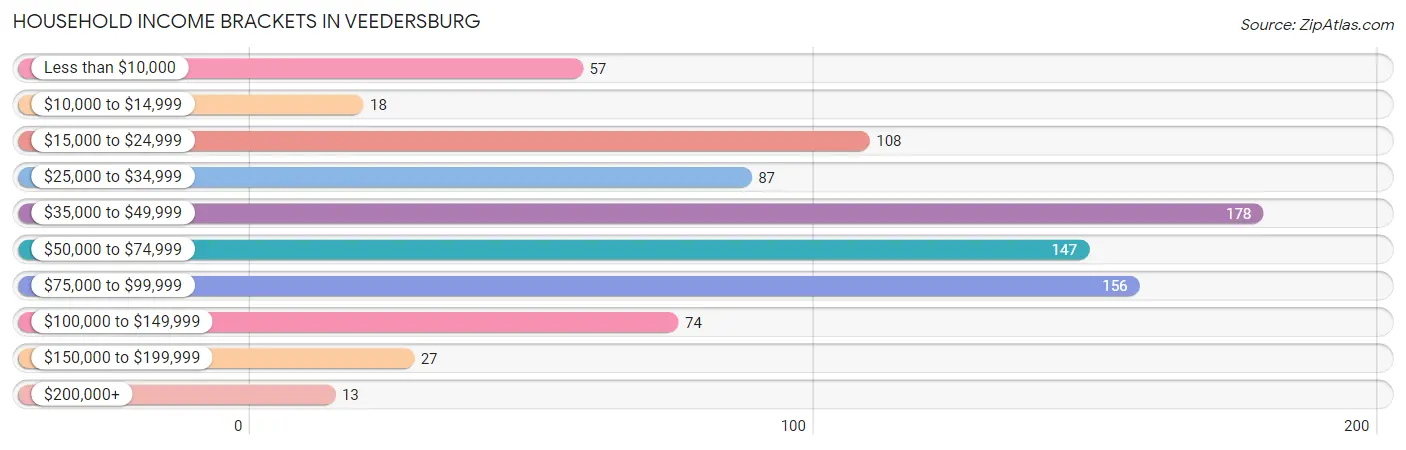
| Income Bracket | # Households | % Households |
| Less than $10,000 | 57 | 6.6% |
| $10,000 to $14,999 | 18 | 2.1% |
| $15,000 to $24,999 | 108 | 12.5% |
| $25,000 to $34,999 | 87 | 10.1% |
| $35,000 to $49,999 | 178 | 20.6% |
| $50,000 to $74,999 | 147 | 17.0% |
| $75,000 to $99,999 | 156 | 18.0% |
| $100,000 to $149,999 | 74 | 8.6% |
| $150,000 to $199,999 | 27 | 3.1% |
| $200,000+ | 13 | 1.5% |
Household Income by Householder Age in Veedersburg
The median household income in Veedersburg is $48,750, with the highest median household income of $73,750 found in the 45 to 64 years age bracket for the primary householder. A total of 313 households (36.2%) fall into this category. Meanwhile, the 15 to 24 years age bracket for the primary householder has the lowest median household income of $0, with 30 households (3.5%) in this group.
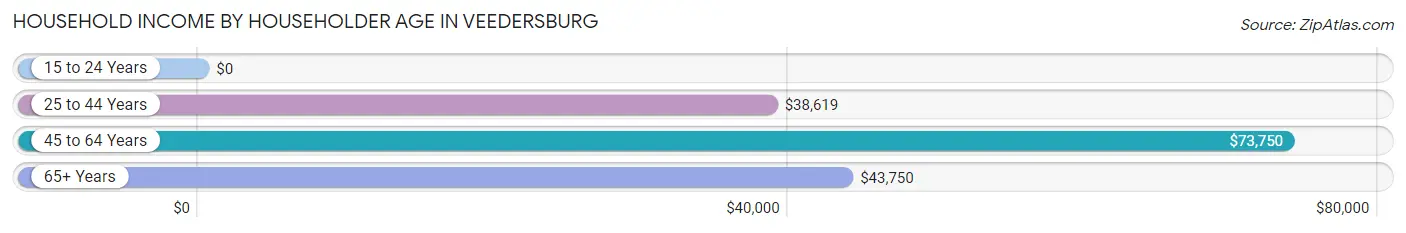
| Income Bracket | # Households | Median Income |
| 15 to 24 Years | 30 (3.5%) | $0 |
| 25 to 44 Years | 236 (27.3%) | $38,619 |
| 45 to 64 Years | 313 (36.2%) | $73,750 |
| 65+ Years | 286 (33.1%) | $43,750 |
| Total | 865 (100.0%) | $48,750 |
Poverty in Veedersburg
Income Below Poverty by Sex and Age in Veedersburg
With 12.5% poverty level for males and 12.3% for females among the residents of Veedersburg, 16 and 17 year old males and 35 to 44 year old females are the most vulnerable to poverty, with 11 males (91.7%) and 43 females (43.9%) in their respective age groups living below the poverty level.
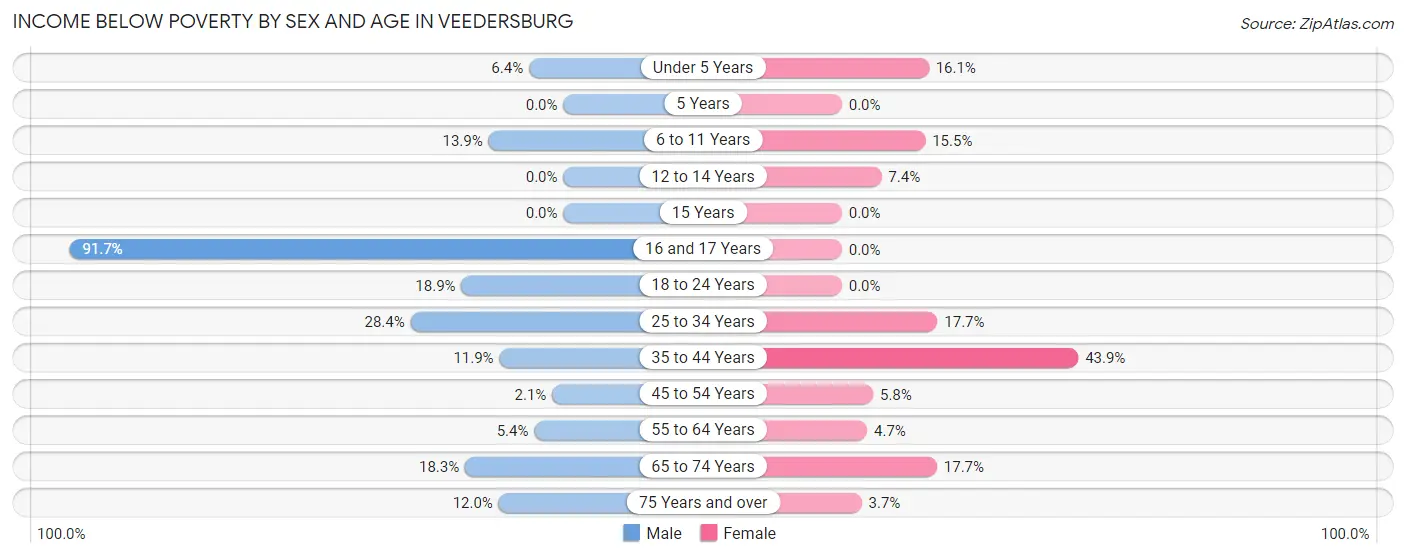
| Age Bracket | Male | Female |
| Under 5 Years | 3 (6.4%) | 5 (16.1%) |
| 5 Years | 0 (0.0%) | 0 (0.0%) |
| 6 to 11 Years | 5 (13.9%) | 11 (15.5%) |
| 12 to 14 Years | 0 (0.0%) | 5 (7.3%) |
| 15 Years | 0 (0.0%) | 0 (0.0%) |
| 16 and 17 Years | 11 (91.7%) | 0 (0.0%) |
| 18 to 24 Years | 7 (18.9%) | 0 (0.0%) |
| 25 to 34 Years | 38 (28.4%) | 11 (17.7%) |
| 35 to 44 Years | 14 (11.9%) | 43 (43.9%) |
| 45 to 54 Years | 3 (2.1%) | 8 (5.8%) |
| 55 to 64 Years | 9 (5.4%) | 7 (4.7%) |
| 65 to 74 Years | 23 (18.2%) | 27 (17.6%) |
| 75 Years and over | 6 (12.0%) | 4 (3.7%) |
| Total | 119 (12.5%) | 121 (12.3%) |
Income Above Poverty by Sex and Age in Veedersburg
According to the poverty statistics in Veedersburg, males aged 12 to 14 years and females aged 15 years are the age groups that are most secure financially, with 100.0% of males and 100.0% of females in these age groups living above the poverty line.
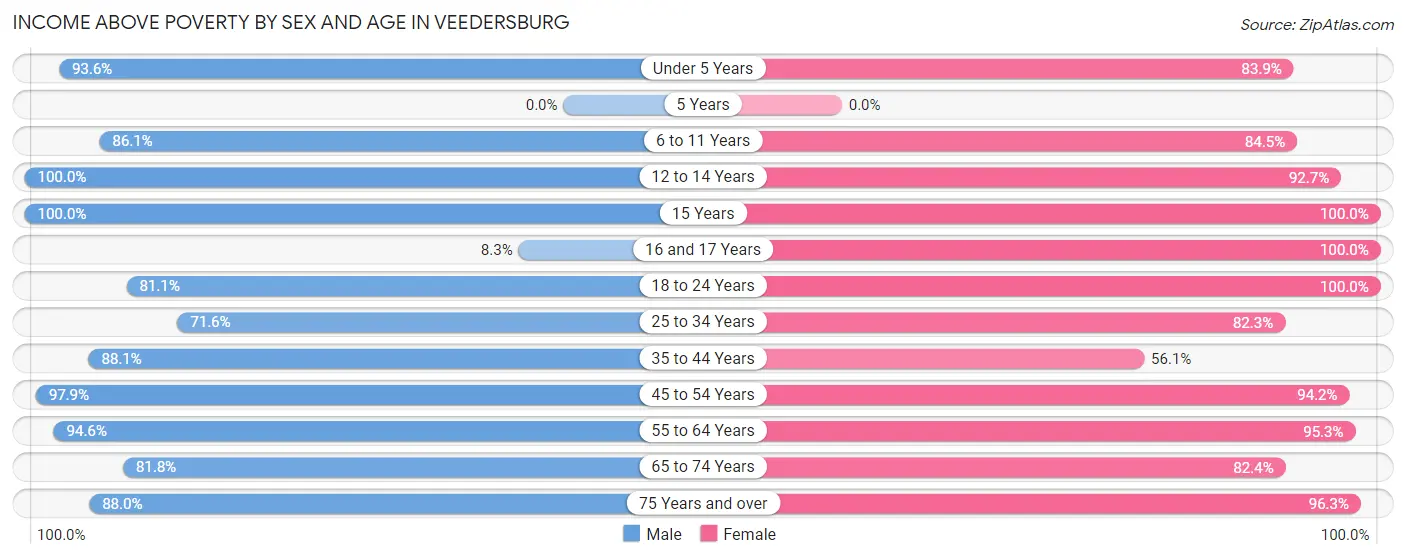
| Age Bracket | Male | Female |
| Under 5 Years | 44 (93.6%) | 26 (83.9%) |
| 5 Years | 0 (0.0%) | 0 (0.0%) |
| 6 to 11 Years | 31 (86.1%) | 60 (84.5%) |
| 12 to 14 Years | 24 (100.0%) | 63 (92.6%) |
| 15 Years | 58 (100.0%) | 3 (100.0%) |
| 16 and 17 Years | 1 (8.3%) | 11 (100.0%) |
| 18 to 24 Years | 30 (81.1%) | 88 (100.0%) |
| 25 to 34 Years | 96 (71.6%) | 51 (82.3%) |
| 35 to 44 Years | 104 (88.1%) | 55 (56.1%) |
| 45 to 54 Years | 141 (97.9%) | 130 (94.2%) |
| 55 to 64 Years | 158 (94.6%) | 142 (95.3%) |
| 65 to 74 Years | 103 (81.8%) | 126 (82.4%) |
| 75 Years and over | 44 (88.0%) | 105 (96.3%) |
| Total | 834 (87.5%) | 860 (87.7%) |
Income Below Poverty Among Married-Couple Families in Veedersburg
The poverty statistics for married-couple families in Veedersburg show that 2.1% or 8 of the total 390 families live below the poverty line. Families with no children have the highest poverty rate of 2.4%, comprising of 8 families. On the other hand, families with 1 or 2 children have the lowest poverty rate of 0.0%, which includes 0 families.
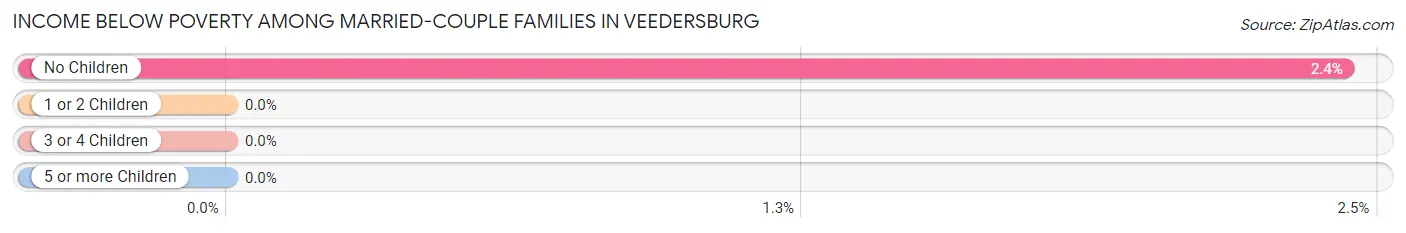
| Children | Above Poverty | Below Poverty |
| No Children | 321 (97.6%) | 8 (2.4%) |
| 1 or 2 Children | 49 (100.0%) | 0 (0.0%) |
| 3 or 4 Children | 12 (100.0%) | 0 (0.0%) |
| 5 or more Children | 0 (0.0%) | 0 (0.0%) |
| Total | 382 (98.0%) | 8 (2.1%) |
Income Below Poverty Among Single-Parent Households in Veedersburg
According to the poverty data in Veedersburg, 25.0% or 31 single-father households and 32.0% or 41 single-mother households are living below the poverty line. Among single-father households, those with 1 or 2 children have the highest poverty rate, with 27 households (62.8%) experiencing poverty. Likewise, among single-mother households, those with 1 or 2 children have the highest poverty rate, with 41 households (48.2%) falling below the poverty line.
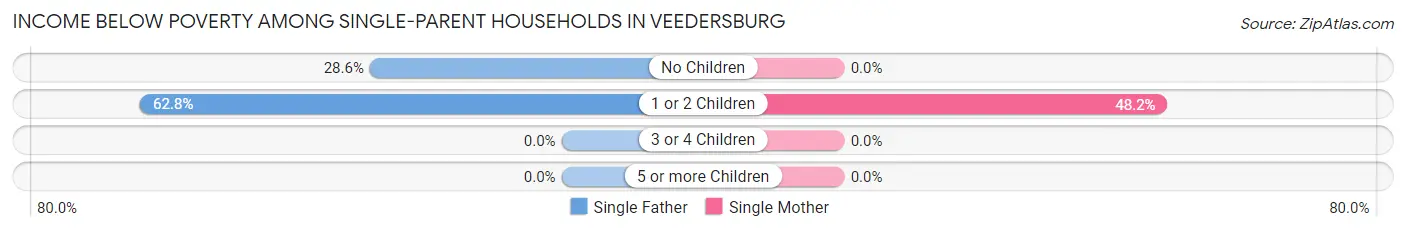
| Children | Single Father | Single Mother |
| No Children | 4 (28.6%) | 0 (0.0%) |
| 1 or 2 Children | 27 (62.8%) | 41 (48.2%) |
| 3 or 4 Children | 0 (0.0%) | 0 (0.0%) |
| 5 or more Children | 0 (0.0%) | 0 (0.0%) |
| Total | 31 (25.0%) | 41 (32.0%) |
Income Below Poverty Among Married-Couple vs Single-Parent Households in Veedersburg
The poverty data for Veedersburg shows that 8 of the married-couple family households (2.1%) and 72 of the single-parent households (28.6%) are living below the poverty level. Within the married-couple family households, those with no children have the highest poverty rate, with 8 households (2.4%) falling below the poverty line. Among the single-parent households, those with 1 or 2 children have the highest poverty rate, with 68 household (53.1%) living below poverty.
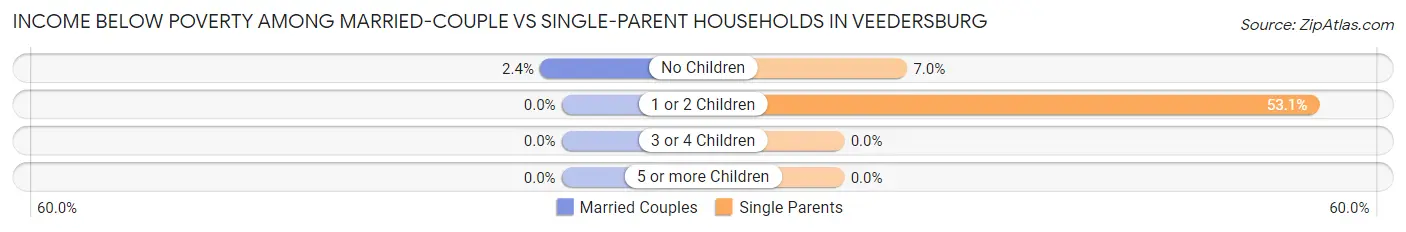
| Children | Married-Couple Families | Single-Parent Households |
| No Children | 8 (2.4%) | 4 (7.0%) |
| 1 or 2 Children | 0 (0.0%) | 68 (53.1%) |
| 3 or 4 Children | 0 (0.0%) | 0 (0.0%) |
| 5 or more Children | 0 (0.0%) | 0 (0.0%) |
| Total | 8 (2.1%) | 72 (28.6%) |
Race in Veedersburg
The most populous races in Veedersburg are White / Caucasian (1,849 | 94.9%), Hispanic or Latino (86 | 4.4%), and Two or more Races (86 | 4.4%).
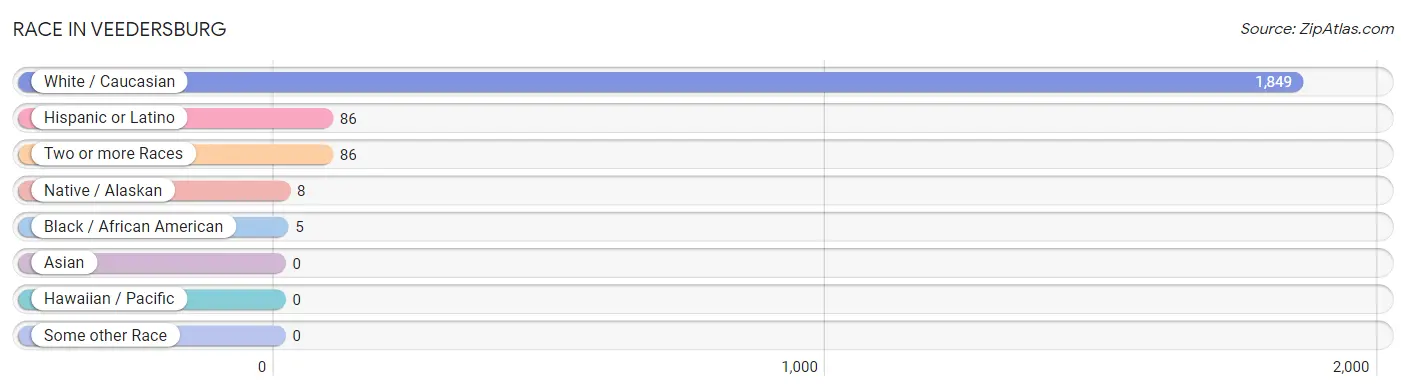
| Race | # Population | % Population |
| Asian | 0 | 0.0% |
| Black / African American | 5 | 0.3% |
| Hawaiian / Pacific | 0 | 0.0% |
| Hispanic or Latino | 86 | 4.4% |
| Native / Alaskan | 8 | 0.4% |
| White / Caucasian | 1,849 | 94.9% |
| Two or more Races | 86 | 4.4% |
| Some other Race | 0 | 0.0% |
| Total | 1,948 | 100.0% |
Ancestry in Veedersburg
The most populous ancestries reported in Veedersburg are German (378 | 19.4%), Irish (235 | 12.1%), American (194 | 10.0%), English (180 | 9.2%), and French (65 | 3.3%), together accounting for 54.0% of all Veedersburg residents.
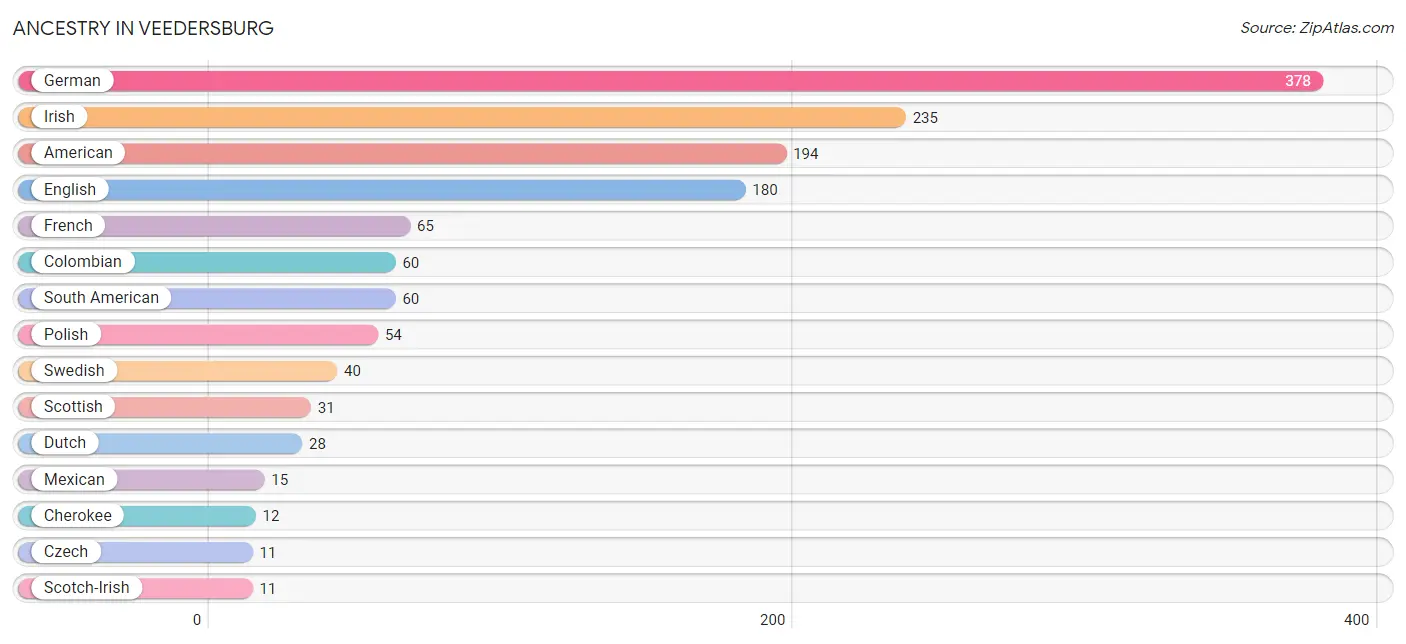
| Ancestry | # Population | % Population |
| American | 194 | 10.0% |
| Austrian | 5 | 0.3% |
| Central American | 3 | 0.2% |
| Cherokee | 12 | 0.6% |
| Colombian | 60 | 3.1% |
| Czech | 11 | 0.6% |
| Dutch | 28 | 1.4% |
| English | 180 | 9.2% |
| French | 65 | 3.3% |
| German | 378 | 19.4% |
| Irish | 235 | 12.1% |
| Italian | 10 | 0.5% |
| Lithuanian | 8 | 0.4% |
| Mexican | 15 | 0.8% |
| Nicaraguan | 3 | 0.2% |
| Polish | 54 | 2.8% |
| Potawatomi | 8 | 0.4% |
| Puerto Rican | 8 | 0.4% |
| Scotch-Irish | 11 | 0.6% |
| Scottish | 31 | 1.6% |
| South American | 60 | 3.1% |
| Swedish | 40 | 2.1% |
| Welsh | 5 | 0.3% | View All 23 Rows |
Immigrants in Veedersburg
The most numerous immigrant groups reported in Veedersburg came from Central America (4 | 0.2%), Latin America (4 | 0.2%), and Mexico (4 | 0.2%), together accounting for 0.6% of all Veedersburg residents.
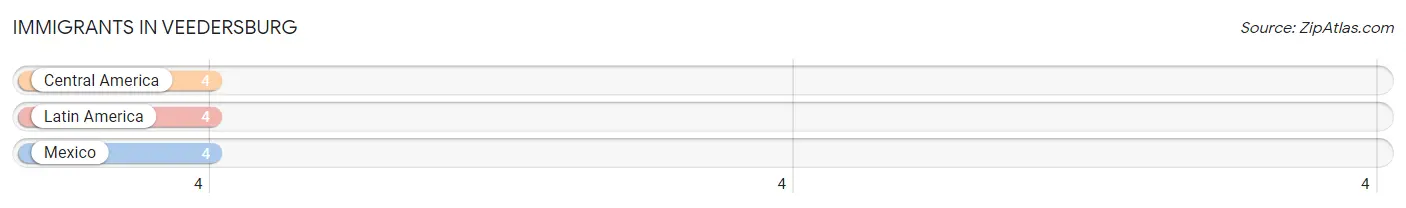
| Immigration Origin | # Population | % Population |
| Central America | 4 | 0.2% |
| Latin America | 4 | 0.2% |
| Mexico | 4 | 0.2% | View All 3 Rows |
Sex and Age in Veedersburg
Sex and Age in Veedersburg
The most populous age groups in Veedersburg are 45 to 49 Years (112 | 11.6%) for men and 55 to 59 Years (117 | 11.9%) for women.
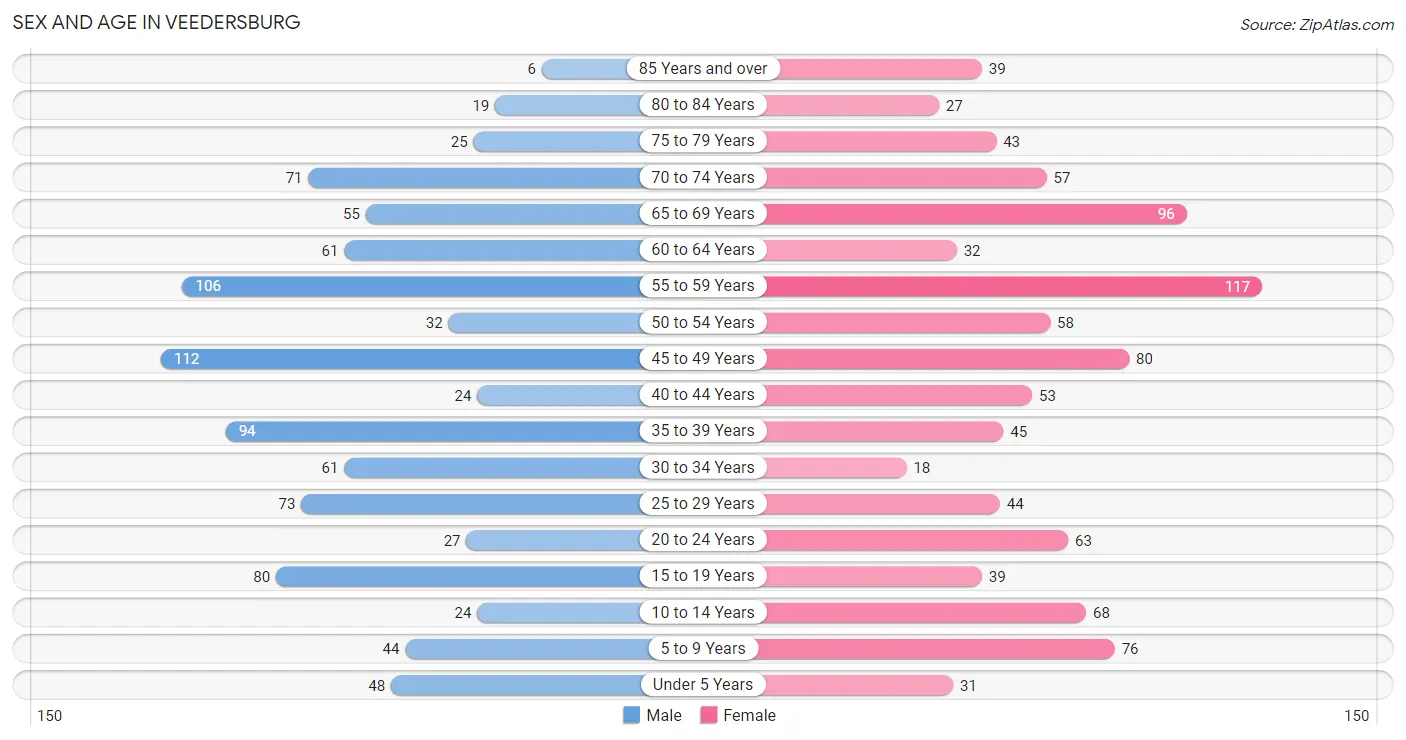
| Age Bracket | Male | Female |
| Under 5 Years | 48 (5.0%) | 31 (3.1%) |
| 5 to 9 Years | 44 (4.6%) | 76 (7.7%) |
| 10 to 14 Years | 24 (2.5%) | 68 (6.9%) |
| 15 to 19 Years | 80 (8.3%) | 39 (4.0%) |
| 20 to 24 Years | 27 (2.8%) | 63 (6.4%) |
| 25 to 29 Years | 73 (7.6%) | 44 (4.5%) |
| 30 to 34 Years | 61 (6.3%) | 18 (1.8%) |
| 35 to 39 Years | 94 (9.8%) | 45 (4.6%) |
| 40 to 44 Years | 24 (2.5%) | 53 (5.4%) |
| 45 to 49 Years | 112 (11.6%) | 80 (8.1%) |
| 50 to 54 Years | 32 (3.3%) | 58 (5.9%) |
| 55 to 59 Years | 106 (11.0%) | 117 (11.9%) |
| 60 to 64 Years | 61 (6.3%) | 32 (3.3%) |
| 65 to 69 Years | 55 (5.7%) | 96 (9.7%) |
| 70 to 74 Years | 71 (7.4%) | 57 (5.8%) |
| 75 to 79 Years | 25 (2.6%) | 43 (4.4%) |
| 80 to 84 Years | 19 (2.0%) | 27 (2.7%) |
| 85 Years and over | 6 (0.6%) | 39 (4.0%) |
| Total | 962 (100.0%) | 986 (100.0%) |
Families and Households in Veedersburg
Median Family Size in Veedersburg
The median family size in Veedersburg is 2.46 persons per family, with single male/father families (124 | 19.3%) accounting for the largest median family size of 2.63 persons per family. On the other hand, single female/mother families (128 | 19.9%) represent the smallest median family size with 1.87 persons per family.
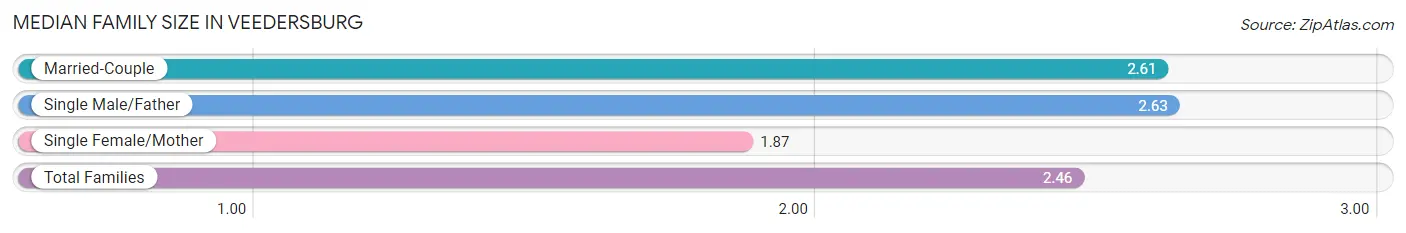
| Family Type | # Families | Family Size |
| Married-Couple | 390 (60.8%) | 2.61 |
| Single Male/Father | 124 (19.3%) | 2.63 |
| Single Female/Mother | 128 (19.9%) | 1.87 |
| Total Families | 642 (100.0%) | 2.46 |
Median Household Size in Veedersburg
The median household size in Veedersburg is 2.25 persons per household, with single male/father households (124 | 14.3%) accounting for the largest median household size of 2.83 persons per household. non-family households (223 | 25.8%) represent the smallest median household size with 1.41 persons per household.
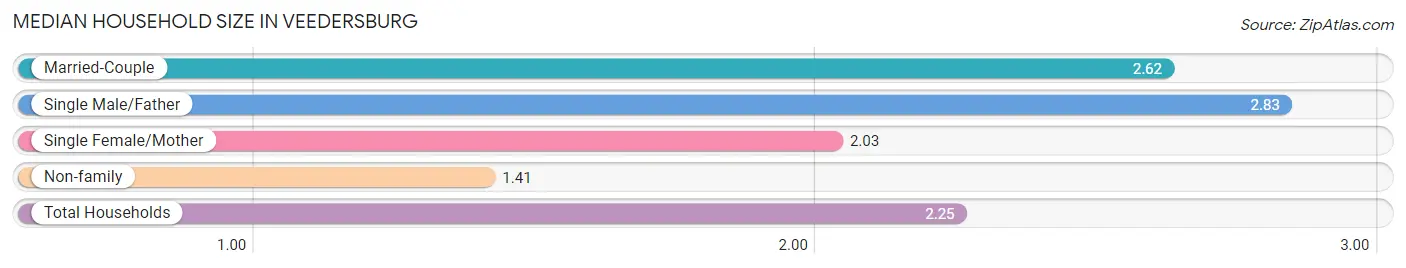
| Household Type | # Households | Household Size |
| Married-Couple | 390 (45.1%) | 2.62 |
| Single Male/Father | 124 (14.3%) | 2.83 |
| Single Female/Mother | 128 (14.8%) | 2.03 |
| Non-family | 223 (25.8%) | 1.41 |
| Total Households | 865 (100.0%) | 2.25 |
Household Size by Marriage Status in Veedersburg
Out of a total of 865 households in Veedersburg, 642 (74.2%) are family households, while 223 (25.8%) are nonfamily households. The most numerous type of family households are 2-person households, comprising 362, and the most common type of nonfamily households are 1-person households, comprising 159.
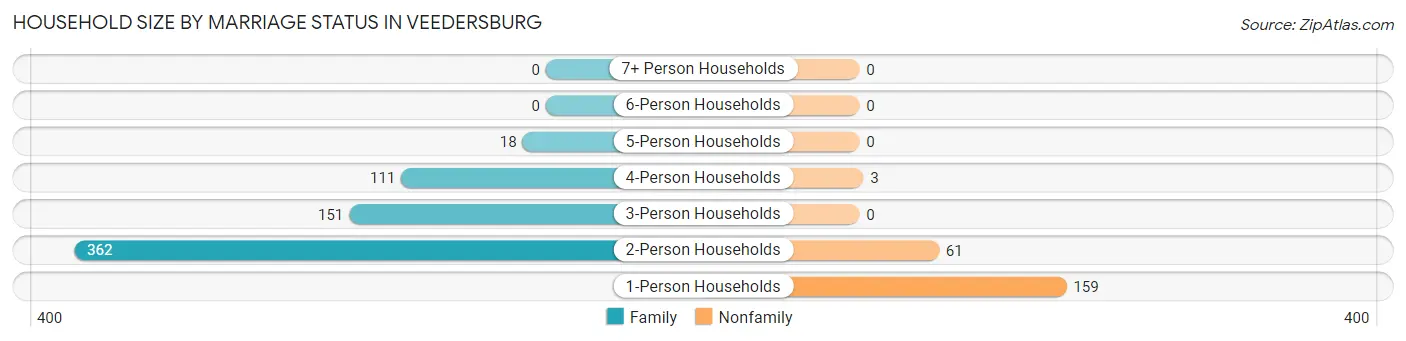
| Household Size | Family Households | Nonfamily Households |
| 1-Person Households | - | 159 (18.4%) |
| 2-Person Households | 362 (41.8%) | 61 (7.0%) |
| 3-Person Households | 151 (17.5%) | 0 (0.0%) |
| 4-Person Households | 111 (12.8%) | 3 (0.4%) |
| 5-Person Households | 18 (2.1%) | 0 (0.0%) |
| 6-Person Households | 0 (0.0%) | 0 (0.0%) |
| 7+ Person Households | 0 (0.0%) | 0 (0.0%) |
| Total | 642 (74.2%) | 223 (25.8%) |
Female Fertility in Veedersburg
Fertility by Age in Veedersburg
Average fertility rate in Veedersburg is 63.0 births per 1,000 women. Women in the age bracket of 20 to 34 years have the highest fertility rate with 136.0 births per 1,000 women. Women in the age bracket of 20 to 34 years acount for 77.3% of all women with births.
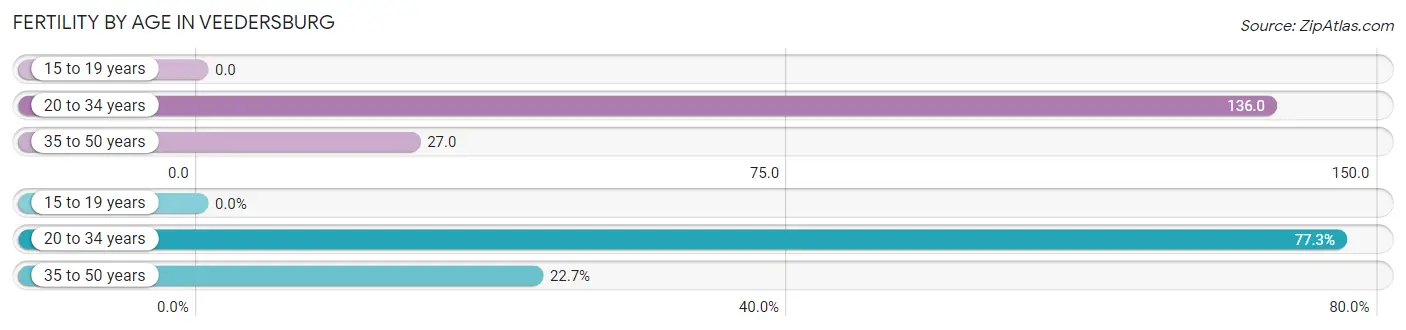
| Age Bracket | Women with Births | Births / 1,000 Women |
| 15 to 19 years | 0 (0.0%) | 0.0 |
| 20 to 34 years | 17 (77.3%) | 136.0 |
| 35 to 50 years | 5 (22.7%) | 27.0 |
| Total | 22 (100.0%) | 63.0 |
Fertility by Age by Marriage Status in Veedersburg
18.2% of women with births (22) in Veedersburg are married. The highest percentage of unmarried women with births falls into 35 to 50 years age bracket with 100.0% of them unmarried at the time of birth, while the lowest percentage of unmarried women with births belong to 20 to 34 years age bracket with 76.5% of them unmarried.
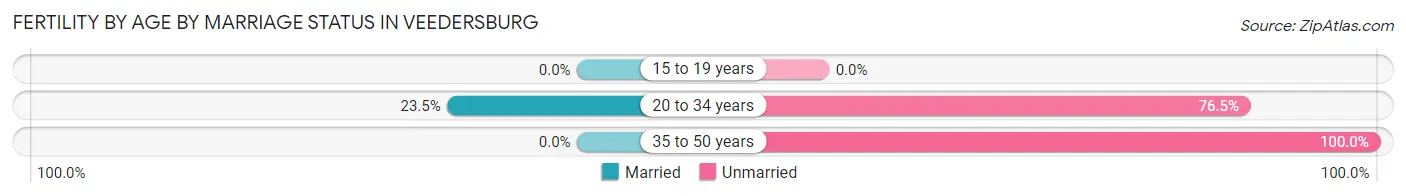
| Age Bracket | Married | Unmarried |
| 15 to 19 years | 0 (0.0%) | 0 (0.0%) |
| 20 to 34 years | 4 (23.5%) | 13 (76.5%) |
| 35 to 50 years | 0 (0.0%) | 5 (100.0%) |
| Total | 4 (18.2%) | 18 (81.8%) |
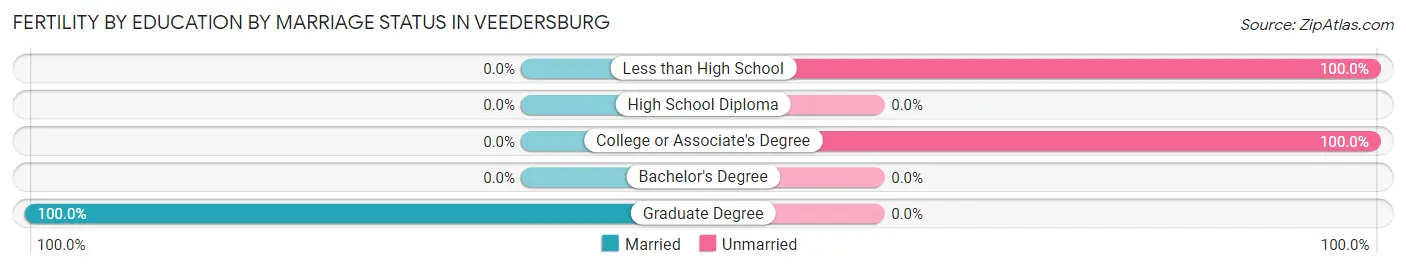
Fertility by Education in Veedersburg
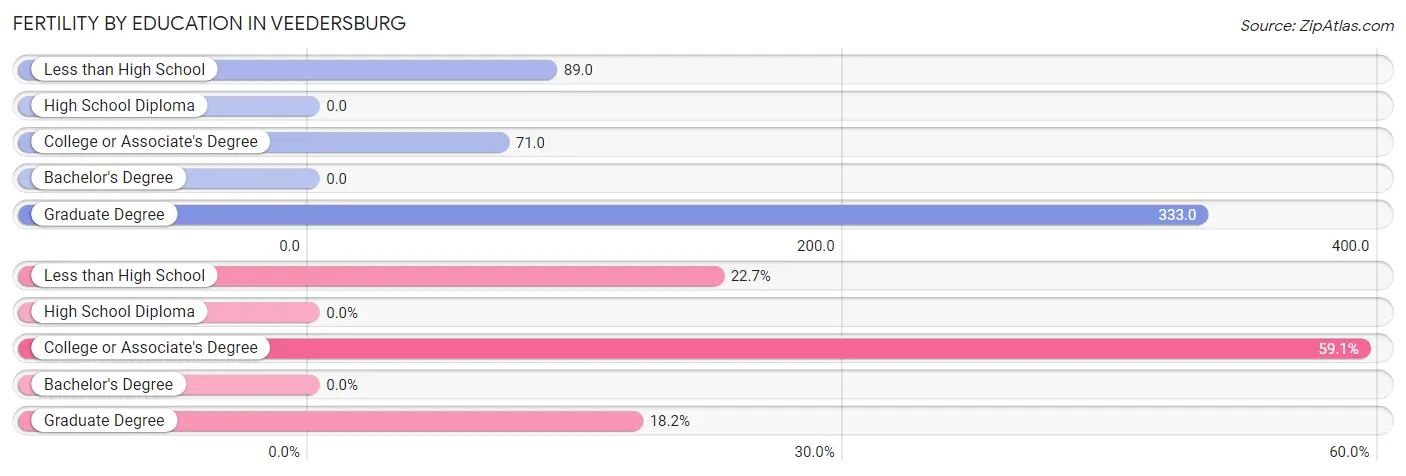
| Educational Attainment | Women with Births | Births / 1,000 Women |
| Less than High School | 5 (22.7%) | 89.0 |
| High School Diploma | 0 (0.0%) | 0.0 |
| College or Associate's Degree | 13 (59.1%) | 71.0 |
| Bachelor's Degree | 0 (0.0%) | 0.0 |
| Graduate Degree | 4 (18.2%) | 333.0 |
| Total | 22 (100.0%) | 63.0 |
Fertility by Education by Marriage Status in Veedersburg
81.8% of women with births in Veedersburg are unmarried. Women with the educational attainment of graduate degree are most likely to be married with 100.0% of them married at childbirth, while women with the educational attainment of less than high school are least likely to be married with 100.0% of them unmarried at childbirth.
| Educational Attainment | Married | Unmarried |
| Less than High School | 0 (0.0%) | 5 (100.0%) |
| High School Diploma | 0 (0.0%) | 0 (0.0%) |
| College or Associate's Degree | 0 (0.0%) | 13 (100.0%) |
| Bachelor's Degree | 0 (0.0%) | 0 (0.0%) |
| Graduate Degree | 4 (100.0%) | 0 (0.0%) |
| Total | 4 (18.2%) | 18 (81.8%) |
Employment Characteristics in Veedersburg
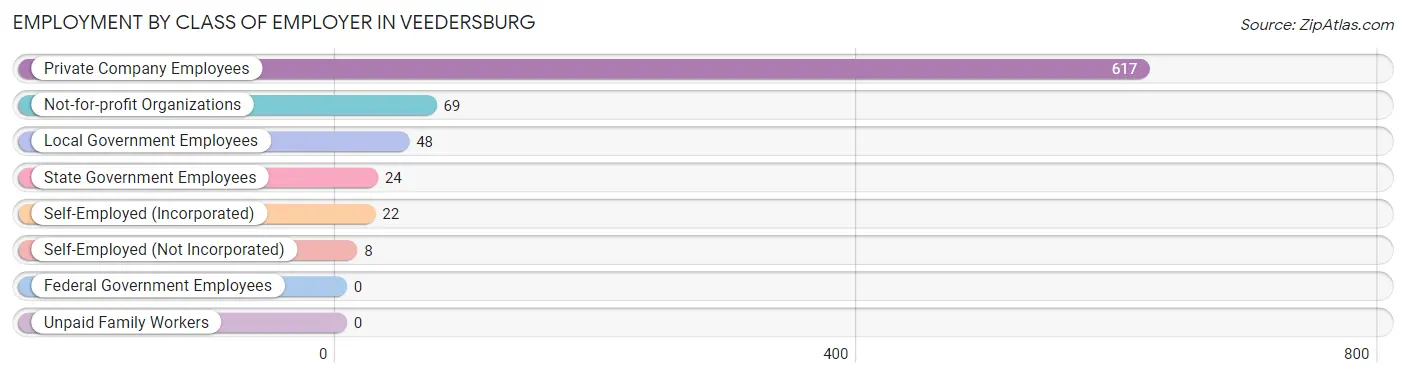
Employment by Class of Employer in Veedersburg
Among the 788 employed individuals in Veedersburg, private company employees (617 | 78.3%), not-for-profit organizations (69 | 8.8%), and local government employees (48 | 6.1%) make up the most common classes of employment.
| Employer Class | # Employees | % Employees |
| Private Company Employees | 617 | 78.3% |
| Self-Employed (Incorporated) | 22 | 2.8% |
| Self-Employed (Not Incorporated) | 8 | 1.0% |
| Not-for-profit Organizations | 69 | 8.8% |
| Local Government Employees | 48 | 6.1% |
| State Government Employees | 24 | 3.0% |
| Federal Government Employees | 0 | 0.0% |
| Unpaid Family Workers | 0 | 0.0% |
| Total | 788 | 100.0% |
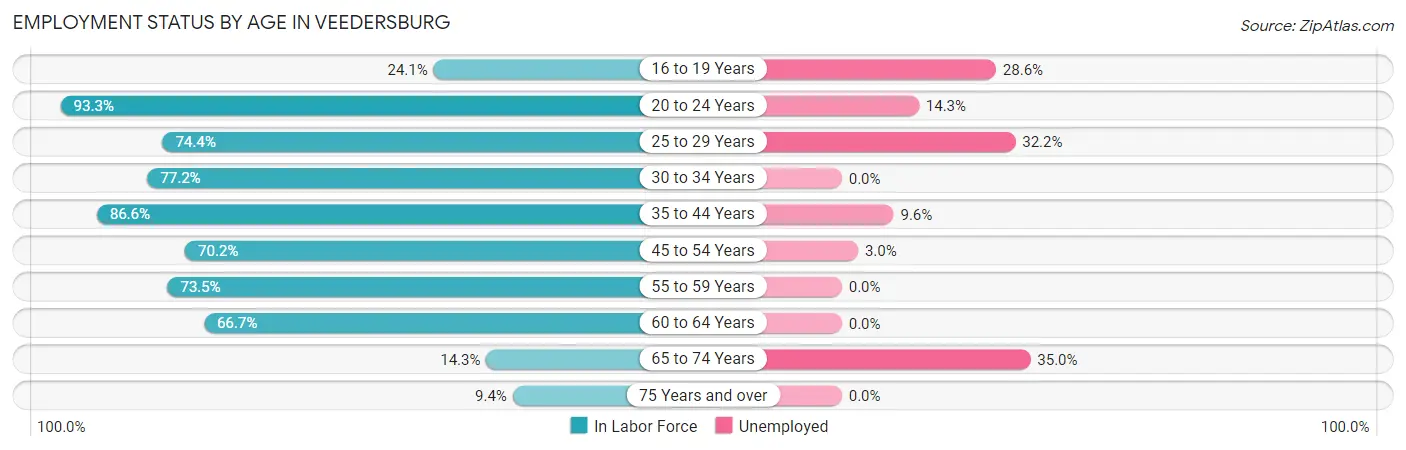
Employment Status by Age in Veedersburg
According to the labor force statistics for Veedersburg, out of the total population over 16 years of age (1,596), 57.1% or 911 individuals are in the labor force, with 9.0% or 82 of them unemployed. The age group with the highest labor force participation rate is 20 to 24 years, with 93.3% or 84 individuals in the labor force. Within the labor force, the 65 to 74 years age range has the highest percentage of unemployed individuals, with 35.0% or 14 of them being unemployed.
| Age Bracket | In Labor Force | Unemployed |
| 16 to 19 Years | 14 (24.1%) | 4 (28.6%) |
| 20 to 24 Years | 84 (93.3%) | 12 (14.3%) |
| 25 to 29 Years | 87 (74.4%) | 28 (32.2%) |
| 30 to 34 Years | 61 (77.2%) | 0 (0.0%) |
| 35 to 44 Years | 187 (86.6%) | 18 (9.6%) |
| 45 to 54 Years | 198 (70.2%) | 6 (3.0%) |
| 55 to 59 Years | 164 (73.5%) | 0 (0.0%) |
| 60 to 64 Years | 62 (66.7%) | 0 (0.0%) |
| 65 to 74 Years | 40 (14.3%) | 14 (35.0%) |
| 75 Years and over | 15 (9.4%) | 0 (0.0%) |
| Total | 911 (57.1%) | 82 (9.0%) |
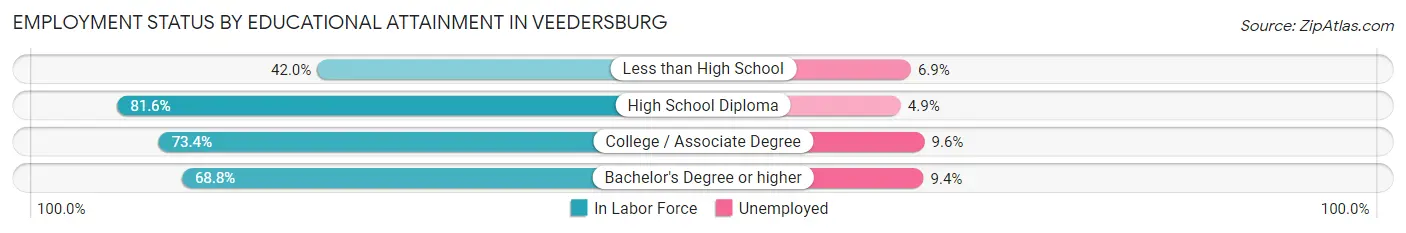
Employment Status by Educational Attainment in Veedersburg
According to labor force statistics for Veedersburg, 75.1% of individuals (759) out of the total population between 25 and 64 years of age (1,010) are in the labor force, with 6.9% or 52 of them being unemployed. The group with the highest labor force participation rate are those with the educational attainment of high school diploma, with 81.6% or 426 individuals in the labor force. Within the labor force, individuals with college / associate degree education have the highest percentage of unemployment, with 9.6% or 24 of them being unemployed.
| Educational Attainment | In Labor Force | Unemployed |
| Less than High School | 29 (42.0%) | 5 (6.9%) |
| High School Diploma | 426 (81.6%) | 26 (4.9%) |
| College / Associate Degree | 251 (73.4%) | 33 (9.6%) |
| Bachelor's Degree or higher | 53 (68.8%) | 7 (9.4%) |
| Total | 759 (75.1%) | 70 (6.9%) |
Employment Occupations by Sex in Veedersburg
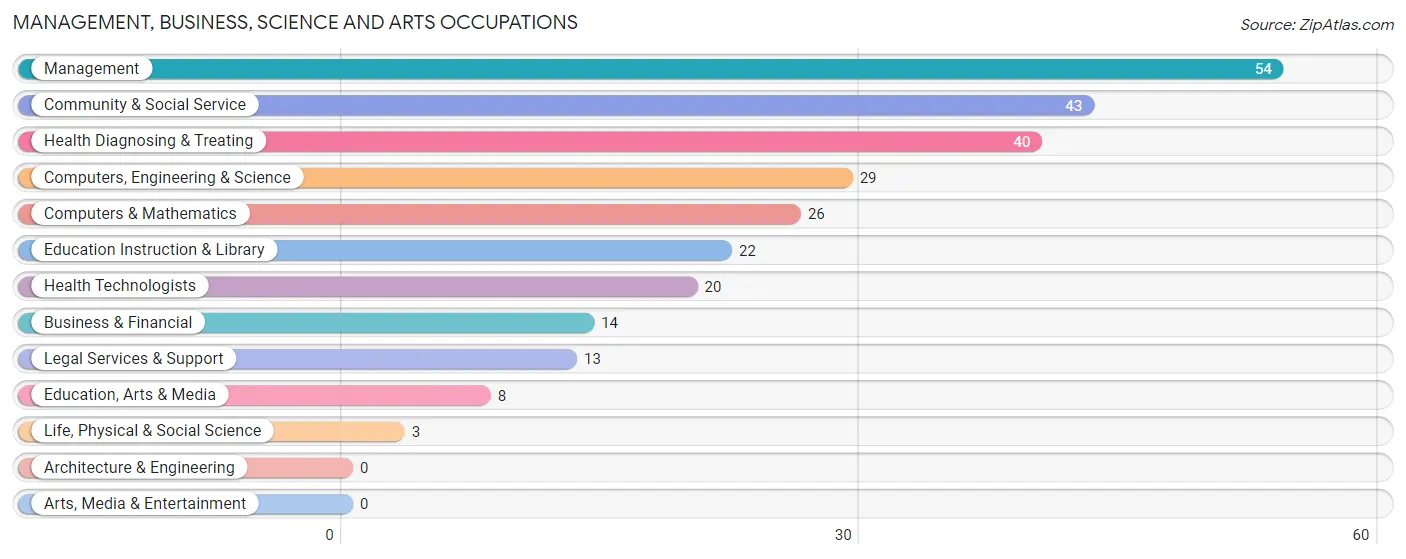
Management, Business, Science and Arts Occupations
The most common Management, Business, Science and Arts occupations in Veedersburg are Management (54 | 6.5%), Community & Social Service (43 | 5.2%), Health Diagnosing & Treating (40 | 4.8%), Computers, Engineering & Science (29 | 3.5%), and Computers & Mathematics (26 | 3.1%).
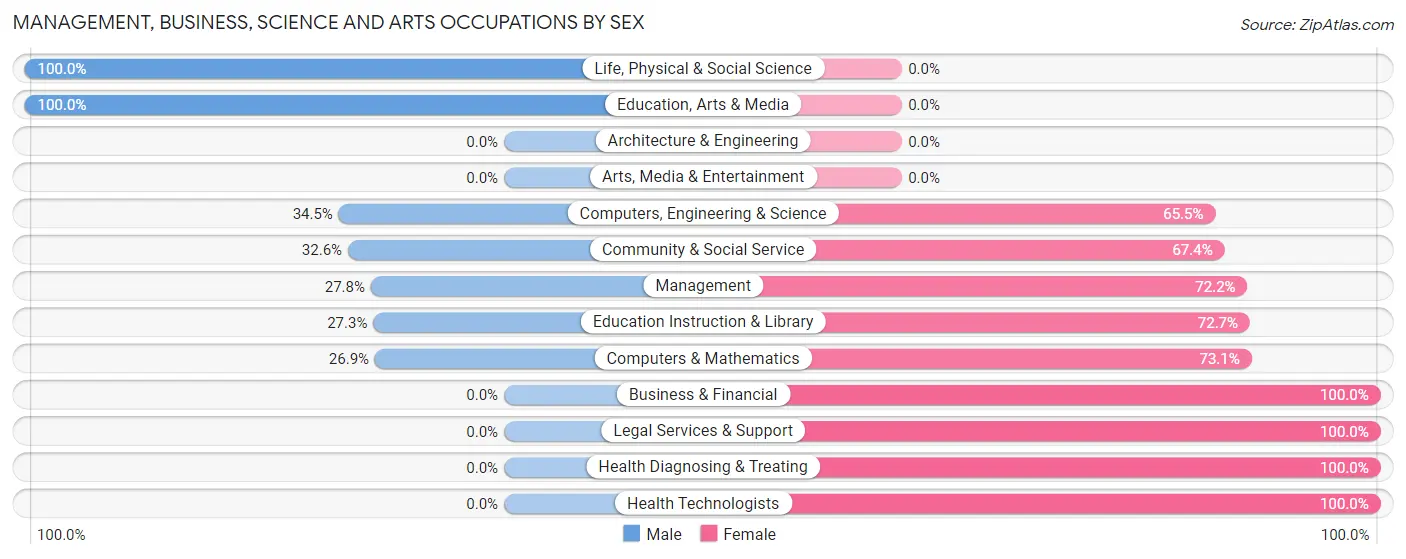
Management, Business, Science and Arts Occupations by Sex
Within the Management, Business, Science and Arts occupations in Veedersburg, the most male-oriented occupations are Life, Physical & Social Science (100.0%), Education, Arts & Media (100.0%), and Computers, Engineering & Science (34.5%), while the most female-oriented occupations are Business & Financial (100.0%), Legal Services & Support (100.0%), and Health Diagnosing & Treating (100.0%).
| Occupation | Male | Female |
| Management | 15 (27.8%) | 39 (72.2%) |
| Business & Financial | 0 (0.0%) | 14 (100.0%) |
| Computers, Engineering & Science | 10 (34.5%) | 19 (65.5%) |
| Computers & Mathematics | 7 (26.9%) | 19 (73.1%) |
| Architecture & Engineering | 0 (0.0%) | 0 (0.0%) |
| Life, Physical & Social Science | 3 (100.0%) | 0 (0.0%) |
| Community & Social Service | 14 (32.6%) | 29 (67.4%) |
| Education, Arts & Media | 8 (100.0%) | 0 (0.0%) |
| Legal Services & Support | 0 (0.0%) | 13 (100.0%) |
| Education Instruction & Library | 6 (27.3%) | 16 (72.7%) |
| Arts, Media & Entertainment | 0 (0.0%) | 0 (0.0%) |
| Health Diagnosing & Treating | 0 (0.0%) | 40 (100.0%) |
| Health Technologists | 0 (0.0%) | 20 (100.0%) |
| Total (Category) | 39 (21.7%) | 141 (78.3%) |
| Total (Overall) | 464 (55.9%) | 366 (44.1%) |
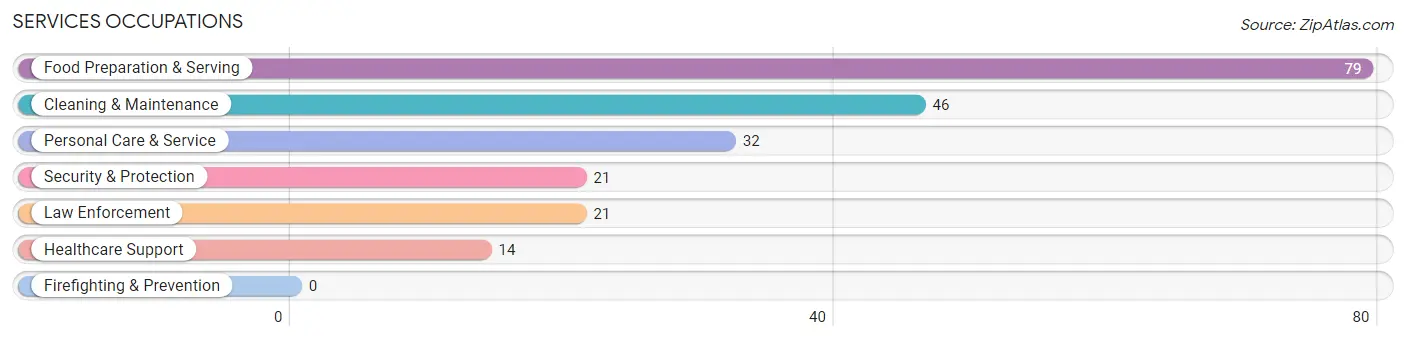
Services Occupations
The most common Services occupations in Veedersburg are Food Preparation & Serving (79 | 9.5%), Cleaning & Maintenance (46 | 5.5%), Personal Care & Service (32 | 3.9%), Security & Protection (21 | 2.5%), and Law Enforcement (21 | 2.5%).
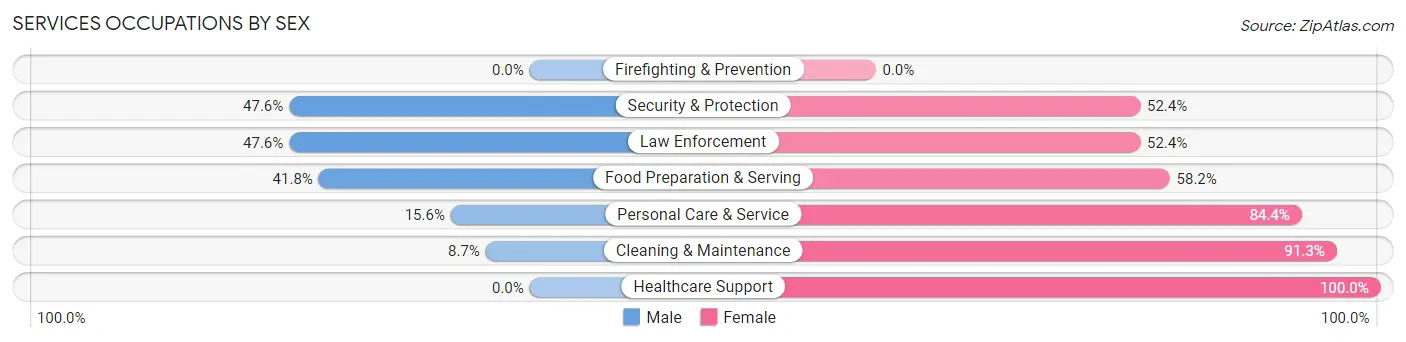
Services Occupations by Sex
Within the Services occupations in Veedersburg, the most male-oriented occupations are Security & Protection (47.6%), Law Enforcement (47.6%), and Food Preparation & Serving (41.8%), while the most female-oriented occupations are Healthcare Support (100.0%), Cleaning & Maintenance (91.3%), and Personal Care & Service (84.4%).
| Occupation | Male | Female |
| Healthcare Support | 0 (0.0%) | 14 (100.0%) |
| Security & Protection | 10 (47.6%) | 11 (52.4%) |
| Firefighting & Prevention | 0 (0.0%) | 0 (0.0%) |
| Law Enforcement | 10 (47.6%) | 11 (52.4%) |
| Food Preparation & Serving | 33 (41.8%) | 46 (58.2%) |
| Cleaning & Maintenance | 4 (8.7%) | 42 (91.3%) |
| Personal Care & Service | 5 (15.6%) | 27 (84.4%) |
| Total (Category) | 52 (27.1%) | 140 (72.9%) |
| Total (Overall) | 464 (55.9%) | 366 (44.1%) |
Sales and Office Occupations
The most common Sales and Office occupations in Veedersburg are Office & Administration (17 | 2.1%), and Sales & Related (13 | 1.6%).
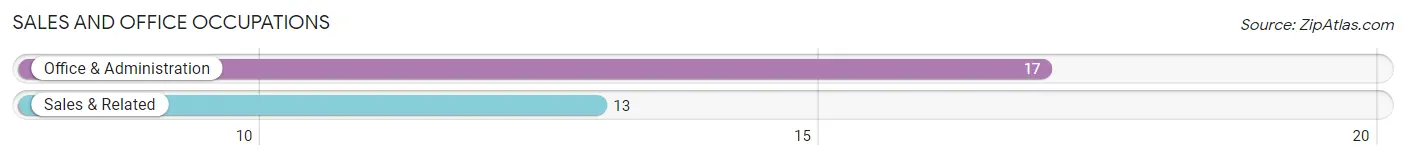
Sales and Office Occupations by Sex
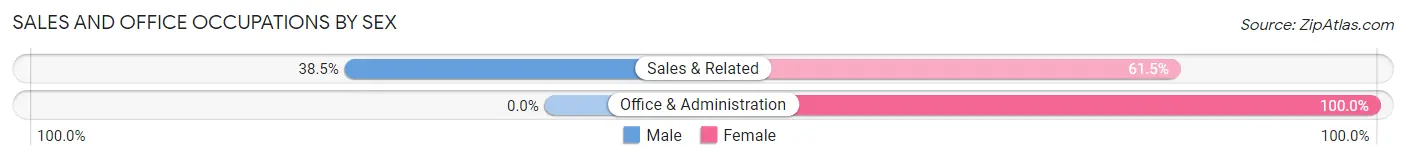
| Occupation | Male | Female |
| Sales & Related | 5 (38.5%) | 8 (61.5%) |
| Office & Administration | 0 (0.0%) | 17 (100.0%) |
| Total (Category) | 5 (16.7%) | 25 (83.3%) |
| Total (Overall) | 464 (55.9%) | 366 (44.1%) |
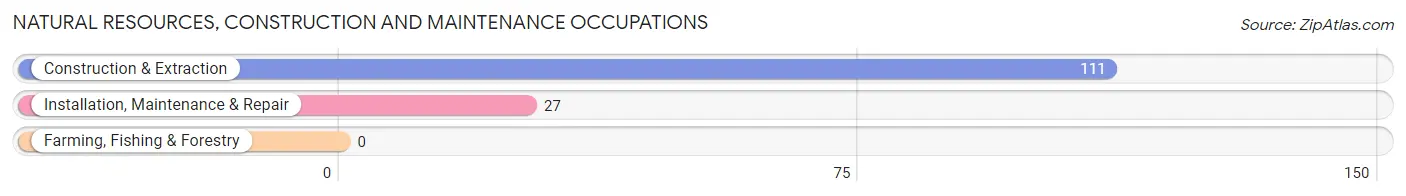
Natural Resources, Construction and Maintenance Occupations
The most common Natural Resources, Construction and Maintenance occupations in Veedersburg are Construction & Extraction (111 | 13.4%), and Installation, Maintenance & Repair (27 | 3.3%).
Natural Resources, Construction and Maintenance Occupations by Sex
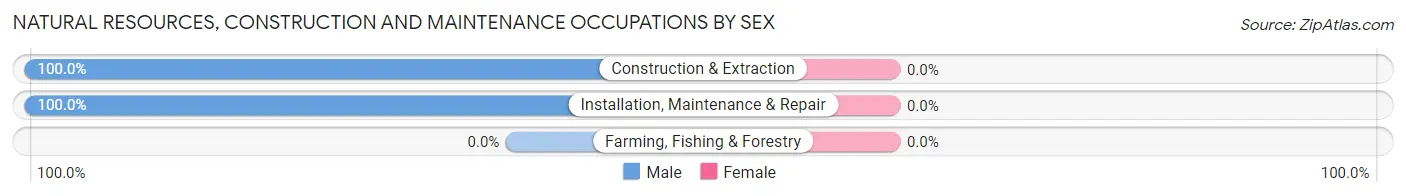
| Occupation | Male | Female |
| Farming, Fishing & Forestry | 0 (0.0%) | 0 (0.0%) |
| Construction & Extraction | 111 (100.0%) | 0 (0.0%) |
| Installation, Maintenance & Repair | 27 (100.0%) | 0 (0.0%) |
| Total (Category) | 138 (100.0%) | 0 (0.0%) |
| Total (Overall) | 464 (55.9%) | 366 (44.1%) |
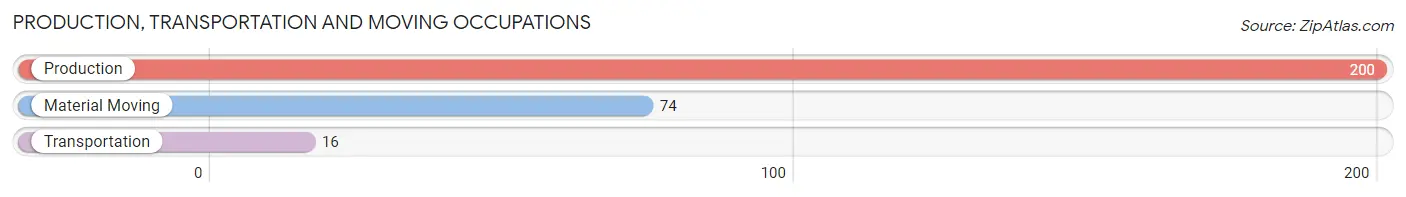
Production, Transportation and Moving Occupations
The most common Production, Transportation and Moving occupations in Veedersburg are Production (200 | 24.1%), Material Moving (74 | 8.9%), and Transportation (16 | 1.9%).
Production, Transportation and Moving Occupations by Sex
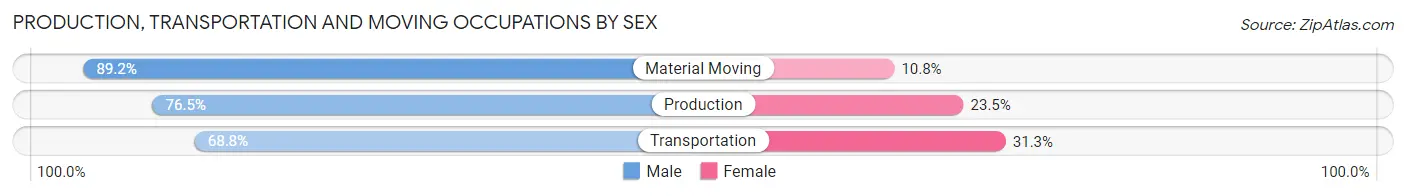
| Occupation | Male | Female |
| Production | 153 (76.5%) | 47 (23.5%) |
| Transportation | 11 (68.8%) | 5 (31.2%) |
| Material Moving | 66 (89.2%) | 8 (10.8%) |
| Total (Category) | 230 (79.3%) | 60 (20.7%) |
| Total (Overall) | 464 (55.9%) | 366 (44.1%) |
Employment Industries by Sex in Veedersburg
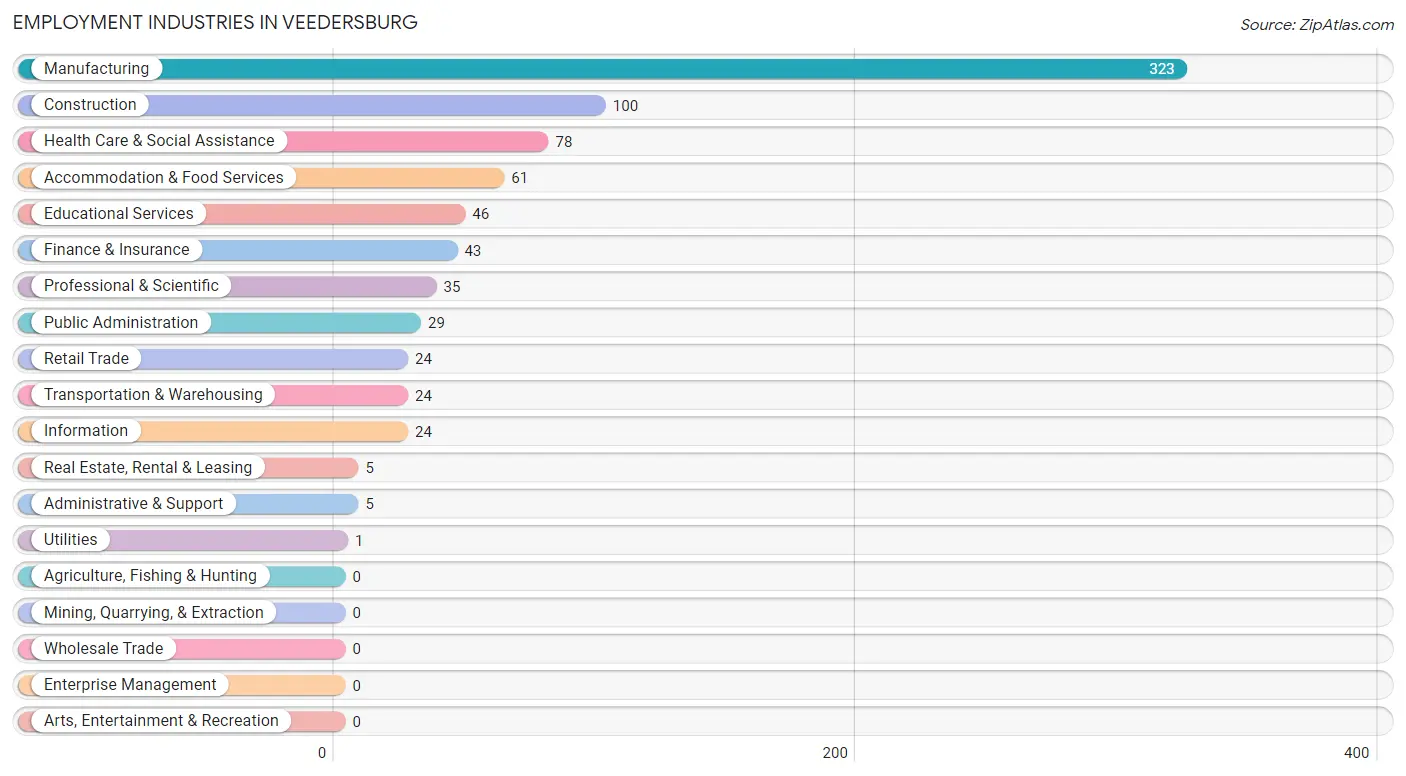
Employment Industries in Veedersburg
The major employment industries in Veedersburg include Manufacturing (323 | 38.9%), Construction (100 | 12.0%), Health Care & Social Assistance (78 | 9.4%), Accommodation & Food Services (61 | 7.3%), and Educational Services (46 | 5.5%).
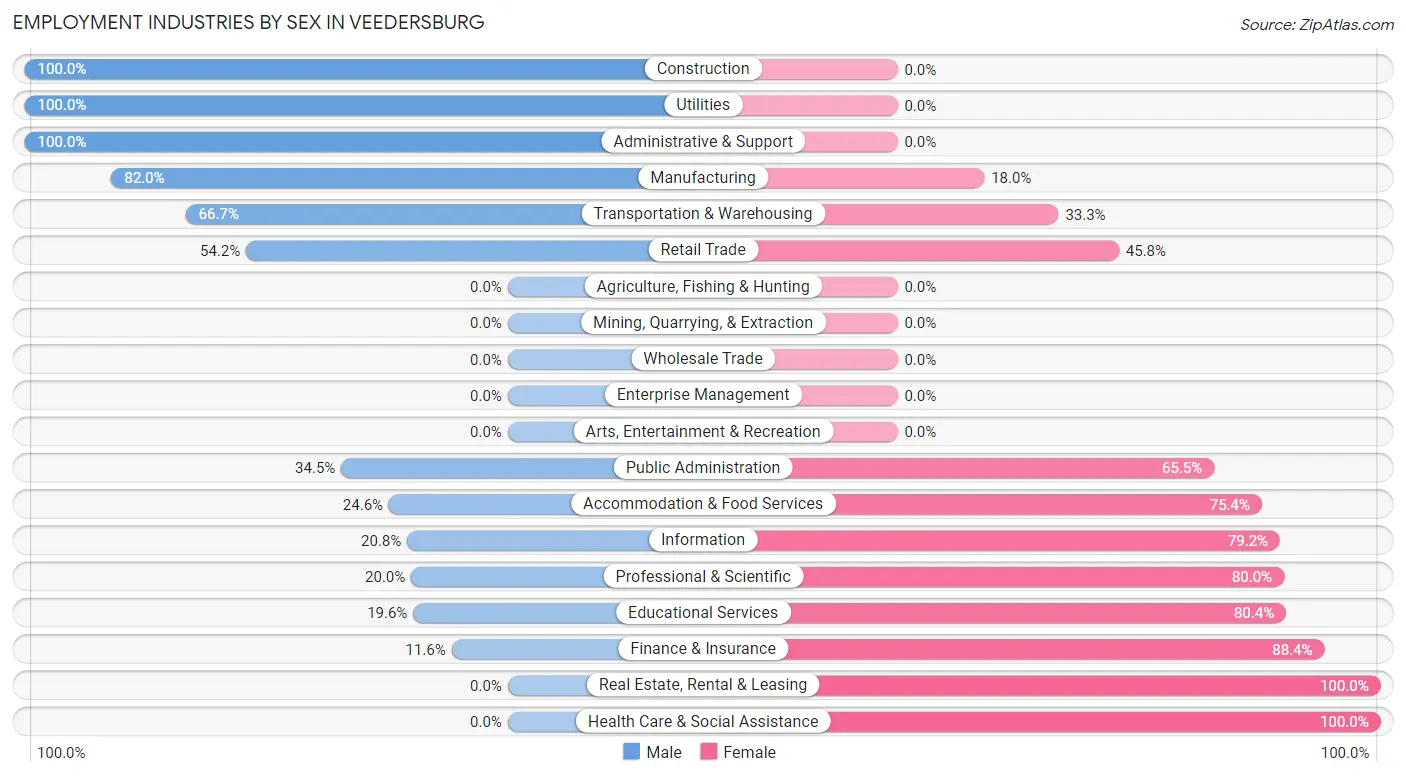
Employment Industries by Sex in Veedersburg
The Veedersburg industries that see more men than women are Construction (100.0%), Utilities (100.0%), and Administrative & Support (100.0%), whereas the industries that tend to have a higher number of women are Real Estate, Rental & Leasing (100.0%), Health Care & Social Assistance (100.0%), and Finance & Insurance (88.4%).
| Industry | Male | Female |
| Agriculture, Fishing & Hunting | 0 (0.0%) | 0 (0.0%) |
| Mining, Quarrying, & Extraction | 0 (0.0%) | 0 (0.0%) |
| Construction | 100 (100.0%) | 0 (0.0%) |
| Manufacturing | 265 (82.0%) | 58 (18.0%) |
| Wholesale Trade | 0 (0.0%) | 0 (0.0%) |
| Retail Trade | 13 (54.2%) | 11 (45.8%) |
| Transportation & Warehousing | 16 (66.7%) | 8 (33.3%) |
| Utilities | 1 (100.0%) | 0 (0.0%) |
| Information | 5 (20.8%) | 19 (79.2%) |
| Finance & Insurance | 5 (11.6%) | 38 (88.4%) |
| Real Estate, Rental & Leasing | 0 (0.0%) | 5 (100.0%) |
| Professional & Scientific | 7 (20.0%) | 28 (80.0%) |
| Enterprise Management | 0 (0.0%) | 0 (0.0%) |
| Administrative & Support | 5 (100.0%) | 0 (0.0%) |
| Educational Services | 9 (19.6%) | 37 (80.4%) |
| Health Care & Social Assistance | 0 (0.0%) | 78 (100.0%) |
| Arts, Entertainment & Recreation | 0 (0.0%) | 0 (0.0%) |
| Accommodation & Food Services | 15 (24.6%) | 46 (75.4%) |
| Public Administration | 10 (34.5%) | 19 (65.5%) |
| Total | 464 (55.9%) | 366 (44.1%) |
Education in Veedersburg
School Enrollment in Veedersburg
The most common levels of schooling among the 390 students in Veedersburg are high school (93 | 23.8%), middle school (86 | 22.1%), and kindergarten (73 | 18.7%).
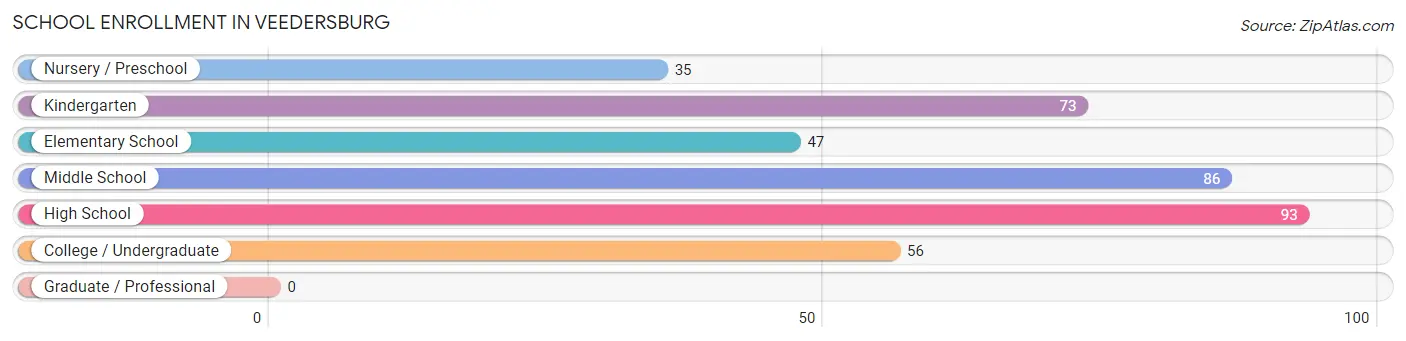
| School Level | # Students | % Students |
| Nursery / Preschool | 35 | 9.0% |
| Kindergarten | 73 | 18.7% |
| Elementary School | 47 | 12.0% |
| Middle School | 86 | 22.1% |
| High School | 93 | 23.8% |
| College / Undergraduate | 56 | 14.4% |
| Graduate / Professional | 0 | 0.0% |
| Total | 390 | 100.0% |
School Enrollment by Age by Funding Source in Veedersburg
Out of a total of 390 students who are enrolled in schools in Veedersburg, 26 (6.7%) attend a private institution, while the remaining 364 (93.3%) are enrolled in public schools. The age group of 3 to 4 year olds has the highest likelihood of being enrolled in private schools, with 8 (22.9% in the age bracket) enrolled. Conversely, the age group of 10 to 14 year olds has the lowest likelihood of being enrolled in a private school, with 92 (100.0% in the age bracket) attending a public institution.
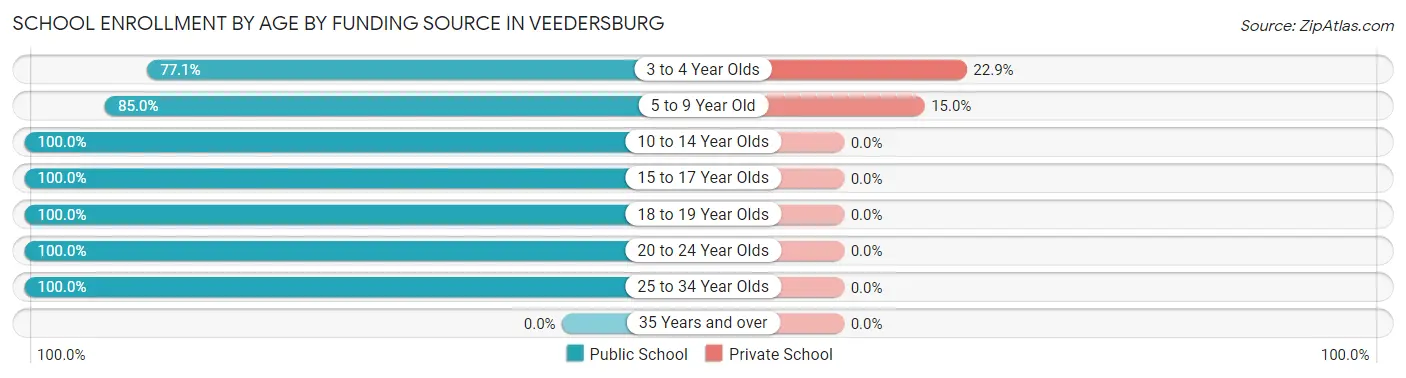
| Age Bracket | Public School | Private School |
| 3 to 4 Year Olds | 27 (77.1%) | 8 (22.9%) |
| 5 to 9 Year Old | 102 (85.0%) | 18 (15.0%) |
| 10 to 14 Year Olds | 92 (100.0%) | 0 (0.0%) |
| 15 to 17 Year Olds | 84 (100.0%) | 0 (0.0%) |
| 18 to 19 Year Olds | 15 (100.0%) | 0 (0.0%) |
| 20 to 24 Year Olds | 21 (100.0%) | 0 (0.0%) |
| 25 to 34 Year Olds | 23 (100.0%) | 0 (0.0%) |
| 35 Years and over | 0 (0.0%) | 0 (0.0%) |
| Total | 364 (93.3%) | 26 (6.7%) |
Educational Attainment by Field of Study in Veedersburg
Education (43 | 38.4%), liberal arts & history (24 | 21.4%), business (13 | 11.6%), arts & humanities (12 | 10.7%), and psychology (11 | 9.8%) are the most common fields of study among 112 individuals in Veedersburg who have obtained a bachelor's degree or higher.
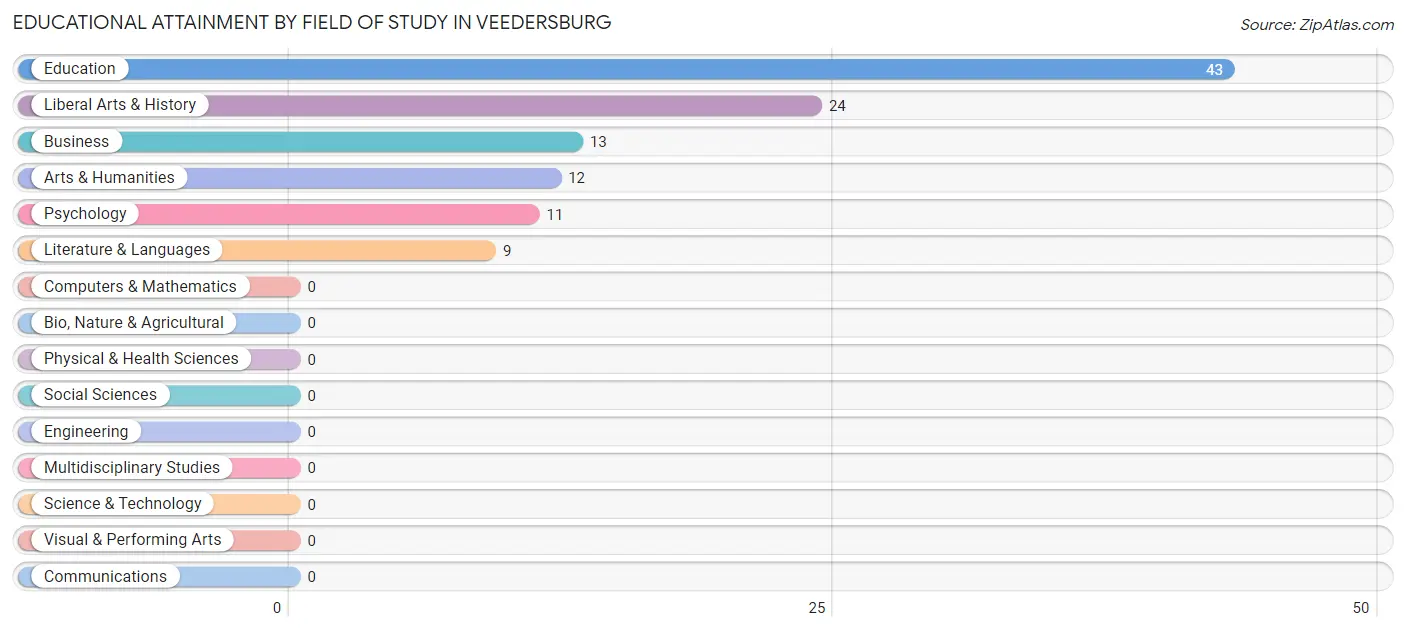
| Field of Study | # Graduates | % Graduates |
| Computers & Mathematics | 0 | 0.0% |
| Bio, Nature & Agricultural | 0 | 0.0% |
| Physical & Health Sciences | 0 | 0.0% |
| Psychology | 11 | 9.8% |
| Social Sciences | 0 | 0.0% |
| Engineering | 0 | 0.0% |
| Multidisciplinary Studies | 0 | 0.0% |
| Science & Technology | 0 | 0.0% |
| Business | 13 | 11.6% |
| Education | 43 | 38.4% |
| Literature & Languages | 9 | 8.0% |
| Liberal Arts & History | 24 | 21.4% |
| Visual & Performing Arts | 0 | 0.0% |
| Communications | 0 | 0.0% |
| Arts & Humanities | 12 | 10.7% |
| Total | 112 | 100.0% |
Transportation & Commute in Veedersburg
Vehicle Availability by Sex in Veedersburg
The most prevalent vehicle ownership categories in Veedersburg are males with 3 vehicles (135, accounting for 32.0%) and females with 3 vehicles (80, making up 36.9%).
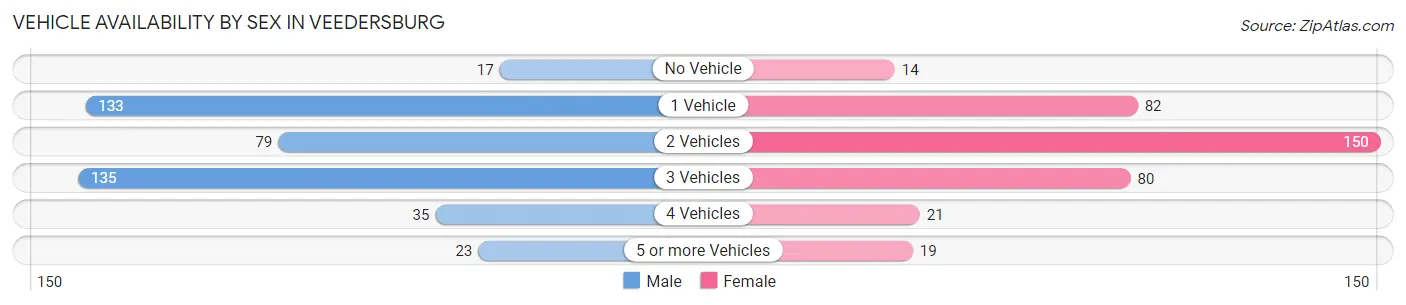
| Vehicles Available | Male | Female |
| No Vehicle | 17 (4.0%) | 14 (3.8%) |
| 1 Vehicle | 133 (31.5%) | 82 (22.4%) |
| 2 Vehicles | 79 (18.7%) | 150 (41.0%) |
| 3 Vehicles | 135 (32.0%) | 80 (21.9%) |
| 4 Vehicles | 35 (8.3%) | 21 (5.7%) |
| 5 or more Vehicles | 23 (5.4%) | 19 (5.2%) |
| Total | 422 (100.0%) | 366 (100.0%) |
Commute Time in Veedersburg
The most frequently occuring commute durations in Veedersburg are 15 to 19 minutes (165 commuters, 21.2%), 5 to 9 minutes (149 commuters, 19.2%), and 30 to 34 minutes (82 commuters, 10.5%).
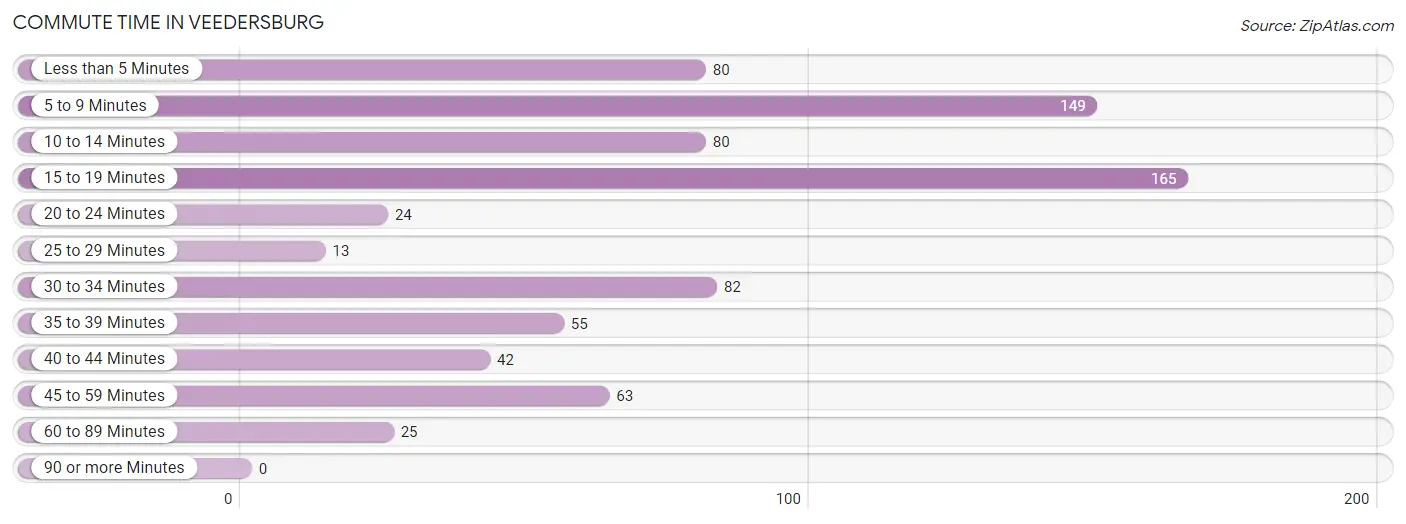
| Commute Time | # Commuters | % Commuters |
| Less than 5 Minutes | 80 | 10.3% |
| 5 to 9 Minutes | 149 | 19.2% |
| 10 to 14 Minutes | 80 | 10.3% |
| 15 to 19 Minutes | 165 | 21.2% |
| 20 to 24 Minutes | 24 | 3.1% |
| 25 to 29 Minutes | 13 | 1.7% |
| 30 to 34 Minutes | 82 | 10.5% |
| 35 to 39 Minutes | 55 | 7.1% |
| 40 to 44 Minutes | 42 | 5.4% |
| 45 to 59 Minutes | 63 | 8.1% |
| 60 to 89 Minutes | 25 | 3.2% |
| 90 or more Minutes | 0 | 0.0% |
Commute Time by Sex in Veedersburg
The most common commute times in Veedersburg are 15 to 19 minutes (86 commuters, 20.7%) for males and 5 to 9 minutes (86 commuters, 23.7%) for females.
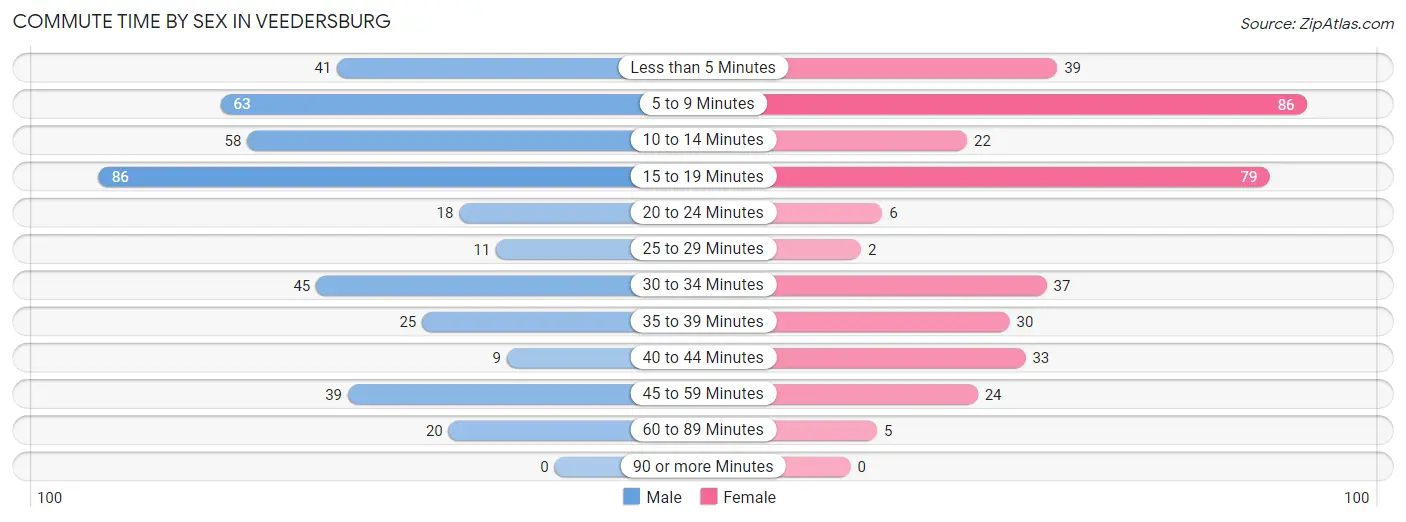
| Commute Time | Male | Female |
| Less than 5 Minutes | 41 (9.9%) | 39 (10.7%) |
| 5 to 9 Minutes | 63 (15.2%) | 86 (23.7%) |
| 10 to 14 Minutes | 58 (14.0%) | 22 (6.1%) |
| 15 to 19 Minutes | 86 (20.7%) | 79 (21.8%) |
| 20 to 24 Minutes | 18 (4.3%) | 6 (1.7%) |
| 25 to 29 Minutes | 11 (2.6%) | 2 (0.5%) |
| 30 to 34 Minutes | 45 (10.8%) | 37 (10.2%) |
| 35 to 39 Minutes | 25 (6.0%) | 30 (8.3%) |
| 40 to 44 Minutes | 9 (2.2%) | 33 (9.1%) |
| 45 to 59 Minutes | 39 (9.4%) | 24 (6.6%) |
| 60 to 89 Minutes | 20 (4.8%) | 5 (1.4%) |
| 90 or more Minutes | 0 (0.0%) | 0 (0.0%) |
Time of Departure to Work by Sex in Veedersburg
The most frequent times of departure to work in Veedersburg are 7:00 AM to 7:29 AM (111, 26.8%) for males and 7:30 AM to 7:59 AM (63, 17.4%) for females.
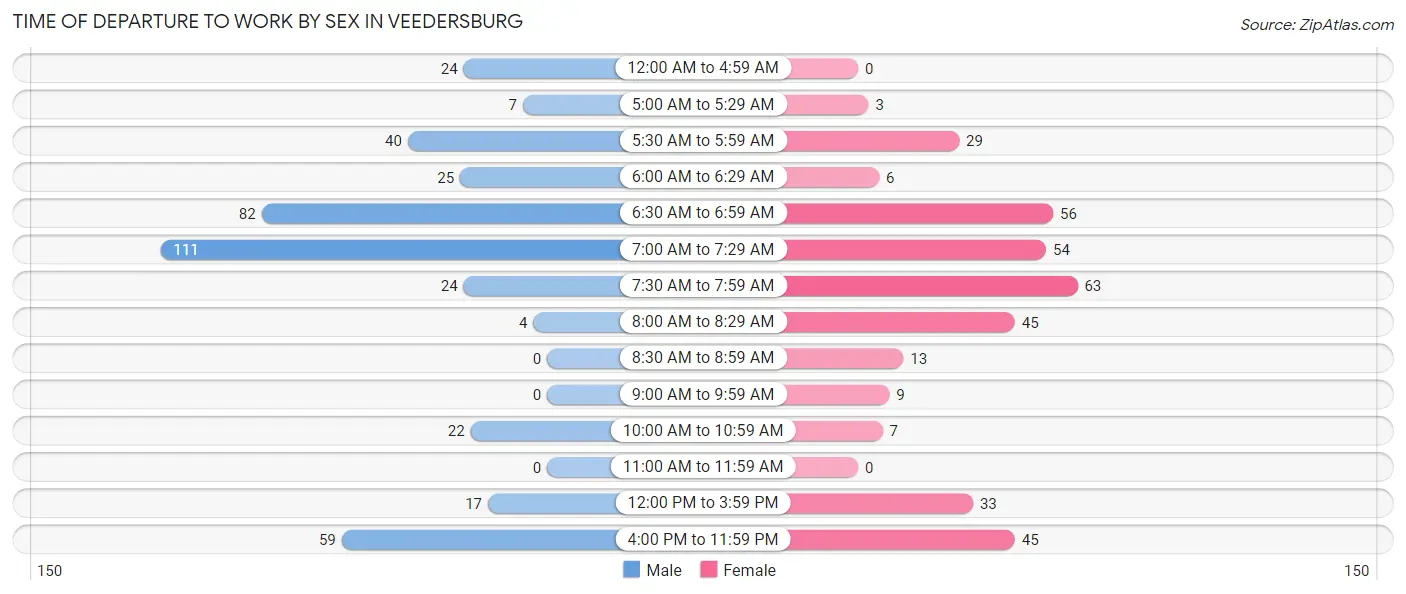
| Time of Departure | Male | Female |
| 12:00 AM to 4:59 AM | 24 (5.8%) | 0 (0.0%) |
| 5:00 AM to 5:29 AM | 7 (1.7%) | 3 (0.8%) |
| 5:30 AM to 5:59 AM | 40 (9.6%) | 29 (8.0%) |
| 6:00 AM to 6:29 AM | 25 (6.0%) | 6 (1.7%) |
| 6:30 AM to 6:59 AM | 82 (19.8%) | 56 (15.4%) |
| 7:00 AM to 7:29 AM | 111 (26.8%) | 54 (14.9%) |
| 7:30 AM to 7:59 AM | 24 (5.8%) | 63 (17.4%) |
| 8:00 AM to 8:29 AM | 4 (1.0%) | 45 (12.4%) |
| 8:30 AM to 8:59 AM | 0 (0.0%) | 13 (3.6%) |
| 9:00 AM to 9:59 AM | 0 (0.0%) | 9 (2.5%) |
| 10:00 AM to 10:59 AM | 22 (5.3%) | 7 (1.9%) |
| 11:00 AM to 11:59 AM | 0 (0.0%) | 0 (0.0%) |
| 12:00 PM to 3:59 PM | 17 (4.1%) | 33 (9.1%) |
| 4:00 PM to 11:59 PM | 59 (14.2%) | 45 (12.4%) |
| Total | 415 (100.0%) | 363 (100.0%) |
Housing Occupancy in Veedersburg
Occupancy by Ownership in Veedersburg
Of the total 865 dwellings in Veedersburg, owner-occupied units account for 669 (77.3%), while renter-occupied units make up 196 (22.7%).
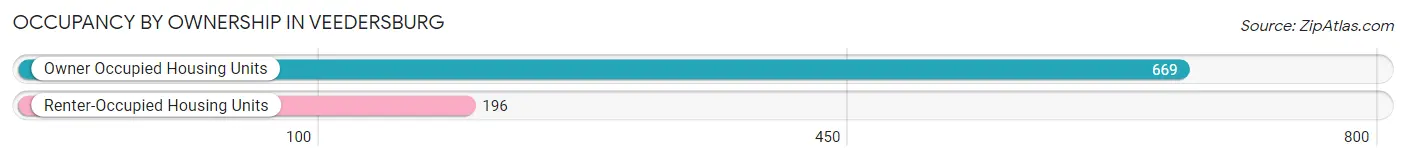
| Occupancy | # Housing Units | % Housing Units |
| Owner Occupied Housing Units | 669 | 77.3% |
| Renter-Occupied Housing Units | 196 | 22.7% |
| Total Occupied Housing Units | 865 | 100.0% |
Occupancy by Household Size in Veedersburg
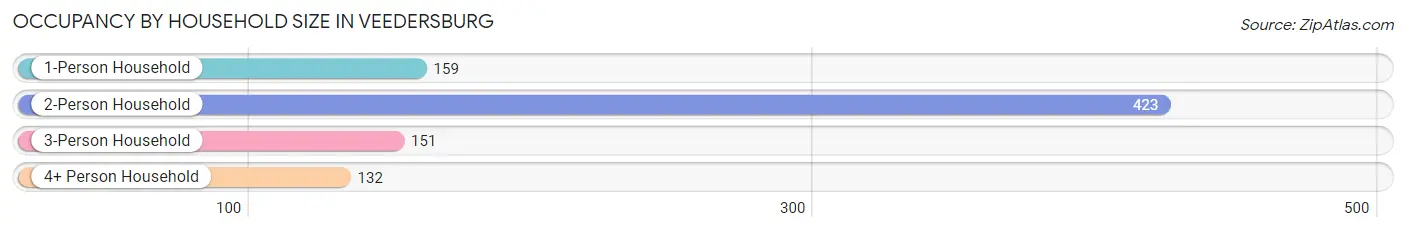
| Household Size | # Housing Units | % Housing Units |
| 1-Person Household | 159 | 18.4% |
| 2-Person Household | 423 | 48.9% |
| 3-Person Household | 151 | 17.5% |
| 4+ Person Household | 132 | 15.3% |
| Total Housing Units | 865 | 100.0% |
Occupancy by Ownership by Household Size in Veedersburg
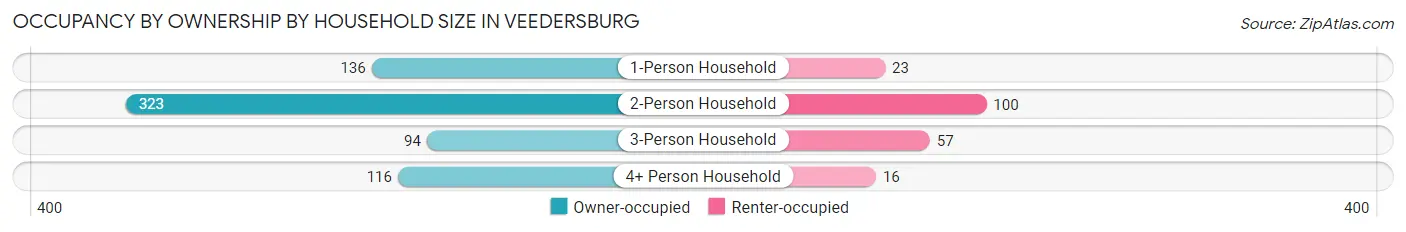
| Household Size | Owner-occupied | Renter-occupied |
| 1-Person Household | 136 (85.5%) | 23 (14.5%) |
| 2-Person Household | 323 (76.4%) | 100 (23.6%) |
| 3-Person Household | 94 (62.3%) | 57 (37.8%) |
| 4+ Person Household | 116 (87.9%) | 16 (12.1%) |
| Total Housing Units | 669 (77.3%) | 196 (22.7%) |
Occupancy by Educational Attainment in Veedersburg
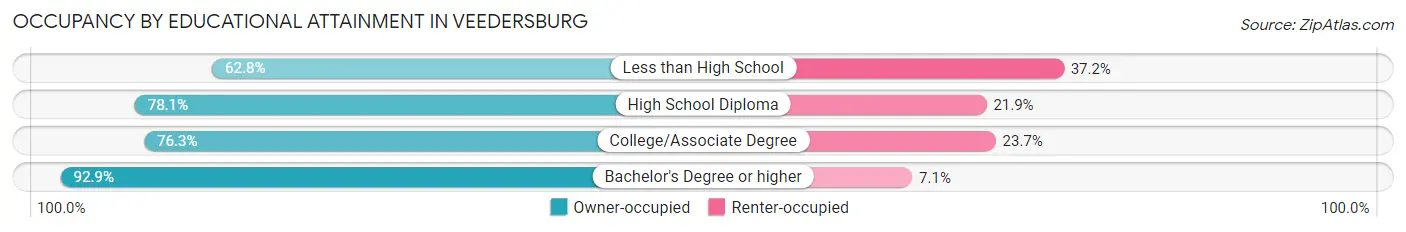
| Household Size | Owner-occupied | Renter-occupied |
| Less than High School | 49 (62.8%) | 29 (37.2%) |
| High School Diploma | 336 (78.1%) | 94 (21.9%) |
| College/Associate Degree | 219 (76.3%) | 68 (23.7%) |
| Bachelor's Degree or higher | 65 (92.9%) | 5 (7.1%) |
Occupancy by Age of Householder in Veedersburg
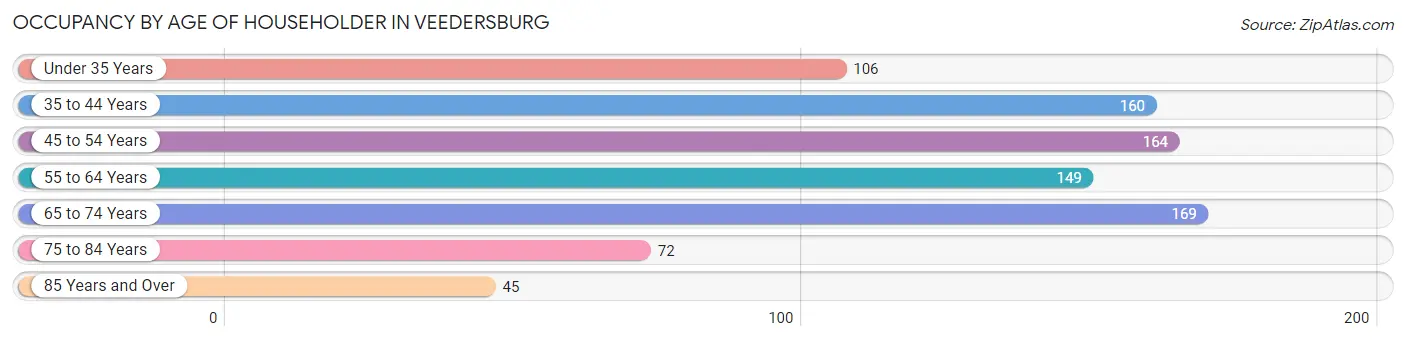
| Age Bracket | # Households | % Households |
| Under 35 Years | 106 | 12.2% |
| 35 to 44 Years | 160 | 18.5% |
| 45 to 54 Years | 164 | 19.0% |
| 55 to 64 Years | 149 | 17.2% |
| 65 to 74 Years | 169 | 19.5% |
| 75 to 84 Years | 72 | 8.3% |
| 85 Years and Over | 45 | 5.2% |
| Total | 865 | 100.0% |
Housing Finances in Veedersburg
Median Income by Occupancy in Veedersburg
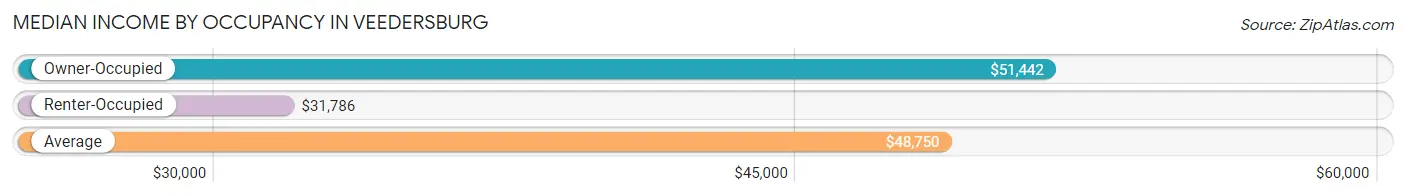
| Occupancy Type | # Households | Median Income |
| Owner-Occupied | 669 (77.3%) | $51,442 |
| Renter-Occupied | 196 (22.7%) | $31,786 |
| Average | 865 (100.0%) | $48,750 |
Occupancy by Householder Income Bracket in Veedersburg
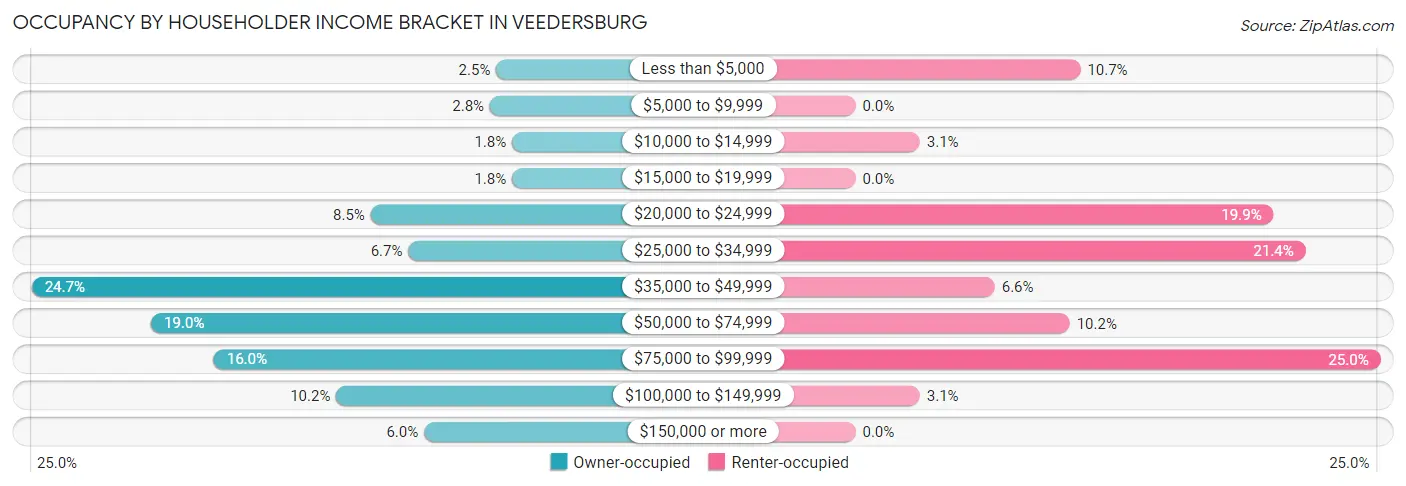
| Income Bracket | Owner-occupied | Renter-occupied |
| Less than $5,000 | 17 (2.5%) | 21 (10.7%) |
| $5,000 to $9,999 | 19 (2.8%) | 0 (0.0%) |
| $10,000 to $14,999 | 12 (1.8%) | 6 (3.1%) |
| $15,000 to $19,999 | 12 (1.8%) | 0 (0.0%) |
| $20,000 to $24,999 | 57 (8.5%) | 39 (19.9%) |
| $25,000 to $34,999 | 45 (6.7%) | 42 (21.4%) |
| $35,000 to $49,999 | 165 (24.7%) | 13 (6.6%) |
| $50,000 to $74,999 | 127 (19.0%) | 20 (10.2%) |
| $75,000 to $99,999 | 107 (16.0%) | 49 (25.0%) |
| $100,000 to $149,999 | 68 (10.2%) | 6 (3.1%) |
| $150,000 or more | 40 (6.0%) | 0 (0.0%) |
| Total | 669 (100.0%) | 196 (100.0%) |
Monthly Housing Cost Tiers in Veedersburg
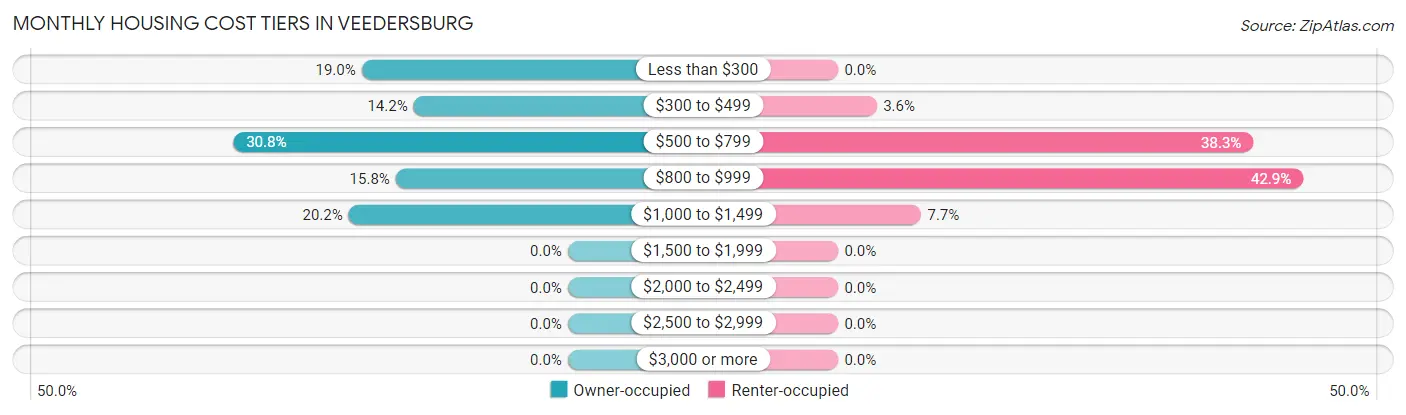
| Monthly Cost | Owner-occupied | Renter-occupied |
| Less than $300 | 127 (19.0%) | 0 (0.0%) |
| $300 to $499 | 95 (14.2%) | 7 (3.6%) |
| $500 to $799 | 206 (30.8%) | 75 (38.3%) |
| $800 to $999 | 106 (15.8%) | 84 (42.9%) |
| $1,000 to $1,499 | 135 (20.2%) | 15 (7.6%) |
| $1,500 to $1,999 | 0 (0.0%) | 0 (0.0%) |
| $2,000 to $2,499 | 0 (0.0%) | 0 (0.0%) |
| $2,500 to $2,999 | 0 (0.0%) | 0 (0.0%) |
| $3,000 or more | 0 (0.0%) | 0 (0.0%) |
| Total | 669 (100.0%) | 196 (100.0%) |
Physical Housing Characteristics in Veedersburg
Housing Structures in Veedersburg
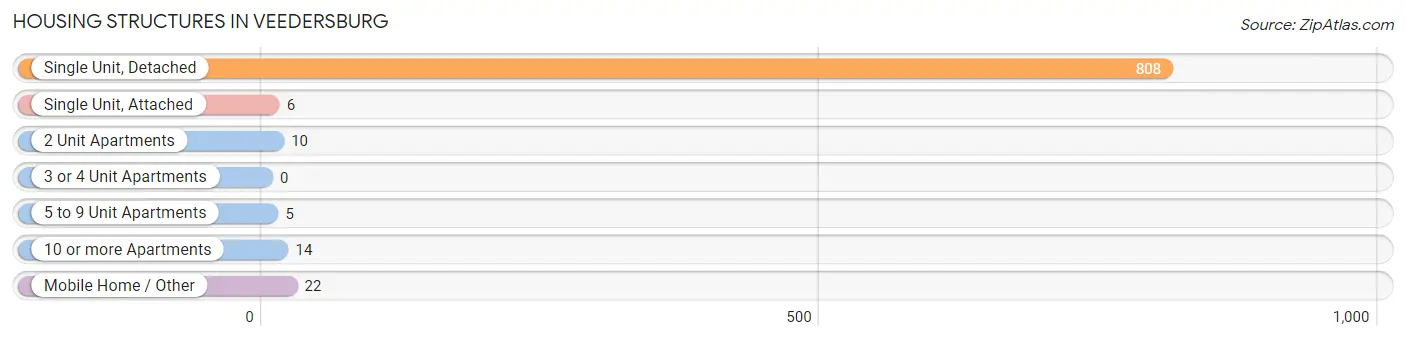
| Structure Type | # Housing Units | % Housing Units |
| Single Unit, Detached | 808 | 93.4% |
| Single Unit, Attached | 6 | 0.7% |
| 2 Unit Apartments | 10 | 1.2% |
| 3 or 4 Unit Apartments | 0 | 0.0% |
| 5 to 9 Unit Apartments | 5 | 0.6% |
| 10 or more Apartments | 14 | 1.6% |
| Mobile Home / Other | 22 | 2.5% |
| Total | 865 | 100.0% |
Housing Structures by Occupancy in Veedersburg
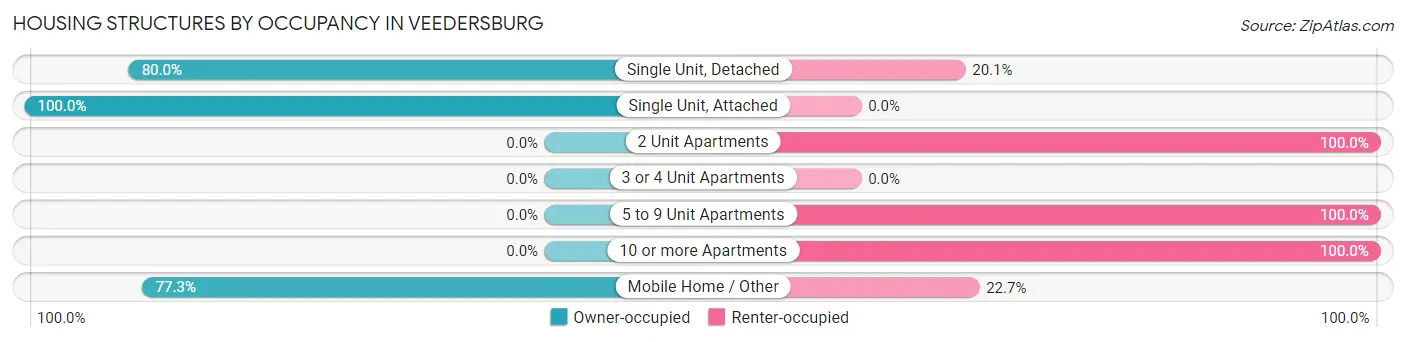
| Structure Type | Owner-occupied | Renter-occupied |
| Single Unit, Detached | 646 (79.9%) | 162 (20.1%) |
| Single Unit, Attached | 6 (100.0%) | 0 (0.0%) |
| 2 Unit Apartments | 0 (0.0%) | 10 (100.0%) |
| 3 or 4 Unit Apartments | 0 (0.0%) | 0 (0.0%) |
| 5 to 9 Unit Apartments | 0 (0.0%) | 5 (100.0%) |
| 10 or more Apartments | 0 (0.0%) | 14 (100.0%) |
| Mobile Home / Other | 17 (77.3%) | 5 (22.7%) |
| Total | 669 (77.3%) | 196 (22.7%) |
Housing Structures by Number of Rooms in Veedersburg
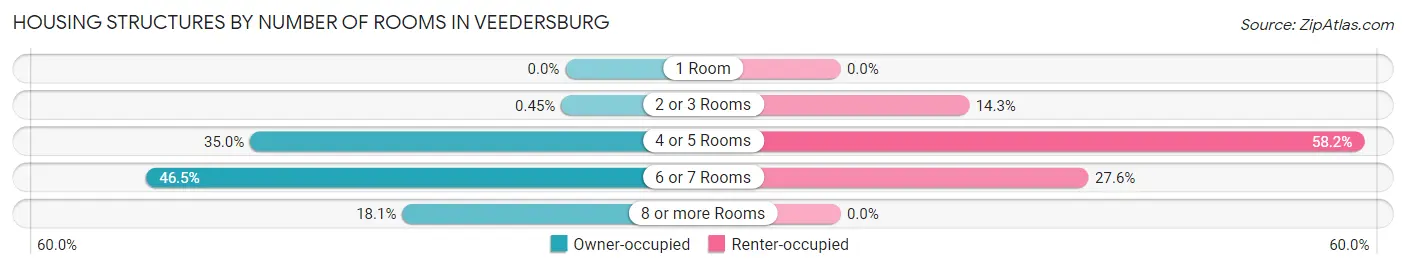
| Number of Rooms | Owner-occupied | Renter-occupied |
| 1 Room | 0 (0.0%) | 0 (0.0%) |
| 2 or 3 Rooms | 3 (0.4%) | 28 (14.3%) |
| 4 or 5 Rooms | 234 (35.0%) | 114 (58.2%) |
| 6 or 7 Rooms | 311 (46.5%) | 54 (27.6%) |
| 8 or more Rooms | 121 (18.1%) | 0 (0.0%) |
| Total | 669 (100.0%) | 196 (100.0%) |
Housing Structure by Heating Type in Veedersburg
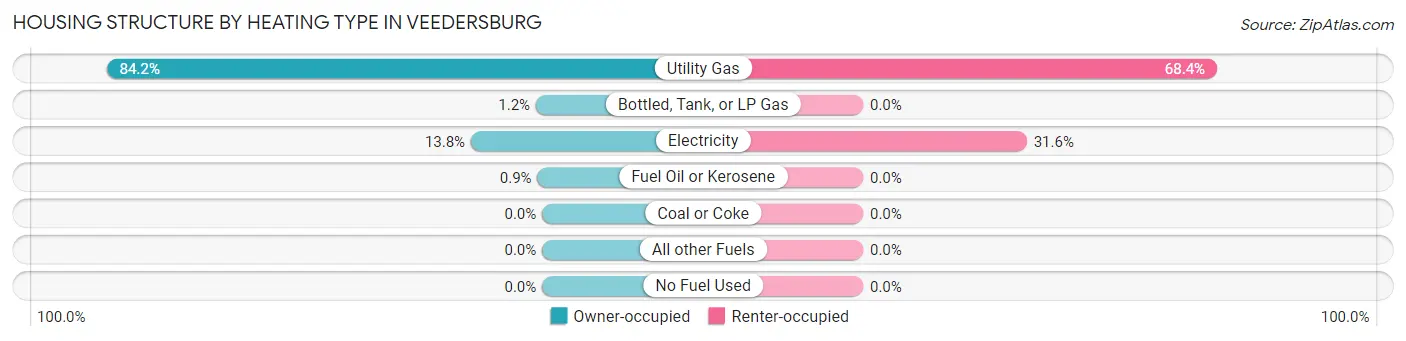
| Heating Type | Owner-occupied | Renter-occupied |
| Utility Gas | 563 (84.2%) | 134 (68.4%) |
| Bottled, Tank, or LP Gas | 8 (1.2%) | 0 (0.0%) |
| Electricity | 92 (13.8%) | 62 (31.6%) |
| Fuel Oil or Kerosene | 6 (0.9%) | 0 (0.0%) |
| Coal or Coke | 0 (0.0%) | 0 (0.0%) |
| All other Fuels | 0 (0.0%) | 0 (0.0%) |
| No Fuel Used | 0 (0.0%) | 0 (0.0%) |
| Total | 669 (100.0%) | 196 (100.0%) |
Household Vehicle Usage in Veedersburg
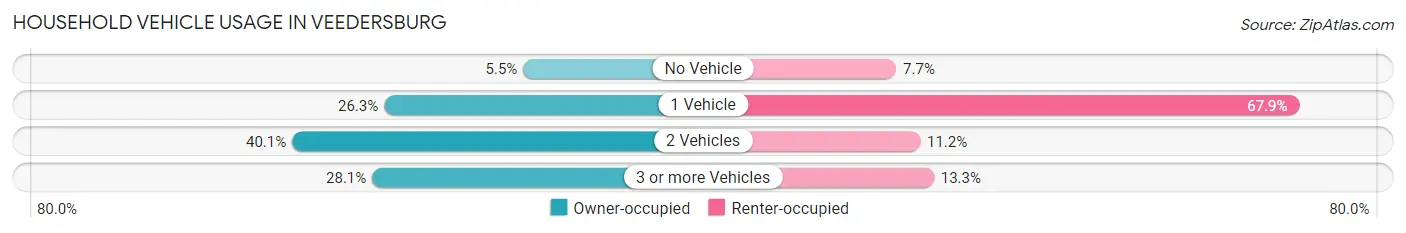
| Vehicles per Household | Owner-occupied | Renter-occupied |
| No Vehicle | 37 (5.5%) | 15 (7.6%) |
| 1 Vehicle | 176 (26.3%) | 133 (67.9%) |
| 2 Vehicles | 268 (40.1%) | 22 (11.2%) |
| 3 or more Vehicles | 188 (28.1%) | 26 (13.3%) |
| Total | 669 (100.0%) | 196 (100.0%) |
Real Estate & Mortgages in Veedersburg
Real Estate and Mortgage Overview in Veedersburg
| Characteristic | Without Mortgage | With Mortgage |
| Housing Units | 311 | 358 |
| Median Property Value | $84,400 | $102,000 |
| Median Household Income | $39,529 | $27 |
| Monthly Housing Costs | $327 | $0 |
| Real Estate Taxes | $478 | $1 |
Property Value by Mortgage Status in Veedersburg
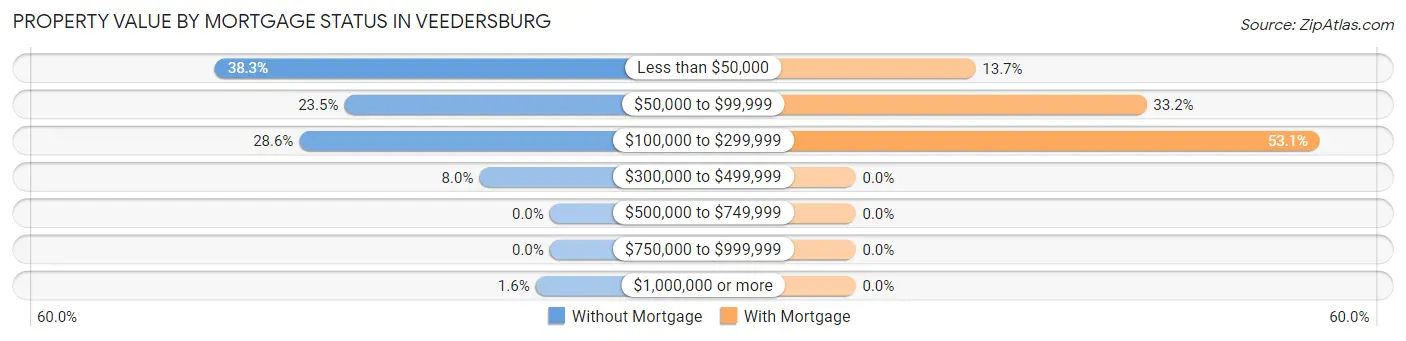
| Property Value | Without Mortgage | With Mortgage |
| Less than $50,000 | 119 (38.3%) | 49 (13.7%) |
| $50,000 to $99,999 | 73 (23.5%) | 119 (33.2%) |
| $100,000 to $299,999 | 89 (28.6%) | 190 (53.1%) |
| $300,000 to $499,999 | 25 (8.0%) | 0 (0.0%) |
| $500,000 to $749,999 | 0 (0.0%) | 0 (0.0%) |
| $750,000 to $999,999 | 0 (0.0%) | 0 (0.0%) |
| $1,000,000 or more | 5 (1.6%) | 0 (0.0%) |
| Total | 311 (100.0%) | 358 (100.0%) |
Household Income by Mortgage Status in Veedersburg
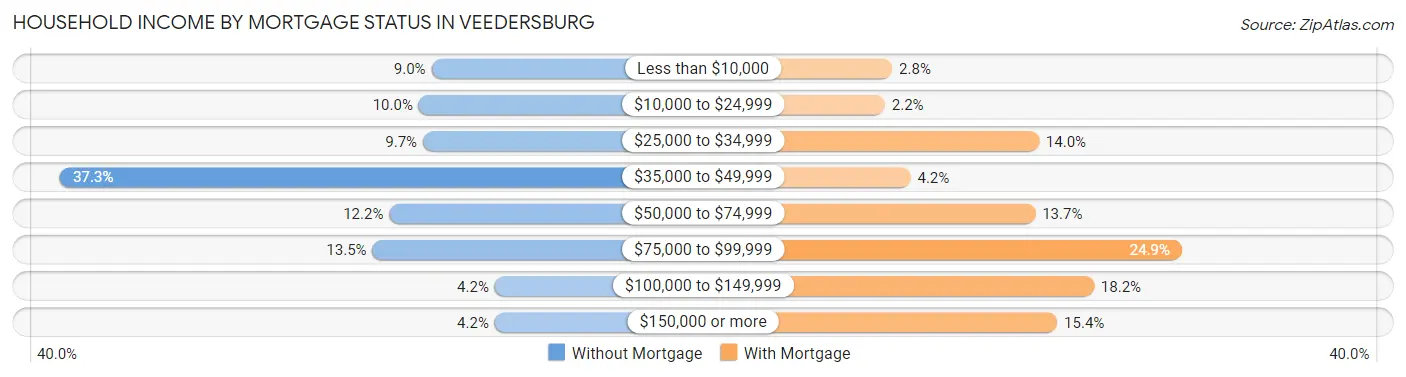
| Household Income | Without Mortgage | With Mortgage |
| Less than $10,000 | 28 (9.0%) | 10 (2.8%) |
| $10,000 to $24,999 | 31 (10.0%) | 8 (2.2%) |
| $25,000 to $34,999 | 30 (9.7%) | 50 (14.0%) |
| $35,000 to $49,999 | 116 (37.3%) | 15 (4.2%) |
| $50,000 to $74,999 | 38 (12.2%) | 49 (13.7%) |
| $75,000 to $99,999 | 42 (13.5%) | 89 (24.9%) |
| $100,000 to $149,999 | 13 (4.2%) | 65 (18.2%) |
| $150,000 or more | 13 (4.2%) | 55 (15.4%) |
| Total | 311 (100.0%) | 358 (100.0%) |
Property Value to Household Income Ratio in Veedersburg
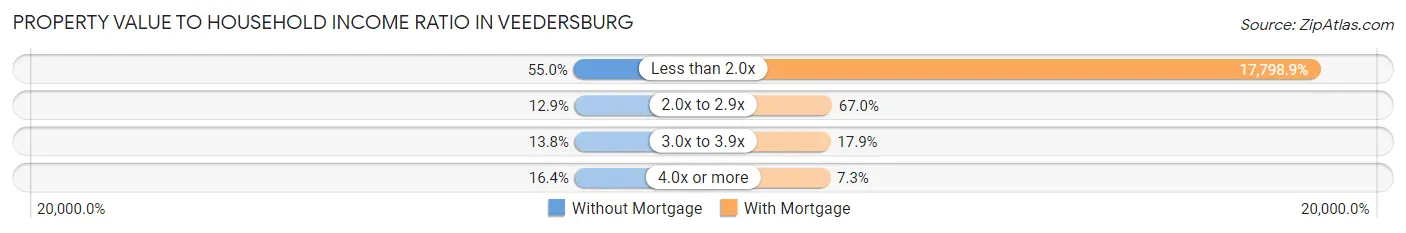
| Value-to-Income Ratio | Without Mortgage | With Mortgage |
| Less than 2.0x | 171 (55.0%) | 63,720 (17,798.9%) |
| 2.0x to 2.9x | 40 (12.9%) | 240 (67.0%) |
| 3.0x to 3.9x | 43 (13.8%) | 64 (17.9%) |
| 4.0x or more | 51 (16.4%) | 26 (7.3%) |
| Total | 311 (100.0%) | 358 (100.0%) |
Real Estate Taxes by Mortgage Status in Veedersburg
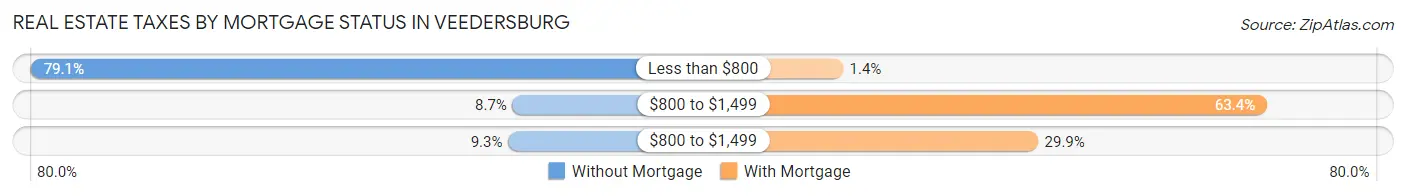
| Property Taxes | Without Mortgage | With Mortgage |
| Less than $800 | 246 (79.1%) | 5 (1.4%) |
| $800 to $1,499 | 27 (8.7%) | 227 (63.4%) |
| $800 to $1,499 | 29 (9.3%) | 107 (29.9%) |
| Total | 311 (100.0%) | 358 (100.0%) |
Health & Disability in Veedersburg
Health Insurance Coverage by Age in Veedersburg
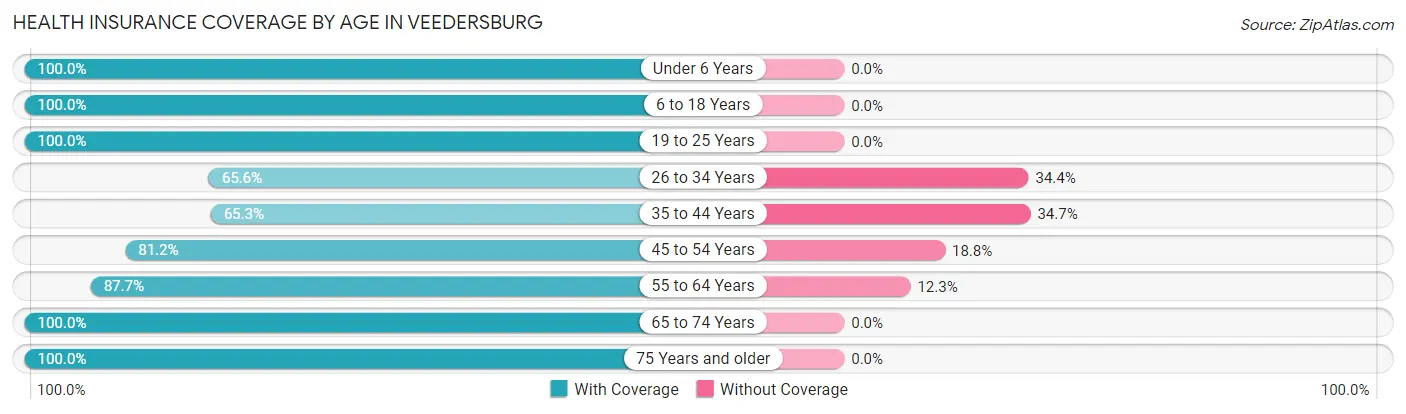
| Age Bracket | With Coverage | Without Coverage |
| Under 6 Years | 82 (100.0%) | 0 (0.0%) |
| 6 to 18 Years | 325 (100.0%) | 0 (0.0%) |
| 19 to 25 Years | 126 (100.0%) | 0 (0.0%) |
| 26 to 34 Years | 107 (65.6%) | 56 (34.4%) |
| 35 to 44 Years | 141 (65.3%) | 75 (34.7%) |
| 45 to 54 Years | 229 (81.2%) | 53 (18.8%) |
| 55 to 64 Years | 277 (87.7%) | 39 (12.3%) |
| 65 to 74 Years | 279 (100.0%) | 0 (0.0%) |
| 75 Years and older | 159 (100.0%) | 0 (0.0%) |
| Total | 1,725 (88.5%) | 223 (11.5%) |
Health Insurance Coverage by Citizenship Status in Veedersburg
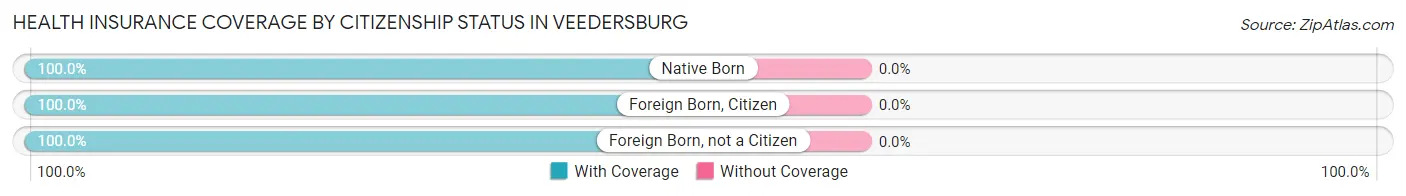
| Citizenship Status | With Coverage | Without Coverage |
| Native Born | 82 (100.0%) | 0 (0.0%) |
| Foreign Born, Citizen | 325 (100.0%) | 0 (0.0%) |
| Foreign Born, not a Citizen | 126 (100.0%) | 0 (0.0%) |
Health Insurance Coverage by Household Income in Veedersburg
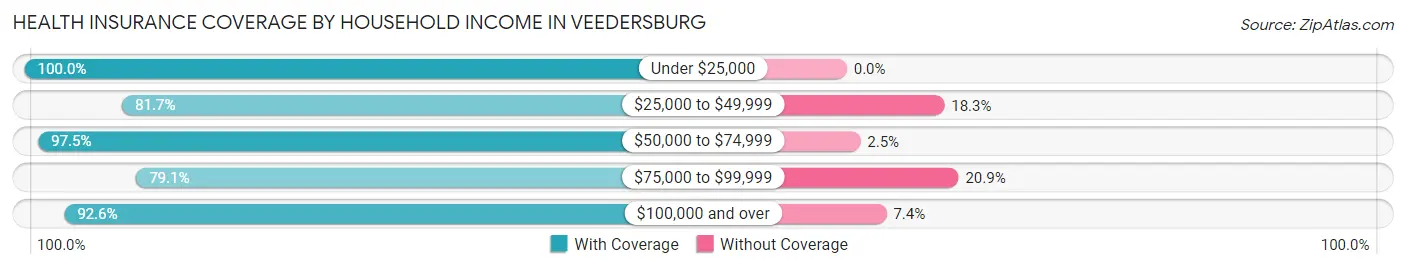
| Household Income | With Coverage | Without Coverage |
| Under $25,000 | 287 (100.0%) | 0 (0.0%) |
| $25,000 to $49,999 | 483 (81.7%) | 108 (18.3%) |
| $50,000 to $74,999 | 346 (97.5%) | 9 (2.5%) |
| $75,000 to $99,999 | 310 (79.1%) | 82 (20.9%) |
| $100,000 and over | 299 (92.6%) | 24 (7.4%) |
Public vs Private Health Insurance Coverage by Age in Veedersburg
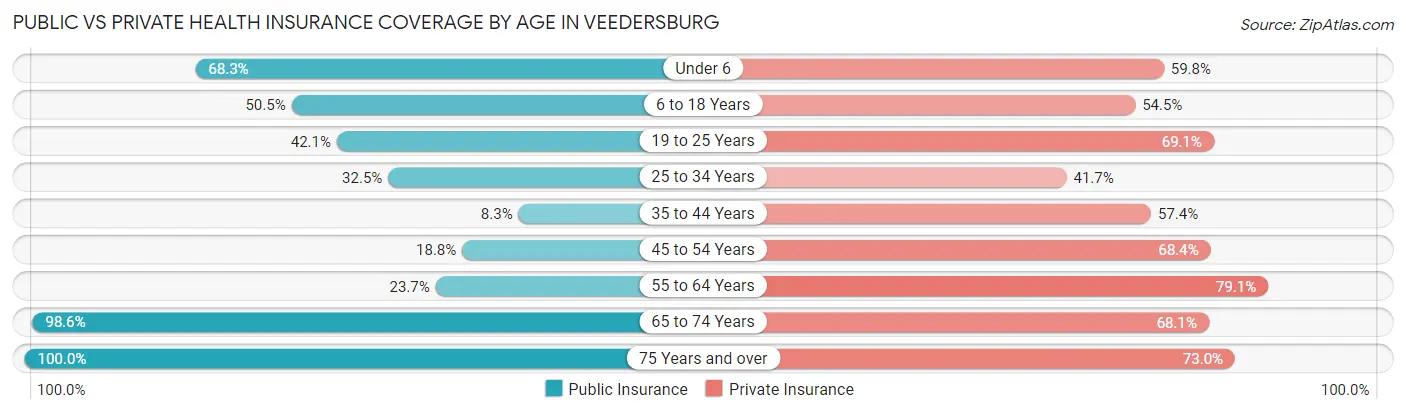
| Age Bracket | Public Insurance | Private Insurance |
| Under 6 | 56 (68.3%) | 49 (59.8%) |
| 6 to 18 Years | 164 (50.5%) | 177 (54.5%) |
| 19 to 25 Years | 53 (42.1%) | 87 (69.1%) |
| 25 to 34 Years | 53 (32.5%) | 68 (41.7%) |
| 35 to 44 Years | 18 (8.3%) | 124 (57.4%) |
| 45 to 54 Years | 53 (18.8%) | 193 (68.4%) |
| 55 to 64 Years | 75 (23.7%) | 250 (79.1%) |
| 65 to 74 Years | 275 (98.6%) | 190 (68.1%) |
| 75 Years and over | 159 (100.0%) | 116 (73.0%) |
| Total | 906 (46.5%) | 1,254 (64.4%) |
Disability Status by Sex by Age in Veedersburg
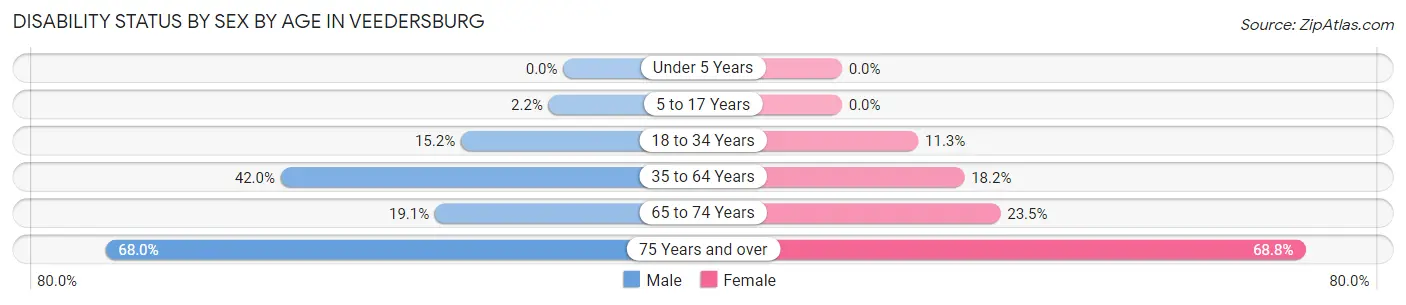
| Age Bracket | Male | Female |
| Under 5 Years | 0 (0.0%) | 0 (0.0%) |
| 5 to 17 Years | 3 (2.2%) | 0 (0.0%) |
| 18 to 34 Years | 26 (15.2%) | 17 (11.3%) |
| 35 to 64 Years | 180 (42.0%) | 70 (18.2%) |
| 65 to 74 Years | 24 (19.1%) | 36 (23.5%) |
| 75 Years and over | 34 (68.0%) | 75 (68.8%) |
Disability Class by Sex by Age in Veedersburg
Disability Class: Hearing Difficulty
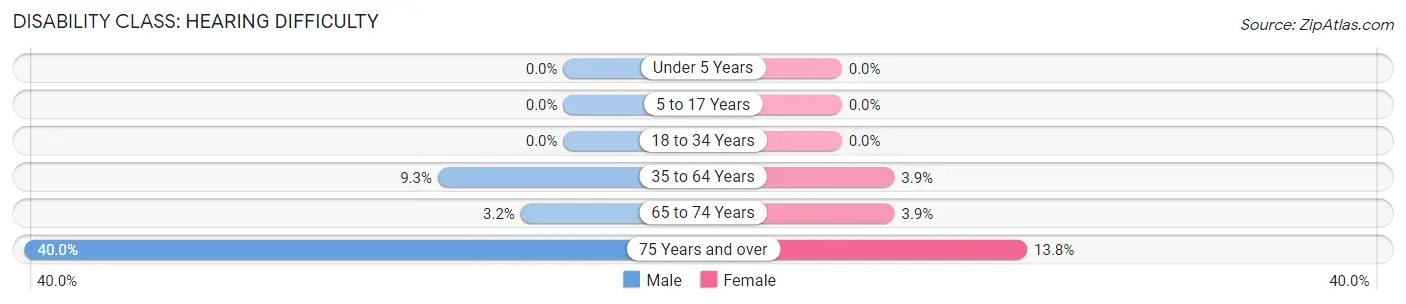
| Age Bracket | Male | Female |
| Under 5 Years | 0 (0.0%) | 0 (0.0%) |
| 5 to 17 Years | 0 (0.0%) | 0 (0.0%) |
| 18 to 34 Years | 0 (0.0%) | 0 (0.0%) |
| 35 to 64 Years | 40 (9.3%) | 15 (3.9%) |
| 65 to 74 Years | 4 (3.2%) | 6 (3.9%) |
| 75 Years and over | 20 (40.0%) | 15 (13.8%) |
Disability Class: Vision Difficulty
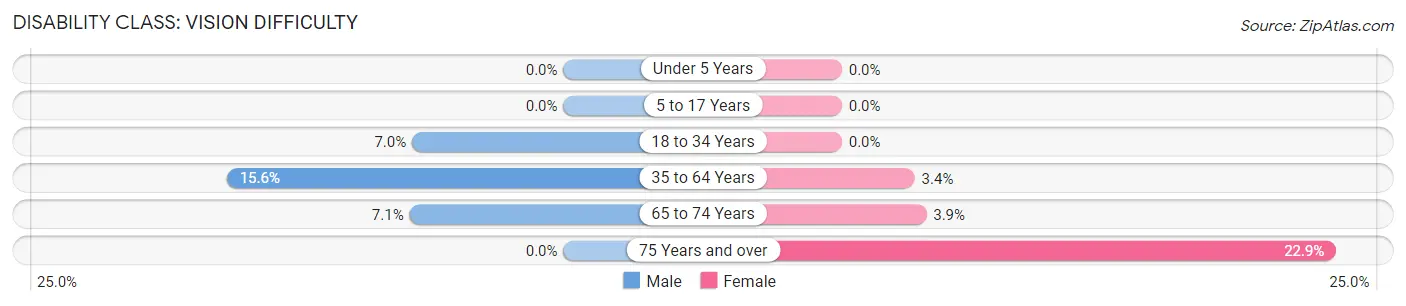
| Age Bracket | Male | Female |
| Under 5 Years | 0 (0.0%) | 0 (0.0%) |
| 5 to 17 Years | 0 (0.0%) | 0 (0.0%) |
| 18 to 34 Years | 12 (7.0%) | 0 (0.0%) |
| 35 to 64 Years | 67 (15.6%) | 13 (3.4%) |
| 65 to 74 Years | 9 (7.1%) | 6 (3.9%) |
| 75 Years and over | 0 (0.0%) | 25 (22.9%) |
Disability Class: Cognitive Difficulty
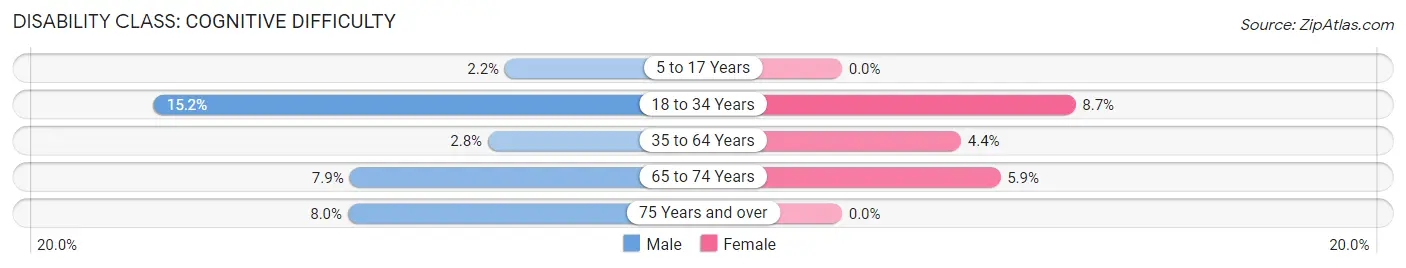
| Age Bracket | Male | Female |
| 5 to 17 Years | 3 (2.2%) | 0 (0.0%) |
| 18 to 34 Years | 26 (15.2%) | 13 (8.7%) |
| 35 to 64 Years | 12 (2.8%) | 17 (4.4%) |
| 65 to 74 Years | 10 (7.9%) | 9 (5.9%) |
| 75 Years and over | 4 (8.0%) | 0 (0.0%) |
Disability Class: Ambulatory Difficulty
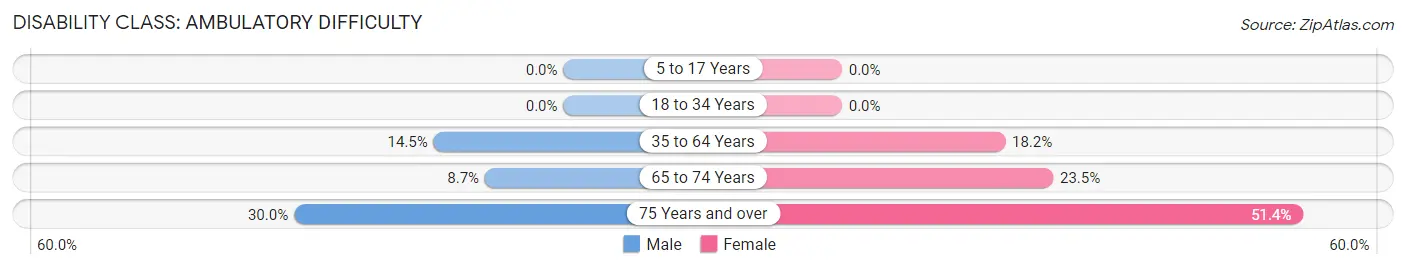
| Age Bracket | Male | Female |
| 5 to 17 Years | 0 (0.0%) | 0 (0.0%) |
| 18 to 34 Years | 0 (0.0%) | 0 (0.0%) |
| 35 to 64 Years | 62 (14.4%) | 70 (18.2%) |
| 65 to 74 Years | 11 (8.7%) | 36 (23.5%) |
| 75 Years and over | 15 (30.0%) | 56 (51.4%) |
Disability Class: Self-Care Difficulty
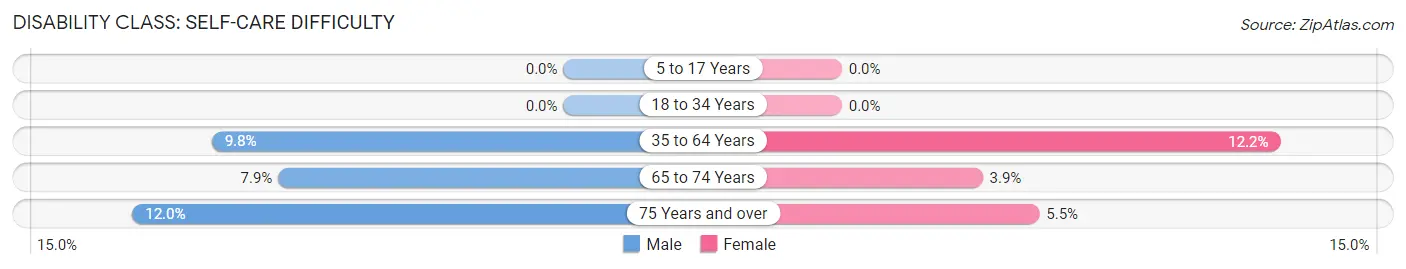
| Age Bracket | Male | Female |
| 5 to 17 Years | 0 (0.0%) | 0 (0.0%) |
| 18 to 34 Years | 0 (0.0%) | 0 (0.0%) |
| 35 to 64 Years | 42 (9.8%) | 47 (12.2%) |
| 65 to 74 Years | 10 (7.9%) | 6 (3.9%) |
| 75 Years and over | 6 (12.0%) | 6 (5.5%) |
Technology Access in Veedersburg
Computing Device Access in Veedersburg
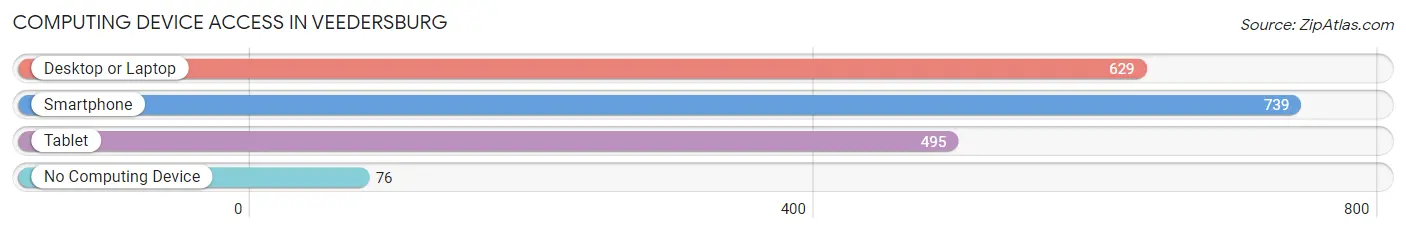
| Device Type | # Households | % Households |
| Desktop or Laptop | 629 | 72.7% |
| Smartphone | 739 | 85.4% |
| Tablet | 495 | 57.2% |
| No Computing Device | 76 | 8.8% |
| Total | 865 | 100.0% |
Internet Access in Veedersburg
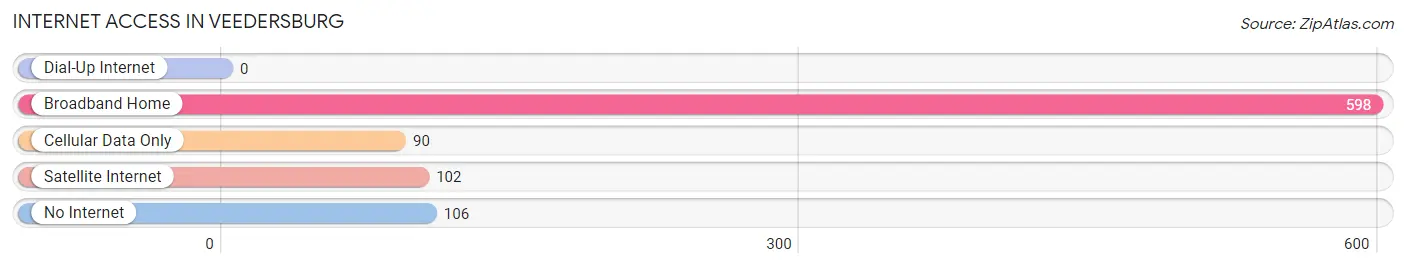
| Internet Type | # Households | % Households |
| Dial-Up Internet | 0 | 0.0% |
| Broadband Home | 598 | 69.1% |
| Cellular Data Only | 90 | 10.4% |
| Satellite Internet | 102 | 11.8% |
| No Internet | 106 | 12.2% |
| Total | 865 | 100.0% |
Veedersburg Summary
Veedersburg is a small town located in Fountain County, Indiana, United States. The population was 1,845 at the 2010 census. It is part of the Lafayette, Indiana Metropolitan Statistical Area.
History
Veedersburg was founded in 1837 by William Veeder, a Dutch immigrant. He named the town after himself and it was incorporated in 1871. The town was originally a farming community, but it soon became a center for industry. The first industry in the town was a sawmill, which was built in 1837. This was followed by a grist mill, a woolen mill, a flour mill, and a brickyard.
The town was also home to a number of other businesses, including a hotel, a bank, a newspaper, a blacksmith shop, and a livery stable. The town also had a number of churches, including the Methodist Episcopal Church, the Presbyterian Church, and the Christian Church.
In the late 19th century, the town was a major stop on the Monon Railroad. This allowed the town to become a major shipping center for the surrounding area. The railroad also allowed the town to become a major center for the coal industry.
Geography
Veedersburg is located at 40°25'25" North, 87°20'45" West (40.423, -87.346). The town is situated in the Wabash Valley, which is part of the larger Midwest region. The town is located on the banks of the Wabash River.
The town has a total area of 1.2 square miles, all of which is land. The town is located in a flat, rural area. The terrain is mostly flat, with some rolling hills.
Economy
The economy of Veedersburg is largely based on agriculture and manufacturing. The town is home to a number of small businesses, including a grocery store, a hardware store, a pharmacy, and a bank. The town also has a number of restaurants and bars.
The town is also home to a number of manufacturing companies, including a plastics manufacturer, a metal fabricator, and a machine shop. The town is also home to a number of agricultural businesses, including a dairy farm, a grain elevator, and a feed mill.
Demographics
As of the 2010 census, the population of Veedersburg was 1,845. The racial makeup of the town was 97.3% White, 0.3% African American, 0.2% Native American, 0.2% Asian, 0.1% Pacific Islander, 0.7% from other races, and 1.2% from two or more races. Hispanic or Latino of any race were 1.7% of the population.
The median income for a household in the town was $37,500, and the median income for a family was $45,000. The per capita income for the town was $18,845. About 11.2% of families and 14.2% of the population were below the poverty line, including 19.2% of those under age 18 and 8.2% of those age 65 or over.
Common Questions
What is Per Capita Income in Veedersburg?
Per Capita income in Veedersburg is $29,524.
What is the Median Family Income in Veedersburg?
Median Family Income in Veedersburg is $59,444.
What is the Median Household income in Veedersburg?
Median Household Income in Veedersburg is $48,750.
What is Income or Wage Gap in Veedersburg?
Income or Wage Gap in Veedersburg is 28.4%.
Women in Veedersburg earn 71.6 cents for every dollar earned by a man.
What is Inequality or Gini Index in Veedersburg?
Inequality or Gini Index in Veedersburg is 0.45.
What is the Total Population of Veedersburg?
Total Population of Veedersburg is 1,948.
What is the Total Male Population of Veedersburg?
Total Male Population of Veedersburg is 962.
What is the Total Female Population of Veedersburg?
Total Female Population of Veedersburg is 986.
What is the Ratio of Males per 100 Females in Veedersburg?
There are 97.57 Males per 100 Females in Veedersburg.
What is the Ratio of Females per 100 Males in Veedersburg?
There are 102.49 Females per 100 Males in Veedersburg.
What is the Median Population Age in Veedersburg?
Median Population Age in Veedersburg is 47.4 Years.
What is the Average Family Size in Veedersburg
Average Family Size in Veedersburg is 2.5 People.
What is the Average Household Size in Veedersburg
Average Household Size in Veedersburg is 2.2 People.
How Large is the Labor Force in Veedersburg?
There are 911 People in the Labor Forcein in Veedersburg.
What is the Percentage of People in the Labor Force in Veedersburg?
57.1% of People are in the Labor Force in Veedersburg.
What is the Unemployment Rate in Veedersburg?
Unemployment Rate in Veedersburg is 9.0%.