Universal, IN Map & Demographics
Universal Map
Universal Overview
$26,413
PER CAPITA INCOME
$60,833
AVG FAMILY INCOME
$55,000
AVG HOUSEHOLD INCOME
$5,143
FAMILY INCOME DEFICIT
0.32
INEQUALITY / GINI INDEX
260
TOTAL POPULATION
110
MALE POPULATION
150
FEMALE POPULATION
73.33
MALES / 100 FEMALES
136.36
FEMALES / 100 MALES
40.6
MEDIAN AGE
2.8
AVG FAMILY SIZE
2.2
AVG HOUSEHOLD SIZE
113
LABOR FORCE [ PEOPLE ]
54.3%
PERCENT IN LABOR FORCE
6.2%
UNEMPLOYMENT RATE
Universal Zip Codes
Universal Area Codes
Income in Universal
Income Overview in Universal
Per Capita Income in Universal is $26,413, while median incomes of families and households are $60,833 and $55,000 respectively.
| Characteristic | Number | Measure |
| Per Capita Income | 260 | $26,413 |
| Median Family Income | 74 | $60,833 |
| Mean Family Income | 74 | $62,186 |
| Median Household Income | 118 | $55,000 |
| Mean Household Income | 118 | $56,084 |
| Income Deficit | 74 | $5,143 |
| Wage / Income Gap (%) | 260 | 0.00% |
| Wage / Income Gap ($) | 260 | 100.00¢ per $1 |
| Gini / Inequality Index | 260 | 0.32 |
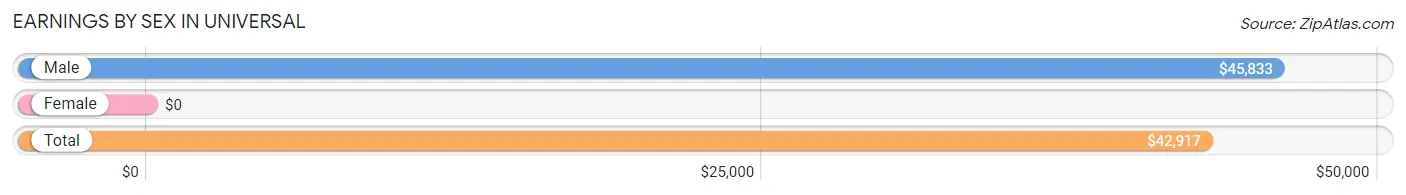
Earnings by Sex in Universal
| Sex | Number | Average Earnings |
| Male | 66 (55.9%) | $45,833 |
| Female | 52 (44.1%) | $0 |
| Total | 118 (100.0%) | $42,917 |
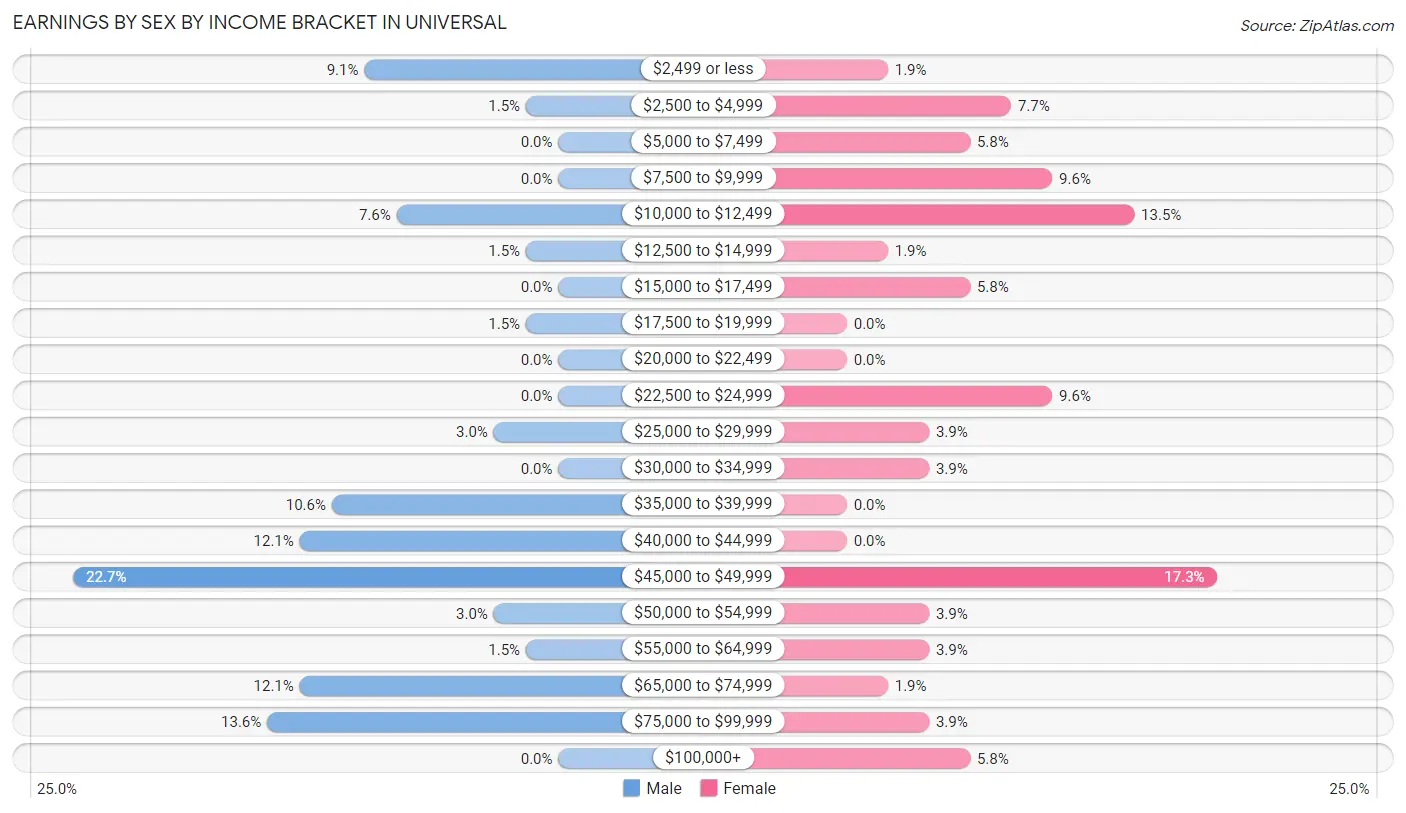
Earnings by Sex by Income Bracket in Universal
The most common earnings brackets in Universal are $45,000 to $49,999 for men (15 | 22.7%) and $45,000 to $49,999 for women (9 | 17.3%).
| Income | Male | Female |
| $2,499 or less | 6 (9.1%) | 1 (1.9%) |
| $2,500 to $4,999 | 1 (1.5%) | 4 (7.7%) |
| $5,000 to $7,499 | 0 (0.0%) | 3 (5.8%) |
| $7,500 to $9,999 | 0 (0.0%) | 5 (9.6%) |
| $10,000 to $12,499 | 5 (7.6%) | 7 (13.5%) |
| $12,500 to $14,999 | 1 (1.5%) | 1 (1.9%) |
| $15,000 to $17,499 | 0 (0.0%) | 3 (5.8%) |
| $17,500 to $19,999 | 1 (1.5%) | 0 (0.0%) |
| $20,000 to $22,499 | 0 (0.0%) | 0 (0.0%) |
| $22,500 to $24,999 | 0 (0.0%) | 5 (9.6%) |
| $25,000 to $29,999 | 2 (3.0%) | 2 (3.8%) |
| $30,000 to $34,999 | 0 (0.0%) | 2 (3.8%) |
| $35,000 to $39,999 | 7 (10.6%) | 0 (0.0%) |
| $40,000 to $44,999 | 8 (12.1%) | 0 (0.0%) |
| $45,000 to $49,999 | 15 (22.7%) | 9 (17.3%) |
| $50,000 to $54,999 | 2 (3.0%) | 2 (3.8%) |
| $55,000 to $64,999 | 1 (1.5%) | 2 (3.8%) |
| $65,000 to $74,999 | 8 (12.1%) | 1 (1.9%) |
| $75,000 to $99,999 | 9 (13.6%) | 2 (3.8%) |
| $100,000+ | 0 (0.0%) | 3 (5.8%) |
| Total | 66 (100.0%) | 52 (100.0%) |
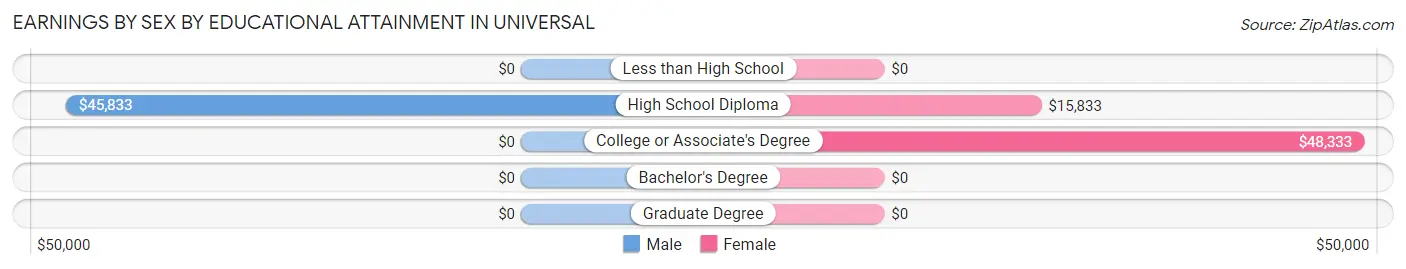
Earnings by Sex by Educational Attainment in Universal
| Educational Attainment | Male Income | Female Income |
| Less than High School | - | - |
| High School Diploma | $45,833 | $15,833 |
| College or Associate's Degree | - | - |
| Bachelor's Degree | - | - |
| Graduate Degree | - | - |
| Total | $47,917 | $0 |
Family Income in Universal
Family Income Brackets in Universal
According to the Universal family income data, there are 29 families falling into the $50,000 to $74,999 income range, which is the most common income bracket and makes up 39.2% of all families.
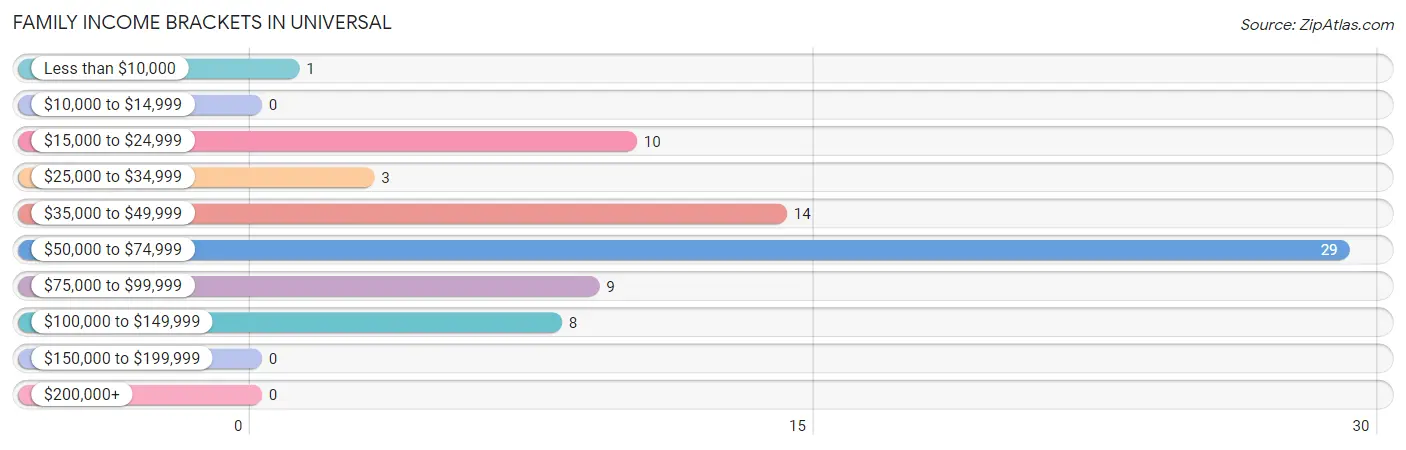
| Income Bracket | # Families | % Families |
| Less than $10,000 | 1 | 1.4% |
| $10,000 to $14,999 | 0 | 0.0% |
| $15,000 to $24,999 | 10 | 13.5% |
| $25,000 to $34,999 | 3 | 4.1% |
| $35,000 to $49,999 | 14 | 18.9% |
| $50,000 to $74,999 | 29 | 39.2% |
| $75,000 to $99,999 | 9 | 12.2% |
| $100,000 to $149,999 | 8 | 10.8% |
| $150,000 to $199,999 | 0 | 0.0% |
| $200,000+ | 0 | 0.0% |
Family Income by Famaliy Size in Universal
2-person families (36 | 48.6%) account for the highest median family income in Universal with $62,500 per family, while 2-person families (36 | 48.6%) have the highest median income of $31,250 per family member.
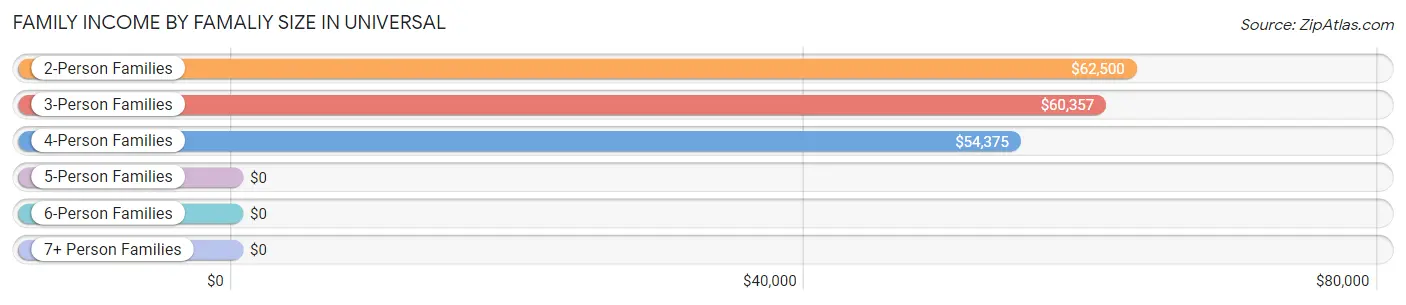
| Income Bracket | # Families | Median Income |
| 2-Person Families | 36 (48.6%) | $62,500 |
| 3-Person Families | 14 (18.9%) | $60,357 |
| 4-Person Families | 21 (28.4%) | $54,375 |
| 5-Person Families | 3 (4.1%) | $0 |
| 6-Person Families | 0 (0.0%) | $0 |
| 7+ Person Families | 0 (0.0%) | $0 |
| Total | 74 (100.0%) | $60,833 |
Family Income by Number of Earners in Universal
The median family income in Universal is $60,833, with families comprising 2 earners (16) having the highest median family income of $98,000, while families with 1 earner (28) have the lowest median family income of $48,846, accounting for 21.6% and 37.8% of families, respectively.
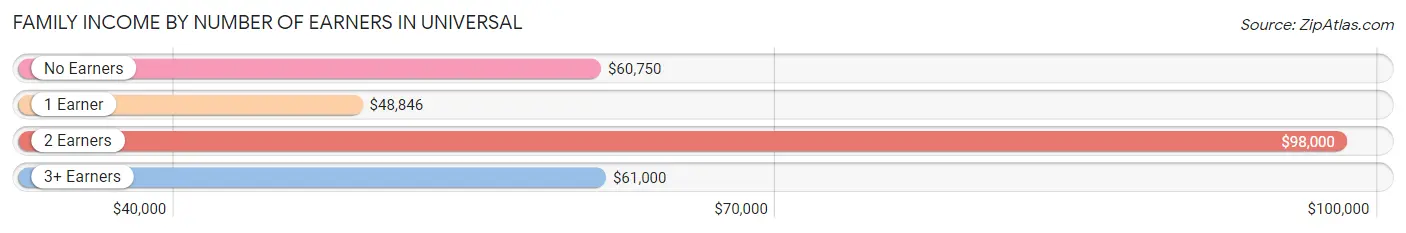
| Number of Earners | # Families | Median Income |
| No Earners | 22 (29.7%) | $60,750 |
| 1 Earner | 28 (37.8%) | $48,846 |
| 2 Earners | 16 (21.6%) | $98,000 |
| 3+ Earners | 8 (10.8%) | $61,000 |
| Total | 74 (100.0%) | $60,833 |
Household Income in Universal
Household Income Brackets in Universal
With 42 households falling in the category, the $50,000 to $74,999 income range is the most frequent in Universal, accounting for 35.6% of all households.
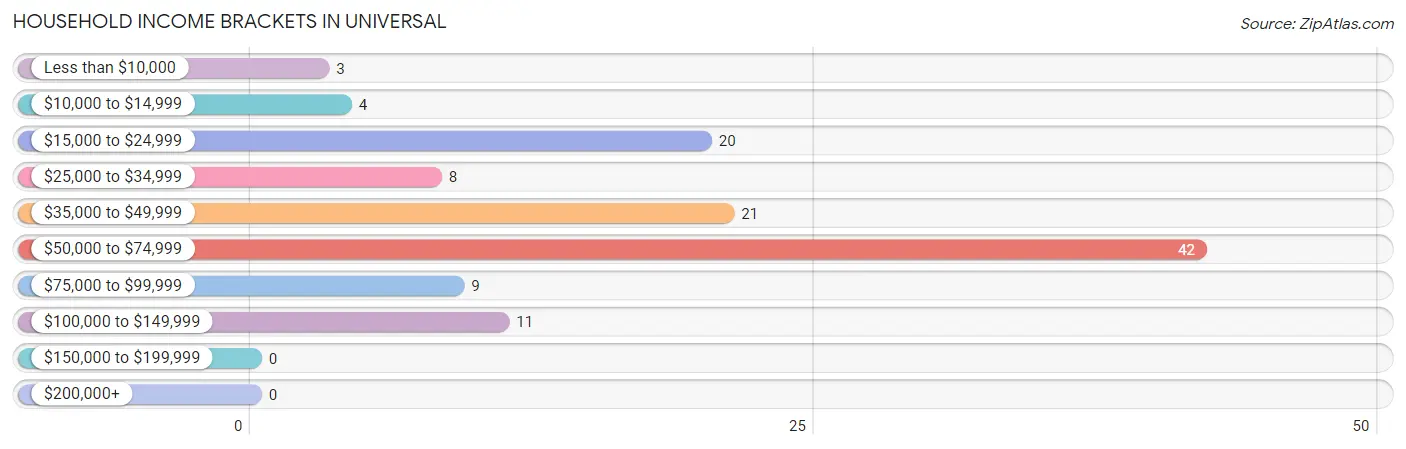
| Income Bracket | # Households | % Households |
| Less than $10,000 | 3 | 2.5% |
| $10,000 to $14,999 | 4 | 3.4% |
| $15,000 to $24,999 | 20 | 16.9% |
| $25,000 to $34,999 | 8 | 6.8% |
| $35,000 to $49,999 | 21 | 17.8% |
| $50,000 to $74,999 | 42 | 35.6% |
| $75,000 to $99,999 | 9 | 7.6% |
| $100,000 to $149,999 | 11 | 9.3% |
| $150,000 to $199,999 | 0 | 0.0% |
| $200,000+ | 0 | 0.0% |
Household Income by Householder Age in Universal
The median household income in Universal is $55,000, with the highest median household income of $71,000 found in the 25 to 44 years age bracket for the primary householder. A total of 30 households (25.4%) fall into this category. Meanwhile, the 15 to 24 years age bracket for the primary householder has the lowest median household income of $0, with 5 households (4.2%) in this group.
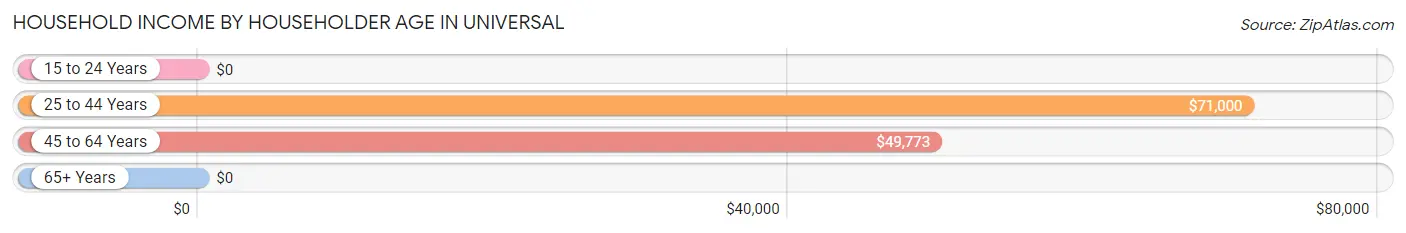
| Income Bracket | # Households | Median Income |
| 15 to 24 Years | 5 (4.2%) | $0 |
| 25 to 44 Years | 30 (25.4%) | $71,000 |
| 45 to 64 Years | 40 (33.9%) | $49,773 |
| 65+ Years | 43 (36.4%) | $0 |
| Total | 118 (100.0%) | $55,000 |
Poverty in Universal
Income Below Poverty by Sex and Age in Universal
With 10.9% poverty level for males and 12.7% for females among the residents of Universal, 15 year old males and 6 to 11 year old females are the most vulnerable to poverty, with 1 males (100.0%) and 7 females (53.8%) in their respective age groups living below the poverty level.
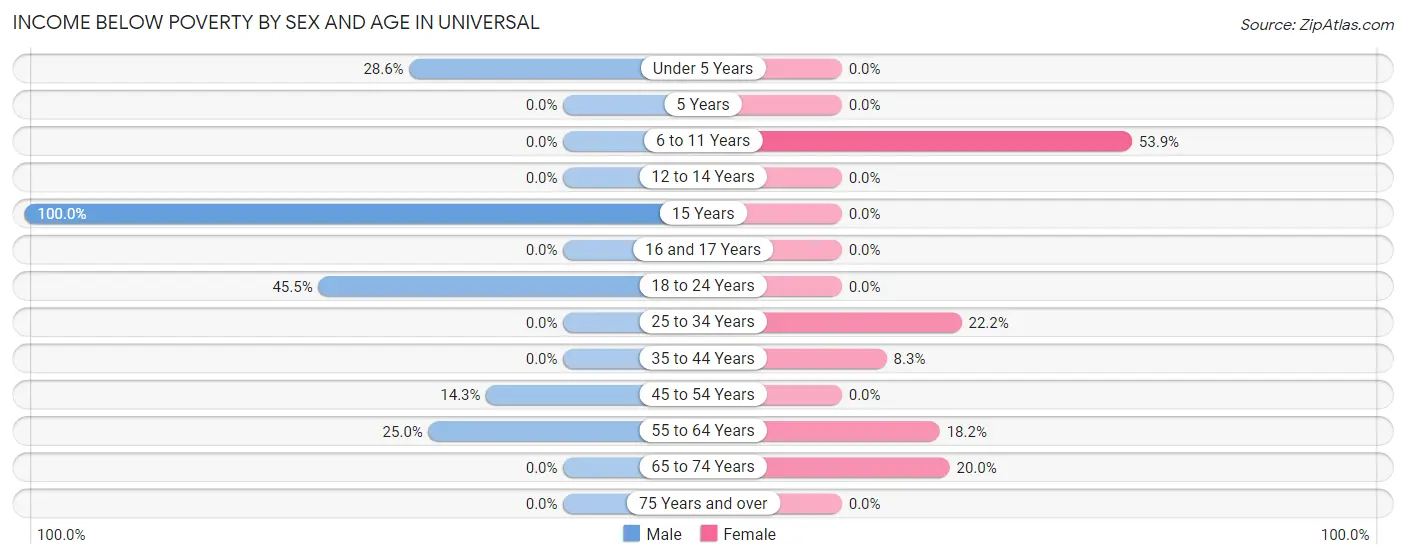
| Age Bracket | Male | Female |
| Under 5 Years | 2 (28.6%) | 0 (0.0%) |
| 5 Years | 0 (0.0%) | 0 (0.0%) |
| 6 to 11 Years | 0 (0.0%) | 7 (53.8%) |
| 12 to 14 Years | 0 (0.0%) | 0 (0.0%) |
| 15 Years | 1 (100.0%) | 0 (0.0%) |
| 16 and 17 Years | 0 (0.0%) | 0 (0.0%) |
| 18 to 24 Years | 5 (45.5%) | 0 (0.0%) |
| 25 to 34 Years | 0 (0.0%) | 2 (22.2%) |
| 35 to 44 Years | 0 (0.0%) | 1 (8.3%) |
| 45 to 54 Years | 1 (14.3%) | 0 (0.0%) |
| 55 to 64 Years | 3 (25.0%) | 6 (18.2%) |
| 65 to 74 Years | 0 (0.0%) | 3 (20.0%) |
| 75 Years and over | 0 (0.0%) | 0 (0.0%) |
| Total | 12 (10.9%) | 19 (12.7%) |
Income Above Poverty by Sex and Age in Universal
According to the poverty statistics in Universal, males aged 5 years and females aged 12 to 14 years are the age groups that are most secure financially, with 100.0% of males and 100.0% of females in these age groups living above the poverty line.
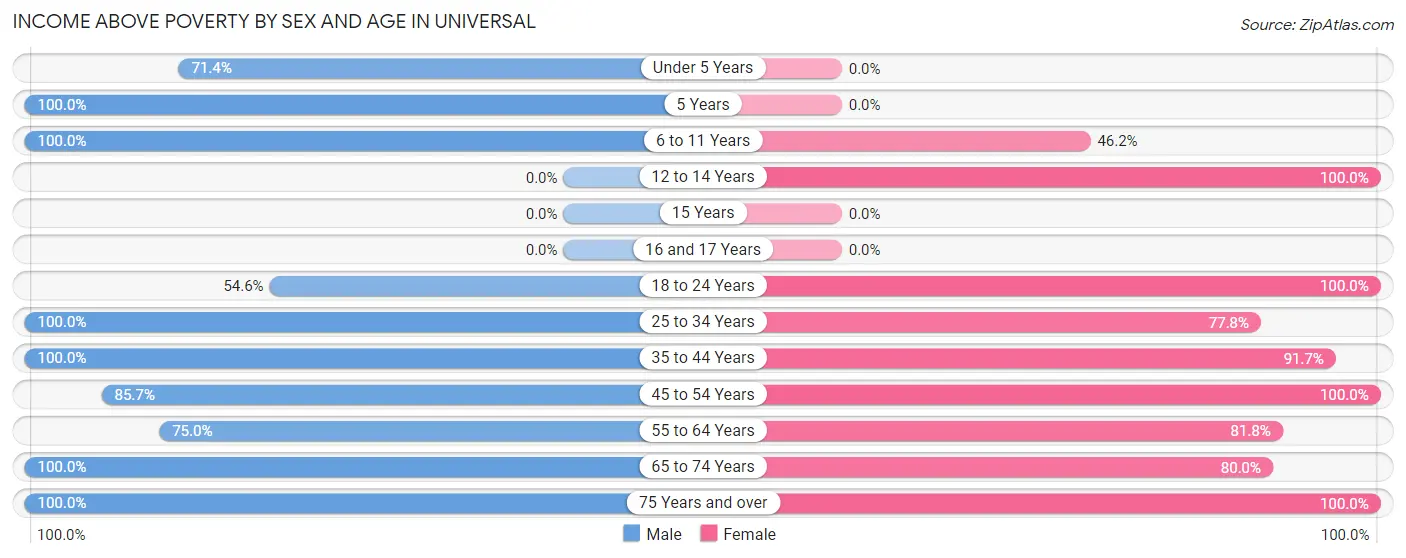
| Age Bracket | Male | Female |
| Under 5 Years | 5 (71.4%) | 0 (0.0%) |
| 5 Years | 4 (100.0%) | 0 (0.0%) |
| 6 to 11 Years | 9 (100.0%) | 6 (46.2%) |
| 12 to 14 Years | 0 (0.0%) | 18 (100.0%) |
| 15 Years | 0 (0.0%) | 0 (0.0%) |
| 16 and 17 Years | 0 (0.0%) | 0 (0.0%) |
| 18 to 24 Years | 6 (54.5%) | 20 (100.0%) |
| 25 to 34 Years | 15 (100.0%) | 7 (77.8%) |
| 35 to 44 Years | 19 (100.0%) | 11 (91.7%) |
| 45 to 54 Years | 6 (85.7%) | 8 (100.0%) |
| 55 to 64 Years | 9 (75.0%) | 27 (81.8%) |
| 65 to 74 Years | 22 (100.0%) | 12 (80.0%) |
| 75 Years and over | 3 (100.0%) | 22 (100.0%) |
| Total | 98 (89.1%) | 131 (87.3%) |
Income Below Poverty Among Married-Couple Families in Universal
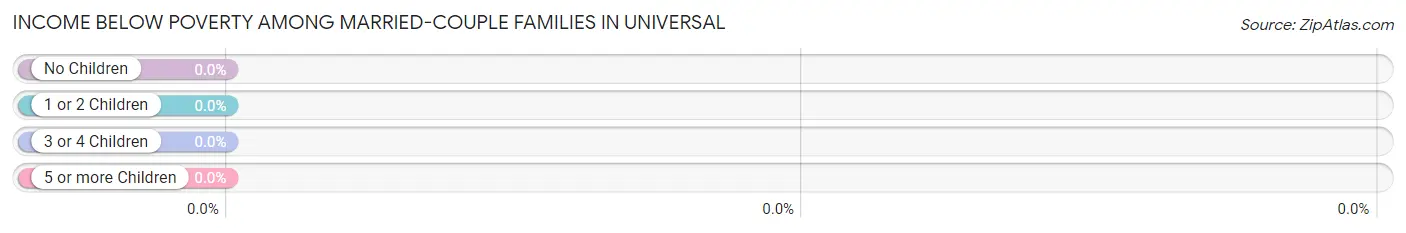
| Children | Above Poverty | Below Poverty |
| No Children | 27 (100.0%) | 0 (0.0%) |
| 1 or 2 Children | 13 (100.0%) | 0 (0.0%) |
| 3 or 4 Children | 0 (0.0%) | 0 (0.0%) |
| 5 or more Children | 0 (0.0%) | 0 (0.0%) |
| Total | 40 (100.0%) | 0 (0.0%) |
Income Below Poverty Among Single-Parent Households in Universal
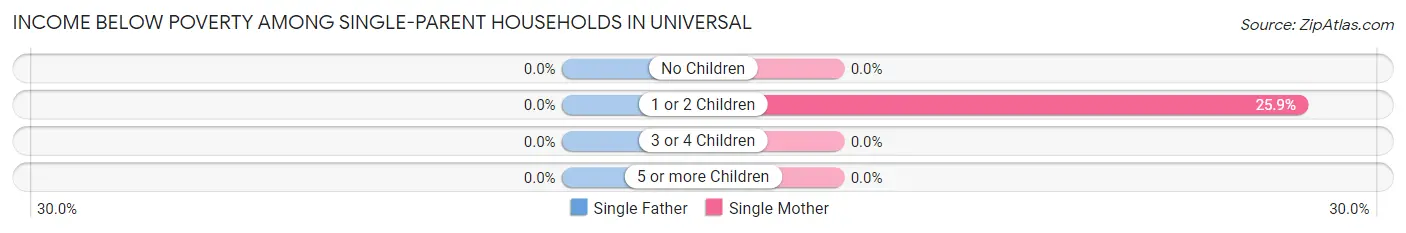
| Children | Single Father | Single Mother |
| No Children | 0 (0.0%) | 0 (0.0%) |
| 1 or 2 Children | 0 (0.0%) | 7 (25.9%) |
| 3 or 4 Children | 0 (0.0%) | 0 (0.0%) |
| 5 or more Children | 0 (0.0%) | 0 (0.0%) |
| Total | 0 (0.0%) | 7 (21.9%) |
Income Below Poverty Among Married-Couple vs Single-Parent Households in Universal
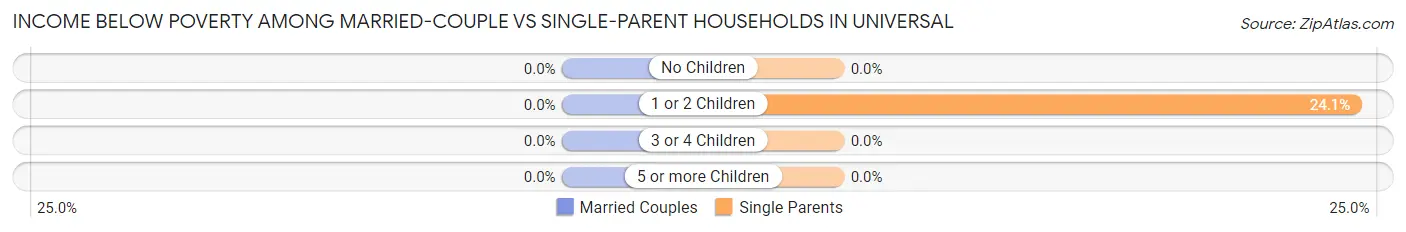
| Children | Married-Couple Families | Single-Parent Households |
| No Children | 0 (0.0%) | 0 (0.0%) |
| 1 or 2 Children | 0 (0.0%) | 7 (24.1%) |
| 3 or 4 Children | 0 (0.0%) | 0 (0.0%) |
| 5 or more Children | 0 (0.0%) | 0 (0.0%) |
| Total | 0 (0.0%) | 7 (20.6%) |
Race in Universal
The most populous races in Universal are White / Caucasian (250 | 96.2%), Two or more Races (9 | 3.5%), and Hispanic or Latino (1 | 0.4%).
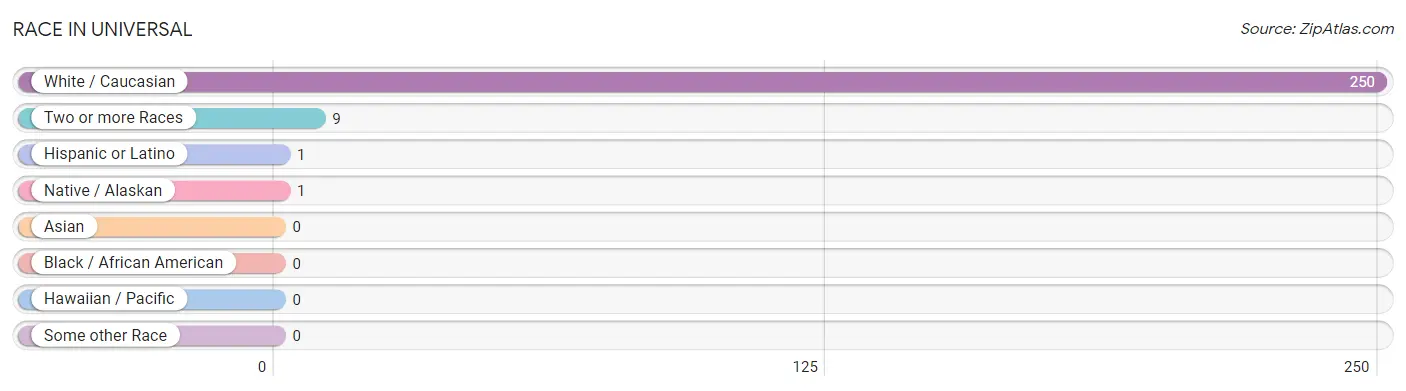
| Race | # Population | % Population |
| Asian | 0 | 0.0% |
| Black / African American | 0 | 0.0% |
| Hawaiian / Pacific | 0 | 0.0% |
| Hispanic or Latino | 1 | 0.4% |
| Native / Alaskan | 1 | 0.4% |
| White / Caucasian | 250 | 96.2% |
| Two or more Races | 9 | 3.5% |
| Some other Race | 0 | 0.0% |
| Total | 260 | 100.0% |
Ancestry in Universal
The most populous ancestries reported in Universal are German (36 | 13.9%), American (28 | 10.8%), English (18 | 6.9%), Irish (13 | 5.0%), and French (7 | 2.7%), together accounting for 39.2% of all Universal residents.
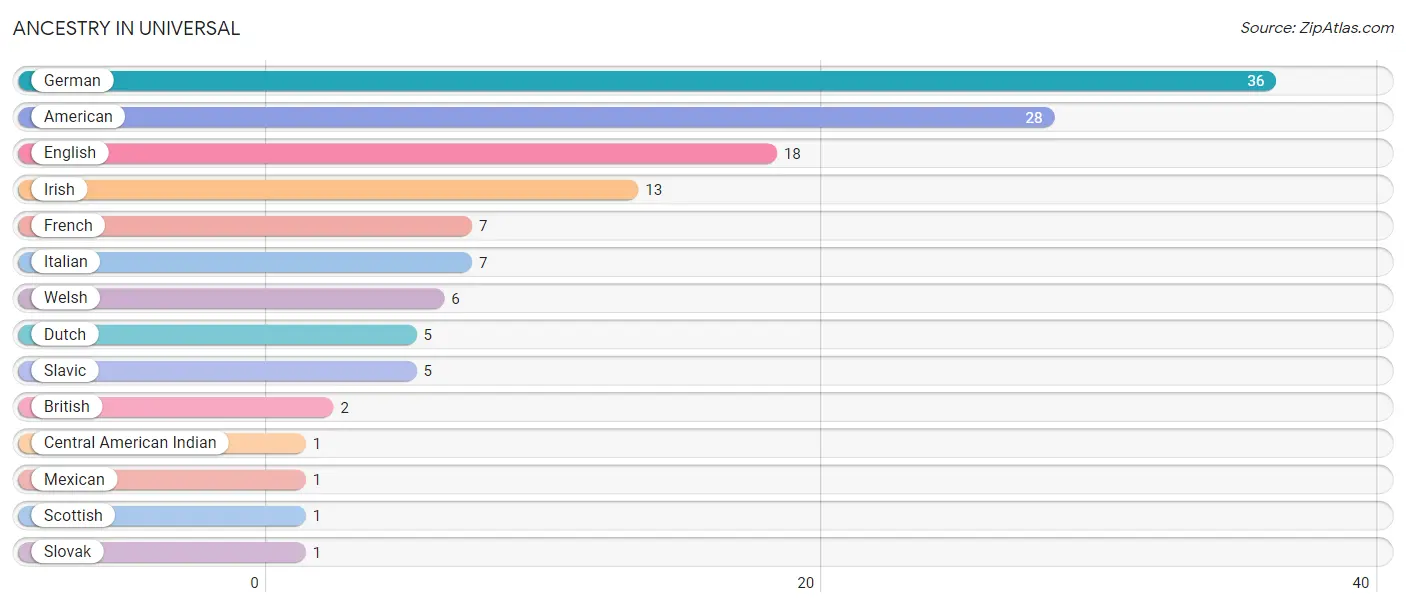
| Ancestry | # Population | % Population |
| American | 28 | 10.8% |
| British | 2 | 0.8% |
| Central American Indian | 1 | 0.4% |
| Dutch | 5 | 1.9% |
| English | 18 | 6.9% |
| French | 7 | 2.7% |
| German | 36 | 13.9% |
| Irish | 13 | 5.0% |
| Italian | 7 | 2.7% |
| Mexican | 1 | 0.4% |
| Scottish | 1 | 0.4% |
| Slavic | 5 | 1.9% |
| Slovak | 1 | 0.4% |
| Welsh | 6 | 2.3% | View All 14 Rows |
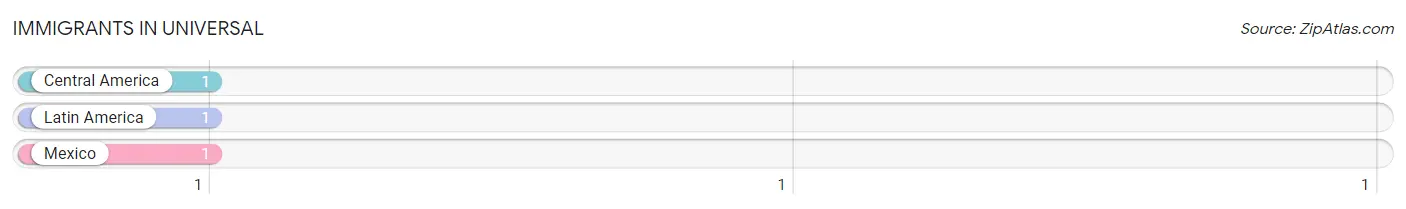
Immigrants in Universal
The most numerous immigrant groups reported in Universal came from Central America (1 | 0.4%), Latin America (1 | 0.4%), and Mexico (1 | 0.4%), together accounting for 1.1% of all Universal residents.
| Immigration Origin | # Population | % Population |
| Central America | 1 | 0.4% |
| Latin America | 1 | 0.4% |
| Mexico | 1 | 0.4% | View All 3 Rows |
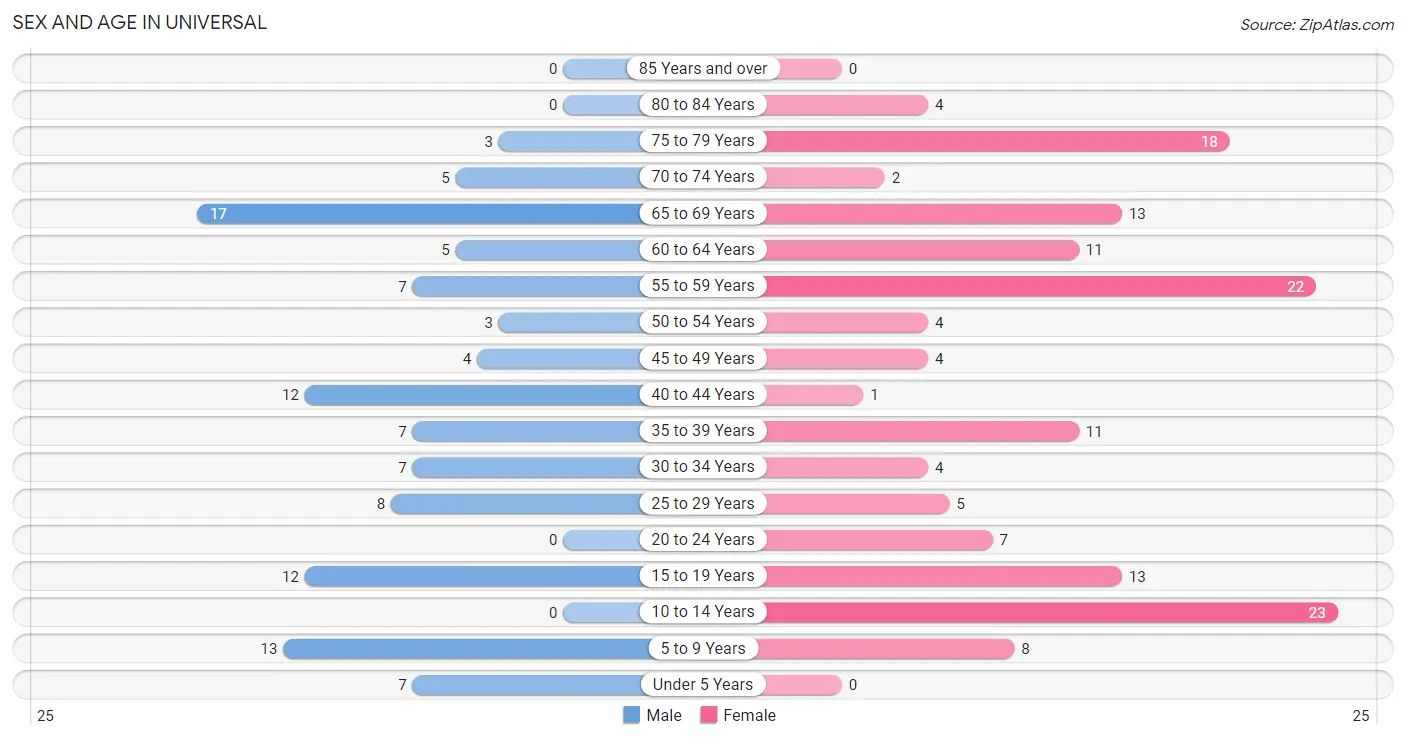
Sex and Age in Universal
Sex and Age in Universal
The most populous age groups in Universal are 65 to 69 Years (17 | 15.4%) for men and 10 to 14 Years (23 | 15.3%) for women.
| Age Bracket | Male | Female |
| Under 5 Years | 7 (6.4%) | 0 (0.0%) |
| 5 to 9 Years | 13 (11.8%) | 8 (5.3%) |
| 10 to 14 Years | 0 (0.0%) | 23 (15.3%) |
| 15 to 19 Years | 12 (10.9%) | 13 (8.7%) |
| 20 to 24 Years | 0 (0.0%) | 7 (4.7%) |
| 25 to 29 Years | 8 (7.3%) | 5 (3.3%) |
| 30 to 34 Years | 7 (6.4%) | 4 (2.7%) |
| 35 to 39 Years | 7 (6.4%) | 11 (7.3%) |
| 40 to 44 Years | 12 (10.9%) | 1 (0.7%) |
| 45 to 49 Years | 4 (3.6%) | 4 (2.7%) |
| 50 to 54 Years | 3 (2.7%) | 4 (2.7%) |
| 55 to 59 Years | 7 (6.4%) | 22 (14.7%) |
| 60 to 64 Years | 5 (4.5%) | 11 (7.3%) |
| 65 to 69 Years | 17 (15.4%) | 13 (8.7%) |
| 70 to 74 Years | 5 (4.5%) | 2 (1.3%) |
| 75 to 79 Years | 3 (2.7%) | 18 (12.0%) |
| 80 to 84 Years | 0 (0.0%) | 4 (2.7%) |
| 85 Years and over | 0 (0.0%) | 0 (0.0%) |
| Total | 110 (100.0%) | 150 (100.0%) |
Families and Households in Universal
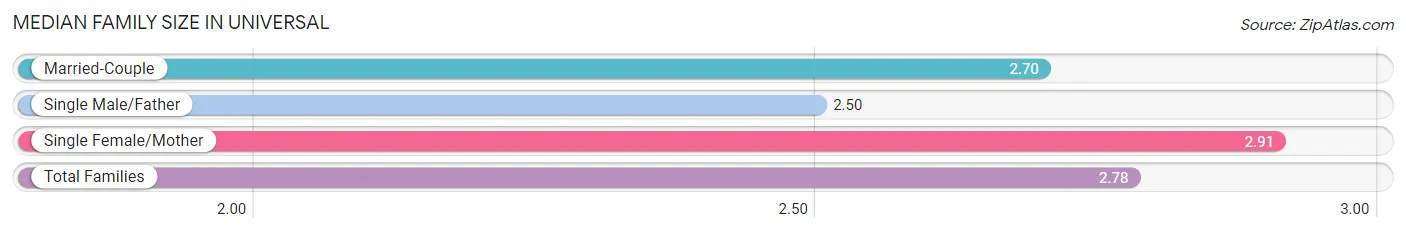
Median Family Size in Universal
The median family size in Universal is 2.78 persons per family, with single female/mother families (32 | 43.2%) accounting for the largest median family size of 2.91 persons per family. On the other hand, single male/father families (2 | 2.7%) represent the smallest median family size with 2.50 persons per family.
| Family Type | # Families | Family Size |
| Married-Couple | 40 (54.0%) | 2.70 |
| Single Male/Father | 2 (2.7%) | 2.50 |
| Single Female/Mother | 32 (43.2%) | 2.91 |
| Total Families | 74 (100.0%) | 2.78 |
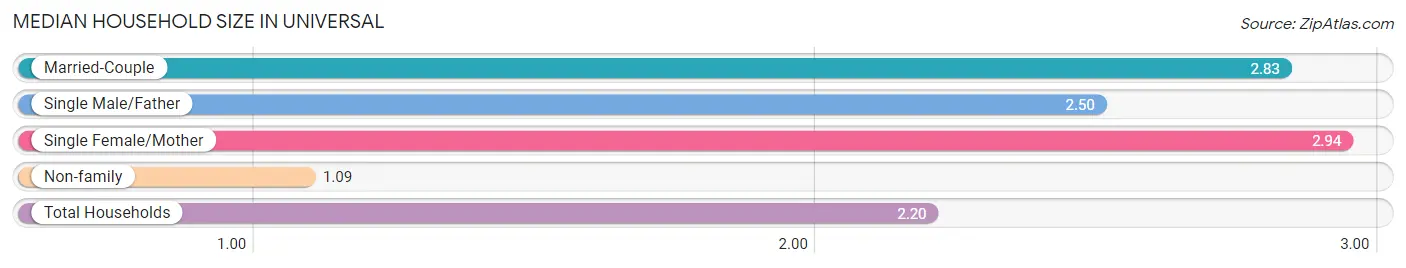
Median Household Size in Universal
The median household size in Universal is 2.20 persons per household, with single female/mother households (32 | 27.1%) accounting for the largest median household size of 2.94 persons per household. non-family households (44 | 37.3%) represent the smallest median household size with 1.09 persons per household.
| Household Type | # Households | Household Size |
| Married-Couple | 40 (33.9%) | 2.83 |
| Single Male/Father | 2 (1.7%) | 2.50 |
| Single Female/Mother | 32 (27.1%) | 2.94 |
| Non-family | 44 (37.3%) | 1.09 |
| Total Households | 118 (100.0%) | 2.20 |
Household Size by Marriage Status in Universal
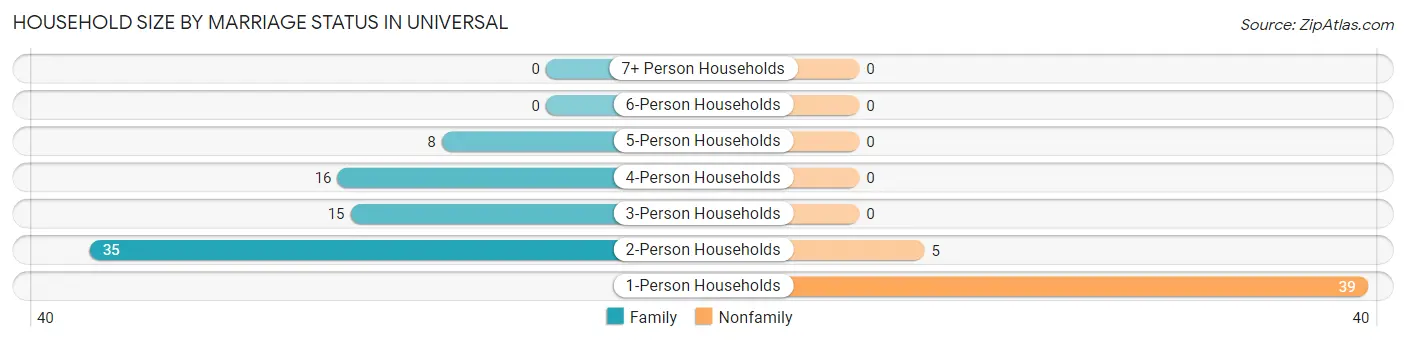
Out of a total of 118 households in Universal, 74 (62.7%) are family households, while 44 (37.3%) are nonfamily households. The most numerous type of family households are 2-person households, comprising 35, and the most common type of nonfamily households are 1-person households, comprising 39.
| Household Size | Family Households | Nonfamily Households |
| 1-Person Households | - | 39 (33.1%) |
| 2-Person Households | 35 (29.7%) | 5 (4.2%) |
| 3-Person Households | 15 (12.7%) | 0 (0.0%) |
| 4-Person Households | 16 (13.6%) | 0 (0.0%) |
| 5-Person Households | 8 (6.8%) | 0 (0.0%) |
| 6-Person Households | 0 (0.0%) | 0 (0.0%) |
| 7+ Person Households | 0 (0.0%) | 0 (0.0%) |
| Total | 74 (62.7%) | 44 (37.3%) |
Female Fertility in Universal
Fertility by Age in Universal
| Age Bracket | Women with Births | Births / 1,000 Women |
| 15 to 19 years | 0 (0.0%) | 0.0 |
| 20 to 34 years | 0 (0.0%) | 0.0 |
| 35 to 50 years | 0 (0.0%) | 0.0 |
| Total | 0 (0.0%) | 0.0 |
Fertility by Age by Marriage Status in Universal
| Age Bracket | Married | Unmarried |
| 15 to 19 years | 0 (0.0%) | 0 (0.0%) |
| 20 to 34 years | 0 (0.0%) | 0 (0.0%) |
| 35 to 50 years | 0 (0.0%) | 0 (0.0%) |
| Total | 0 (0.0%) | 0 (0.0%) |
Fertility by Education in Universal
| Educational Attainment | Women with Births | Births / 1,000 Women |
| Less than High School | 0 (0.0%) | 0.0 |
| High School Diploma | 0 (0.0%) | 0.0 |
| College or Associate's Degree | 0 (0.0%) | 0.0 |
| Bachelor's Degree | 0 (0.0%) | 0.0 |
| Graduate Degree | 0 (0.0%) | 0.0 |
| Total | 0 (0.0%) | 0.0 |
Fertility by Education by Marriage Status in Universal
| Educational Attainment | Married | Unmarried |
| Less than High School | 0 (0.0%) | 0 (0.0%) |
| High School Diploma | 0 (0.0%) | 0 (0.0%) |
| College or Associate's Degree | 0 (0.0%) | 0 (0.0%) |
| Bachelor's Degree | 0 (0.0%) | 0 (0.0%) |
| Graduate Degree | 0 (0.0%) | 0 (0.0%) |
| Total | 0 (0.0%) | 0 (0.0%) |
Employment Characteristics in Universal
Employment by Class of Employer in Universal
Among the 106 employed individuals in Universal, private company employees (82 | 77.4%), local government employees (11 | 10.4%), and federal government employees (9 | 8.5%) make up the most common classes of employment.
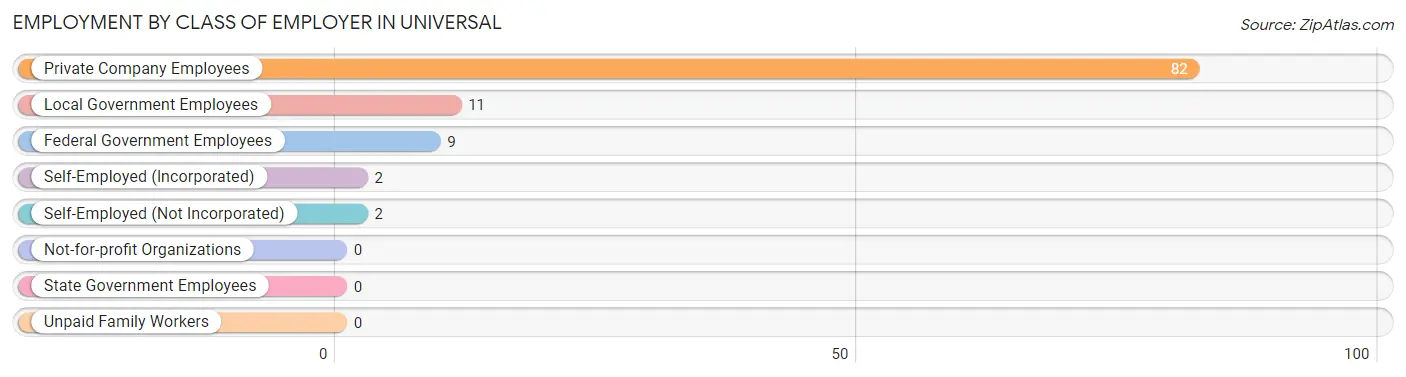
| Employer Class | # Employees | % Employees |
| Private Company Employees | 82 | 77.4% |
| Self-Employed (Incorporated) | 2 | 1.9% |
| Self-Employed (Not Incorporated) | 2 | 1.9% |
| Not-for-profit Organizations | 0 | 0.0% |
| Local Government Employees | 11 | 10.4% |
| State Government Employees | 0 | 0.0% |
| Federal Government Employees | 9 | 8.5% |
| Unpaid Family Workers | 0 | 0.0% |
| Total | 106 | 100.0% |
Employment Status by Age in Universal
According to the labor force statistics for Universal, out of the total population over 16 years of age (208), 54.3% or 113 individuals are in the labor force, with 6.2% or 7 of them unemployed. The age group with the highest labor force participation rate is 20 to 24 years, with 100.0% or 7 individuals in the labor force. Within the labor force, the 16 to 19 years age range has the highest percentage of unemployed individuals, with 54.5% or 6 of them being unemployed.
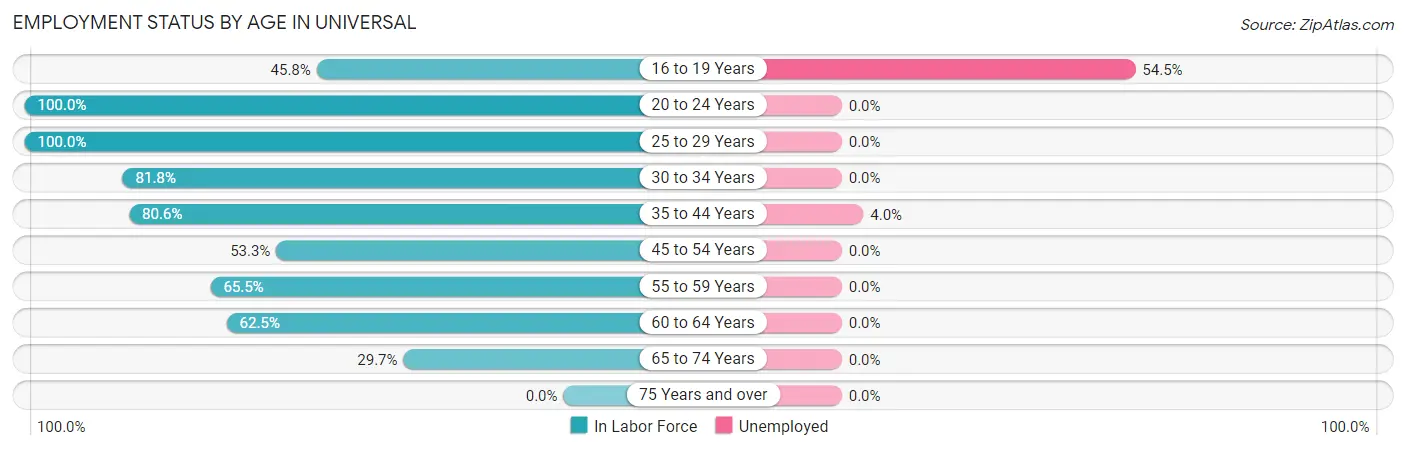
| Age Bracket | In Labor Force | Unemployed |
| 16 to 19 Years | 11 (45.8%) | 6 (54.5%) |
| 20 to 24 Years | 7 (100.0%) | 0 (0.0%) |
| 25 to 29 Years | 13 (100.0%) | 0 (0.0%) |
| 30 to 34 Years | 9 (81.8%) | 0 (0.0%) |
| 35 to 44 Years | 25 (80.6%) | 1 (4.0%) |
| 45 to 54 Years | 8 (53.3%) | 0 (0.0%) |
| 55 to 59 Years | 19 (65.5%) | 0 (0.0%) |
| 60 to 64 Years | 10 (62.5%) | 0 (0.0%) |
| 65 to 74 Years | 11 (29.7%) | 0 (0.0%) |
| 75 Years and over | 0 (0.0%) | 0 (0.0%) |
| Total | 113 (54.3%) | 7 (6.2%) |
Employment Status by Educational Attainment in Universal
According to labor force statistics for Universal, 73.0% of individuals (84) out of the total population between 25 and 64 years of age (115) are in the labor force, with 1.2% or 1 of them being unemployed. The group with the highest labor force participation rate are those with the educational attainment of bachelor's degree or higher, with 93.3% or 14 individuals in the labor force. Within the labor force, individuals with high school diploma education have the highest percentage of unemployment, with 3.1% or 1 of them being unemployed.
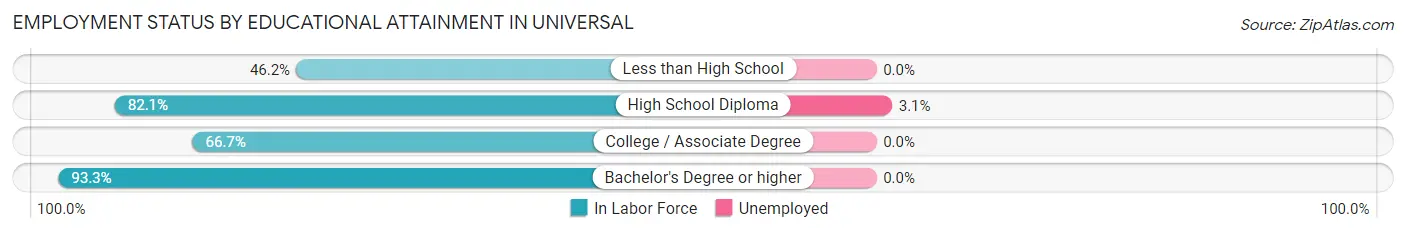
| Educational Attainment | In Labor Force | Unemployed |
| Less than High School | 6 (46.2%) | 0 (0.0%) |
| High School Diploma | 32 (82.1%) | 1 (3.1%) |
| College / Associate Degree | 32 (66.7%) | 0 (0.0%) |
| Bachelor's Degree or higher | 14 (93.3%) | 0 (0.0%) |
| Total | 84 (73.0%) | 1 (1.2%) |
Employment Occupations by Sex in Universal
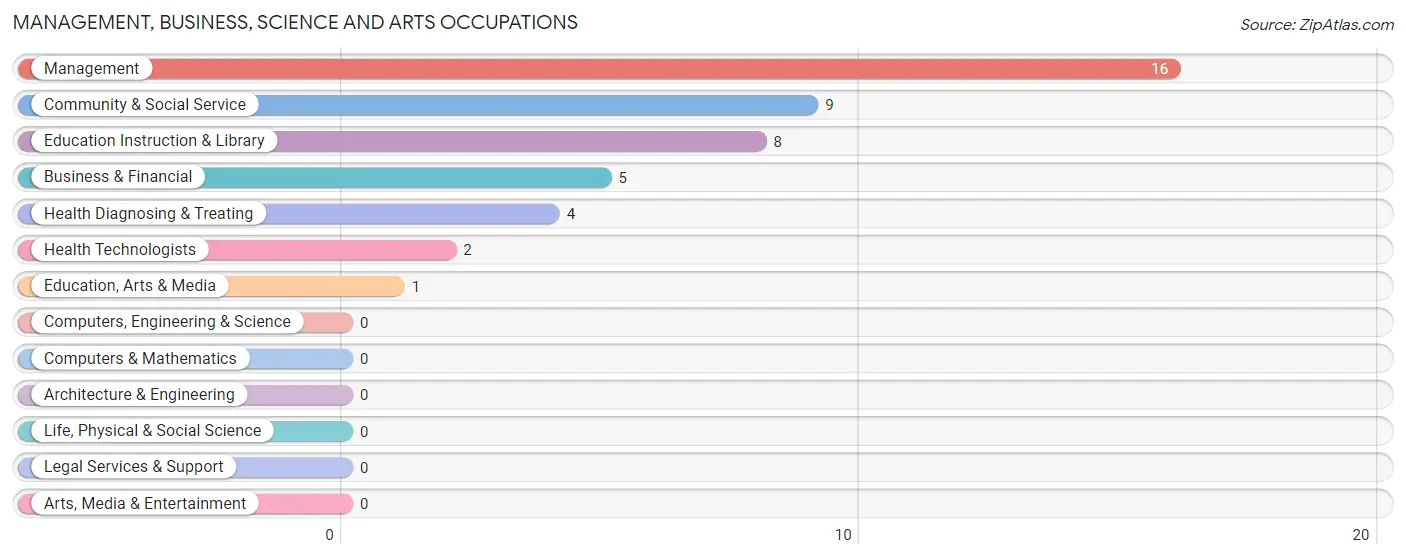
Management, Business, Science and Arts Occupations
The most common Management, Business, Science and Arts occupations in Universal are Management (16 | 15.1%), Community & Social Service (9 | 8.5%), Education Instruction & Library (8 | 7.5%), Business & Financial (5 | 4.7%), and Health Diagnosing & Treating (4 | 3.8%).
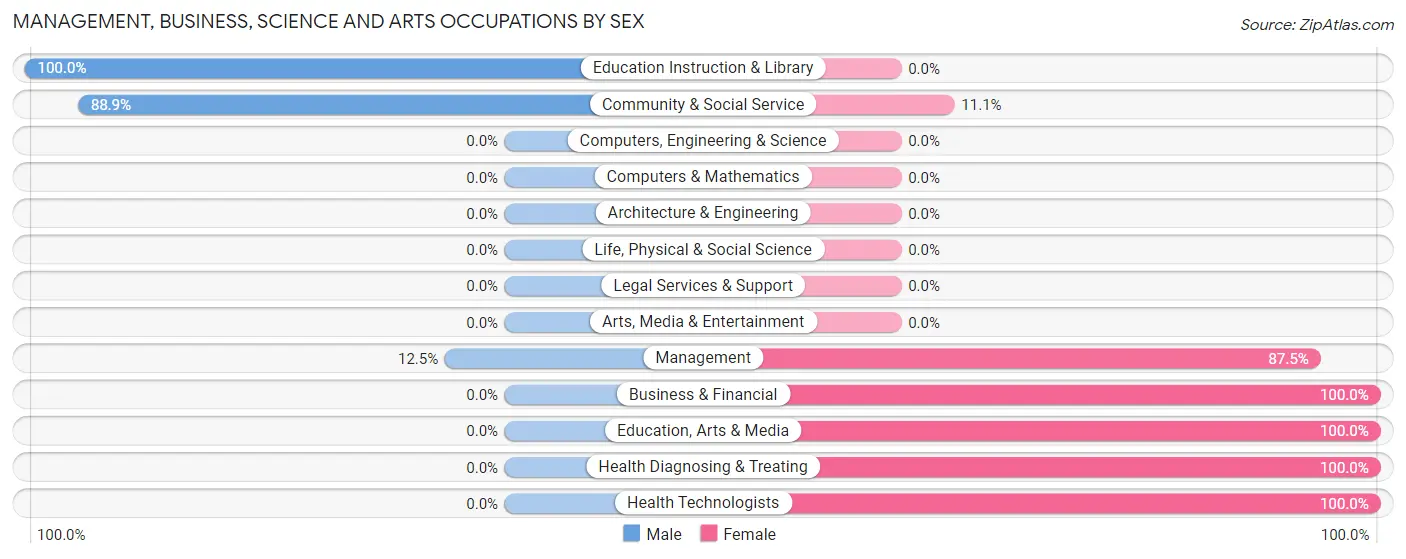
Management, Business, Science and Arts Occupations by Sex
Within the Management, Business, Science and Arts occupations in Universal, the most male-oriented occupations are Education Instruction & Library (100.0%), Community & Social Service (88.9%), and Management (12.5%), while the most female-oriented occupations are Business & Financial (100.0%), Education, Arts & Media (100.0%), and Health Diagnosing & Treating (100.0%).
| Occupation | Male | Female |
| Management | 2 (12.5%) | 14 (87.5%) |
| Business & Financial | 0 (0.0%) | 5 (100.0%) |
| Computers, Engineering & Science | 0 (0.0%) | 0 (0.0%) |
| Computers & Mathematics | 0 (0.0%) | 0 (0.0%) |
| Architecture & Engineering | 0 (0.0%) | 0 (0.0%) |
| Life, Physical & Social Science | 0 (0.0%) | 0 (0.0%) |
| Community & Social Service | 8 (88.9%) | 1 (11.1%) |
| Education, Arts & Media | 0 (0.0%) | 1 (100.0%) |
| Legal Services & Support | 0 (0.0%) | 0 (0.0%) |
| Education Instruction & Library | 8 (100.0%) | 0 (0.0%) |
| Arts, Media & Entertainment | 0 (0.0%) | 0 (0.0%) |
| Health Diagnosing & Treating | 0 (0.0%) | 4 (100.0%) |
| Health Technologists | 0 (0.0%) | 2 (100.0%) |
| Total (Category) | 10 (29.4%) | 24 (70.6%) |
| Total (Overall) | 60 (56.6%) | 46 (43.4%) |
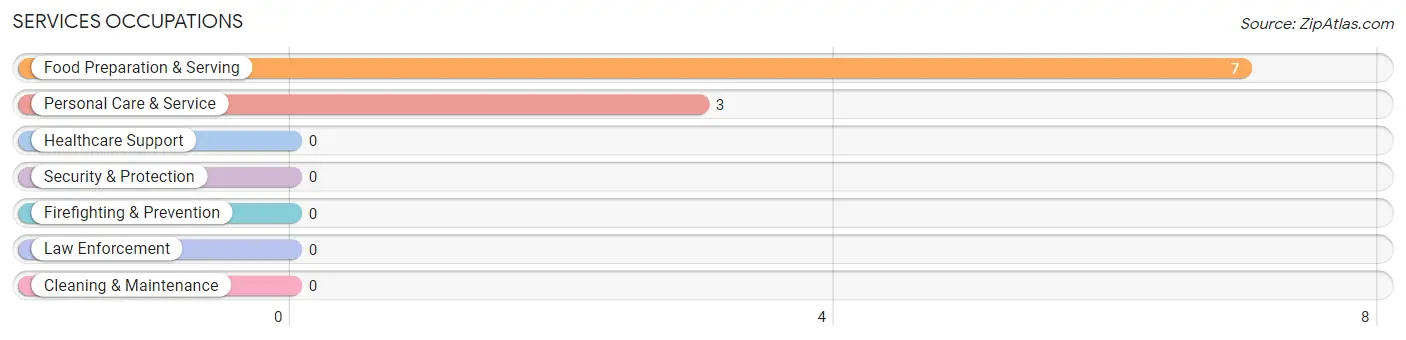
Services Occupations
The most common Services occupations in Universal are Food Preparation & Serving (7 | 6.6%), and Personal Care & Service (3 | 2.8%).
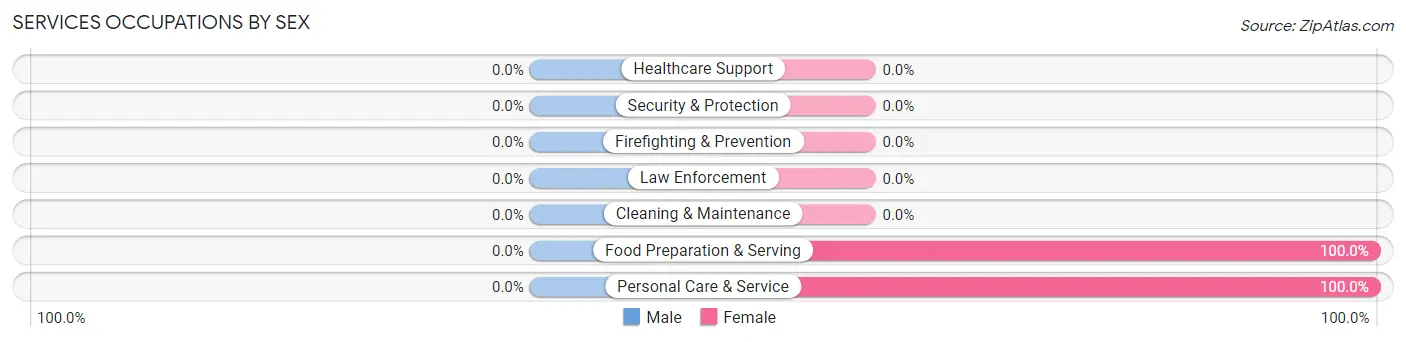
Services Occupations by Sex
| Occupation | Male | Female |
| Healthcare Support | 0 (0.0%) | 0 (0.0%) |
| Security & Protection | 0 (0.0%) | 0 (0.0%) |
| Firefighting & Prevention | 0 (0.0%) | 0 (0.0%) |
| Law Enforcement | 0 (0.0%) | 0 (0.0%) |
| Food Preparation & Serving | 0 (0.0%) | 7 (100.0%) |
| Cleaning & Maintenance | 0 (0.0%) | 0 (0.0%) |
| Personal Care & Service | 0 (0.0%) | 3 (100.0%) |
| Total (Category) | 0 (0.0%) | 10 (100.0%) |
| Total (Overall) | 60 (56.6%) | 46 (43.4%) |
Sales and Office Occupations
The most common Sales and Office occupations in Universal are Office & Administration (10 | 9.4%), and Sales & Related (7 | 6.6%).
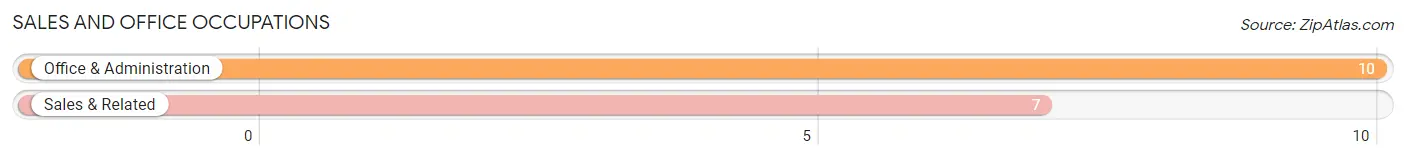
Sales and Office Occupations by Sex

| Occupation | Male | Female |
| Sales & Related | 0 (0.0%) | 7 (100.0%) |
| Office & Administration | 5 (50.0%) | 5 (50.0%) |
| Total (Category) | 5 (29.4%) | 12 (70.6%) |
| Total (Overall) | 60 (56.6%) | 46 (43.4%) |
Natural Resources, Construction and Maintenance Occupations
The most common Natural Resources, Construction and Maintenance occupations in Universal are Construction & Extraction (7 | 6.6%), and Installation, Maintenance & Repair (7 | 6.6%).
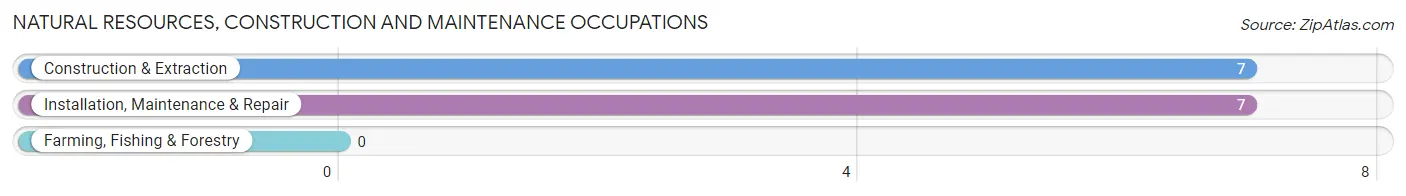
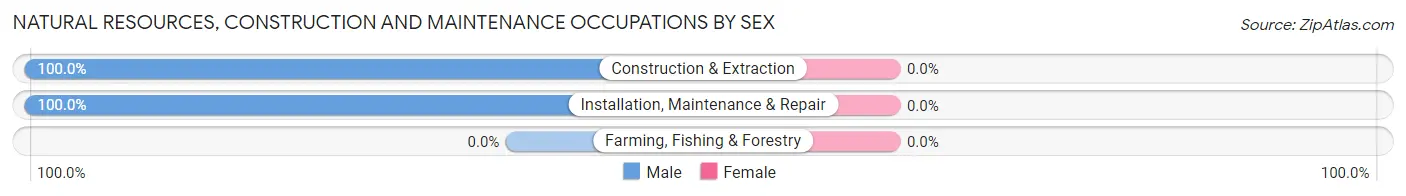
Natural Resources, Construction and Maintenance Occupations by Sex
| Occupation | Male | Female |
| Farming, Fishing & Forestry | 0 (0.0%) | 0 (0.0%) |
| Construction & Extraction | 7 (100.0%) | 0 (0.0%) |
| Installation, Maintenance & Repair | 7 (100.0%) | 0 (0.0%) |
| Total (Category) | 14 (100.0%) | 0 (0.0%) |
| Total (Overall) | 60 (56.6%) | 46 (43.4%) |
Production, Transportation and Moving Occupations
The most common Production, Transportation and Moving occupations in Universal are Production (14 | 13.2%), Material Moving (10 | 9.4%), and Transportation (7 | 6.6%).
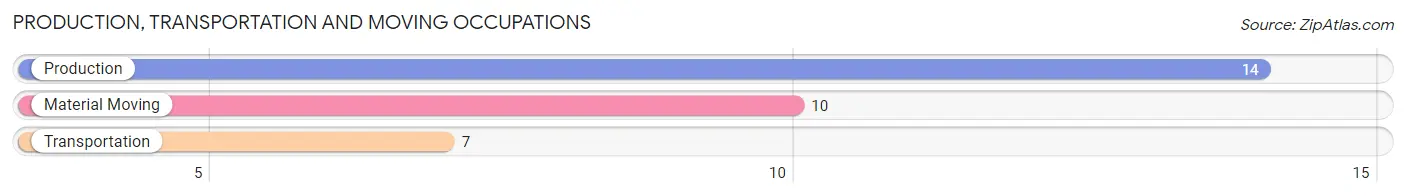
Production, Transportation and Moving Occupations by Sex
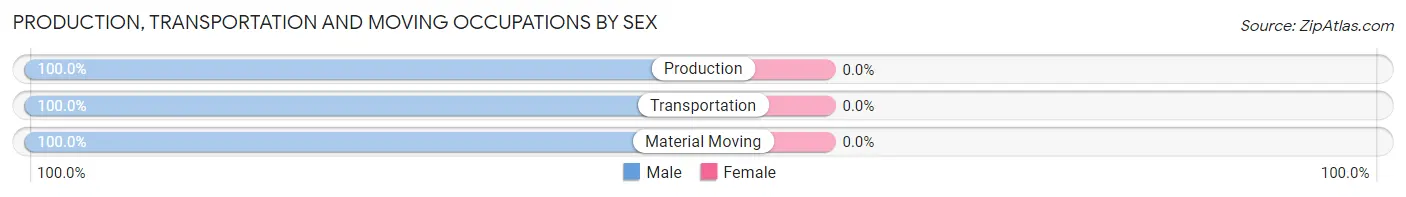
| Occupation | Male | Female |
| Production | 14 (100.0%) | 0 (0.0%) |
| Transportation | 7 (100.0%) | 0 (0.0%) |
| Material Moving | 10 (100.0%) | 0 (0.0%) |
| Total (Category) | 31 (100.0%) | 0 (0.0%) |
| Total (Overall) | 60 (56.6%) | 46 (43.4%) |
Employment Industries by Sex in Universal
Employment Industries in Universal
The major employment industries in Universal include Construction (18 | 17.0%), Retail Trade (17 | 16.0%), Health Care & Social Assistance (16 | 15.1%), Manufacturing (15 | 14.1%), and Administrative & Support (10 | 9.4%).
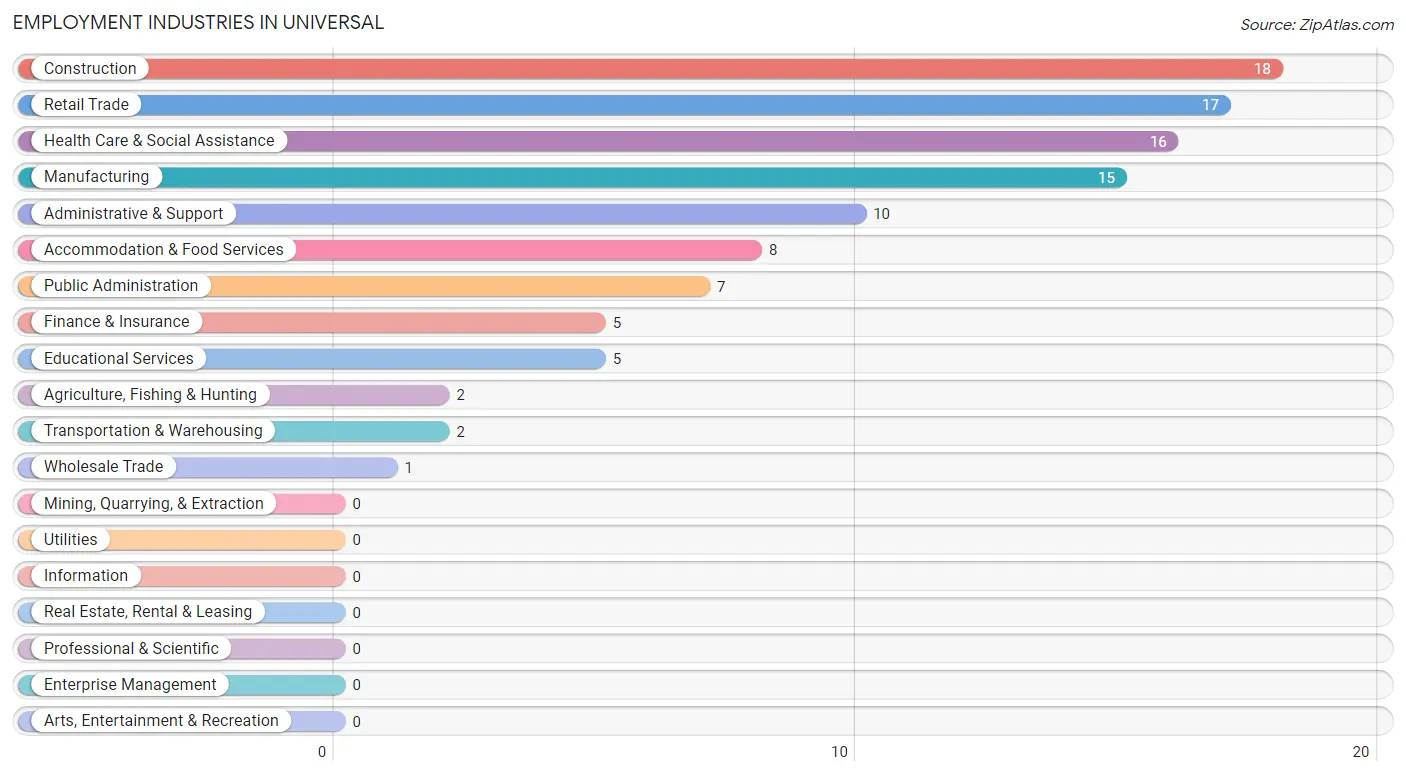
Employment Industries by Sex in Universal
The Universal industries that see more men than women are Agriculture, Fishing & Hunting (100.0%), Construction (100.0%), and Manufacturing (100.0%), whereas the industries that tend to have a higher number of women are Transportation & Warehousing (100.0%), Finance & Insurance (100.0%), and Accommodation & Food Services (100.0%).
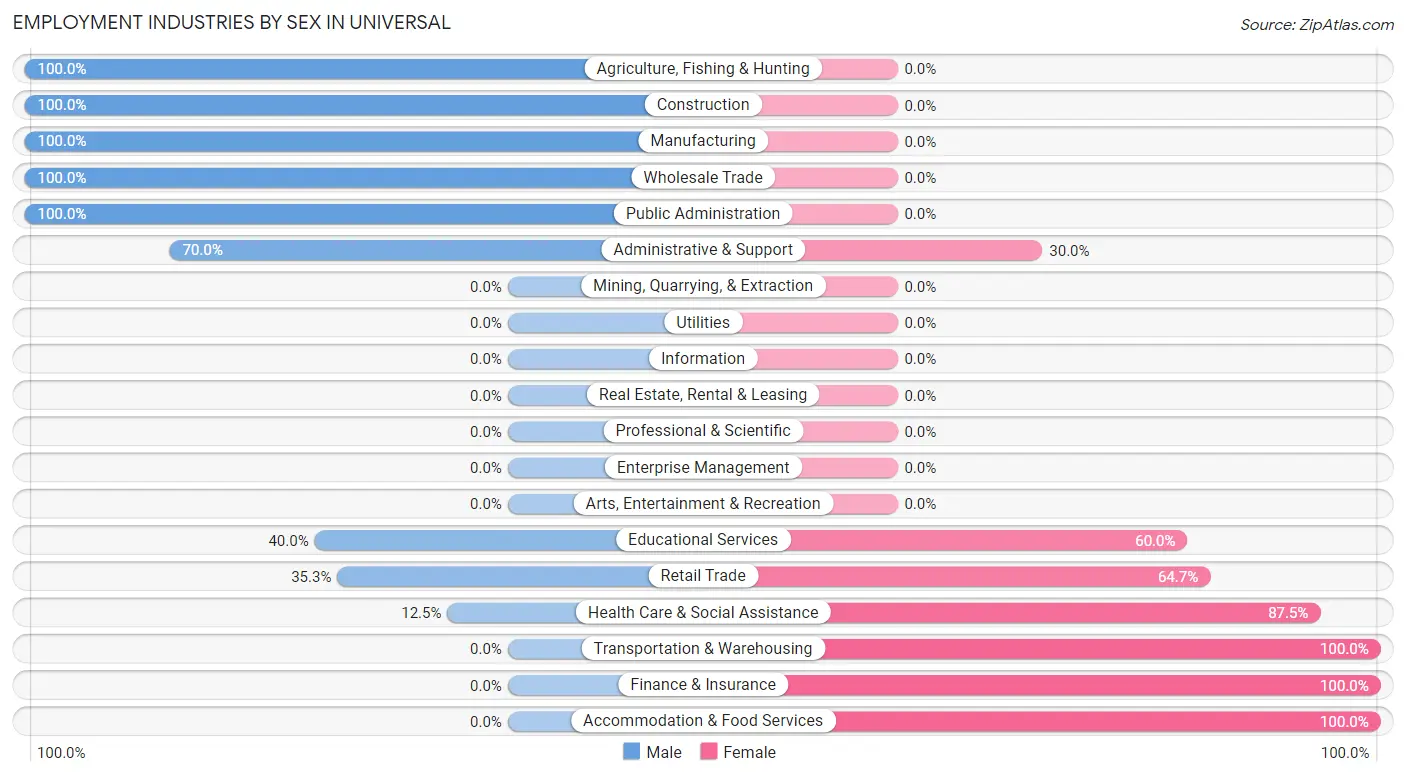
| Industry | Male | Female |
| Agriculture, Fishing & Hunting | 2 (100.0%) | 0 (0.0%) |
| Mining, Quarrying, & Extraction | 0 (0.0%) | 0 (0.0%) |
| Construction | 18 (100.0%) | 0 (0.0%) |
| Manufacturing | 15 (100.0%) | 0 (0.0%) |
| Wholesale Trade | 1 (100.0%) | 0 (0.0%) |
| Retail Trade | 6 (35.3%) | 11 (64.7%) |
| Transportation & Warehousing | 0 (0.0%) | 2 (100.0%) |
| Utilities | 0 (0.0%) | 0 (0.0%) |
| Information | 0 (0.0%) | 0 (0.0%) |
| Finance & Insurance | 0 (0.0%) | 5 (100.0%) |
| Real Estate, Rental & Leasing | 0 (0.0%) | 0 (0.0%) |
| Professional & Scientific | 0 (0.0%) | 0 (0.0%) |
| Enterprise Management | 0 (0.0%) | 0 (0.0%) |
| Administrative & Support | 7 (70.0%) | 3 (30.0%) |
| Educational Services | 2 (40.0%) | 3 (60.0%) |
| Health Care & Social Assistance | 2 (12.5%) | 14 (87.5%) |
| Arts, Entertainment & Recreation | 0 (0.0%) | 0 (0.0%) |
| Accommodation & Food Services | 0 (0.0%) | 8 (100.0%) |
| Public Administration | 7 (100.0%) | 0 (0.0%) |
| Total | 60 (56.6%) | 46 (43.4%) |
Education in Universal
School Enrollment in Universal
The most common levels of schooling among the 76 students in Universal are high school (30 | 39.5%), elementary school (17 | 22.4%), and college / undergraduate (14 | 18.4%).
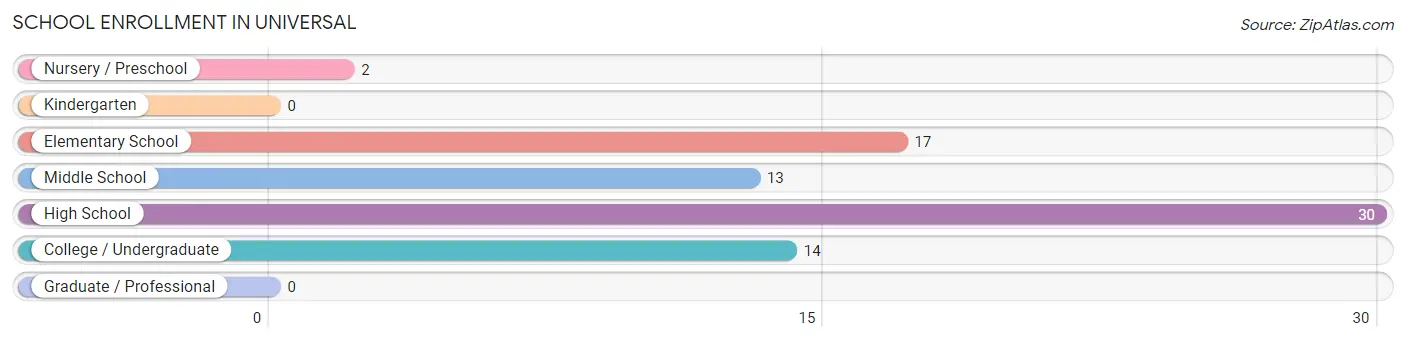
| School Level | # Students | % Students |
| Nursery / Preschool | 2 | 2.6% |
| Kindergarten | 0 | 0.0% |
| Elementary School | 17 | 22.4% |
| Middle School | 13 | 17.1% |
| High School | 30 | 39.5% |
| College / Undergraduate | 14 | 18.4% |
| Graduate / Professional | 0 | 0.0% |
| Total | 76 | 100.0% |
School Enrollment by Age by Funding Source in Universal
Out of a total of 76 students who are enrolled in schools in Universal, 11 (14.5%) attend a private institution, while the remaining 65 (85.5%) are enrolled in public schools. The age group of 10 to 14 year olds has the highest likelihood of being enrolled in private schools, with 10 (43.5% in the age bracket) enrolled. Conversely, the age group of 15 to 17 year olds has the lowest likelihood of being enrolled in a private school, with 1 (100.0% in the age bracket) attending a public institution.
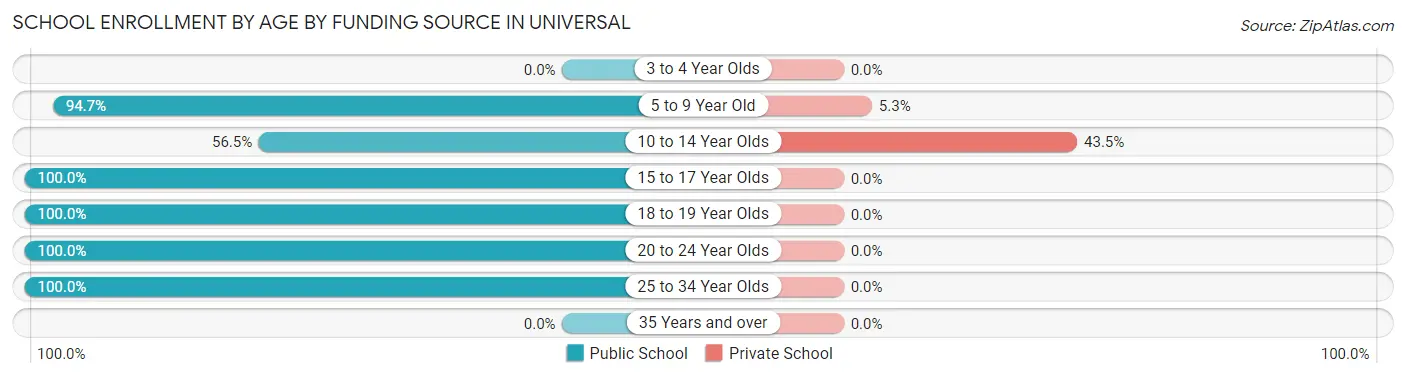
| Age Bracket | Public School | Private School |
| 3 to 4 Year Olds | 0 (0.0%) | 0 (0.0%) |
| 5 to 9 Year Old | 18 (94.7%) | 1 (5.3%) |
| 10 to 14 Year Olds | 13 (56.5%) | 10 (43.5%) |
| 15 to 17 Year Olds | 1 (100.0%) | 0 (0.0%) |
| 18 to 19 Year Olds | 19 (100.0%) | 0 (0.0%) |
| 20 to 24 Year Olds | 5 (100.0%) | 0 (0.0%) |
| 25 to 34 Year Olds | 9 (100.0%) | 0 (0.0%) |
| 35 Years and over | 0 (0.0%) | 0 (0.0%) |
| Total | 65 (85.5%) | 11 (14.5%) |
Educational Attainment by Field of Study in Universal
Education (18 | 56.2%), science & technology (7 | 21.9%), psychology (4 | 12.5%), literature & languages (2 | 6.2%), and computers & mathematics (1 | 3.1%) are the most common fields of study among 32 individuals in Universal who have obtained a bachelor's degree or higher.
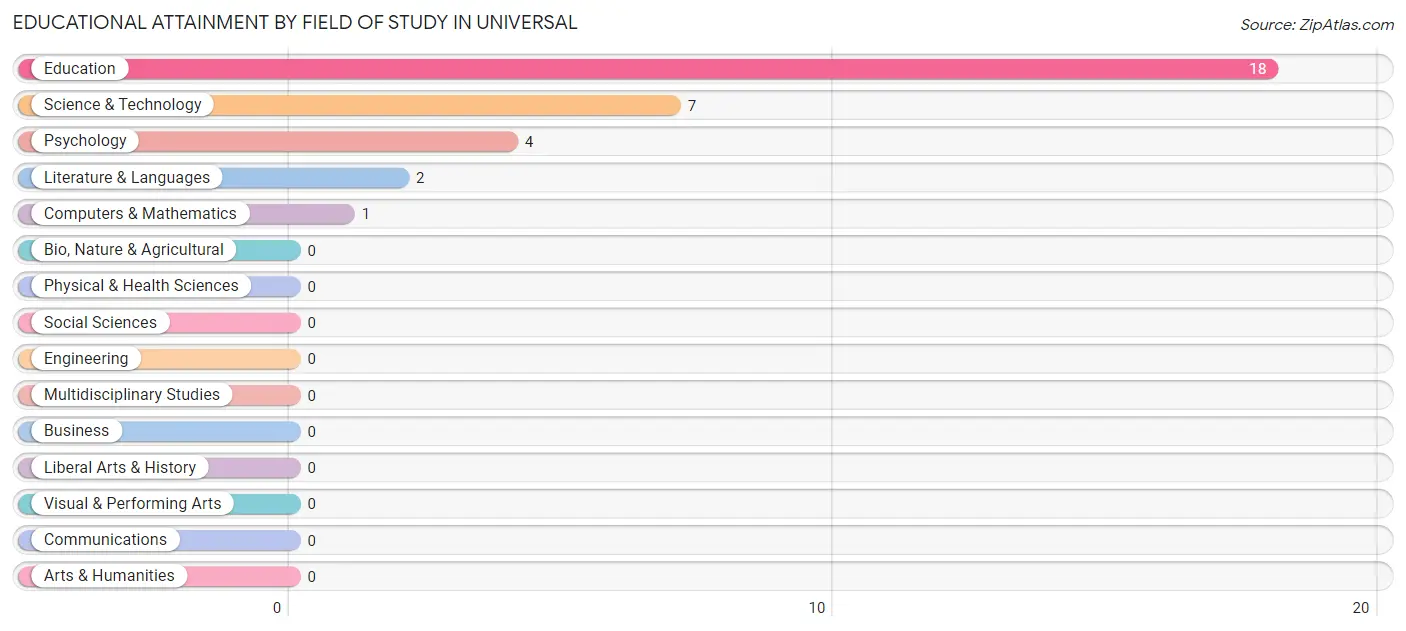
| Field of Study | # Graduates | % Graduates |
| Computers & Mathematics | 1 | 3.1% |
| Bio, Nature & Agricultural | 0 | 0.0% |
| Physical & Health Sciences | 0 | 0.0% |
| Psychology | 4 | 12.5% |
| Social Sciences | 0 | 0.0% |
| Engineering | 0 | 0.0% |
| Multidisciplinary Studies | 0 | 0.0% |
| Science & Technology | 7 | 21.9% |
| Business | 0 | 0.0% |
| Education | 18 | 56.2% |
| Literature & Languages | 2 | 6.2% |
| Liberal Arts & History | 0 | 0.0% |
| Visual & Performing Arts | 0 | 0.0% |
| Communications | 0 | 0.0% |
| Arts & Humanities | 0 | 0.0% |
| Total | 32 | 100.0% |
Transportation & Commute in Universal
Vehicle Availability by Sex in Universal
The most prevalent vehicle ownership categories in Universal are males with 2 vehicles (40, accounting for 66.7%) and females with 2 vehicles (27, making up 87.0%).
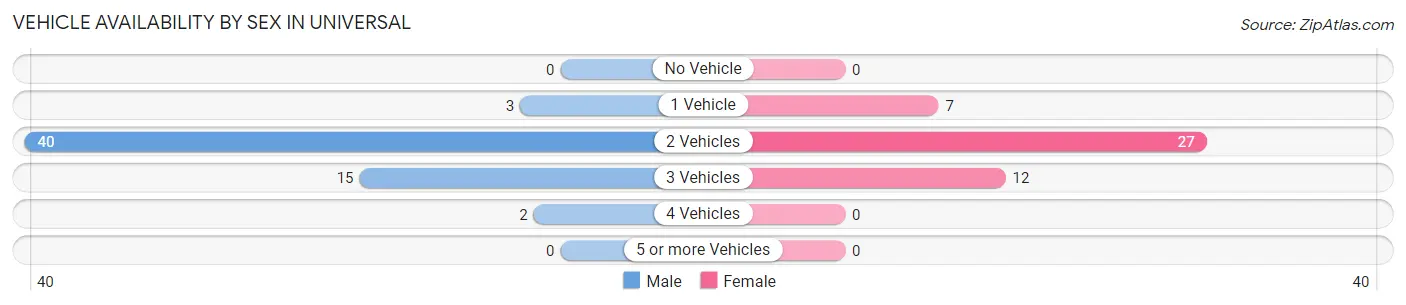
| Vehicles Available | Male | Female |
| No Vehicle | 0 (0.0%) | 0 (0.0%) |
| 1 Vehicle | 3 (5.0%) | 7 (15.2%) |
| 2 Vehicles | 40 (66.7%) | 27 (58.7%) |
| 3 Vehicles | 15 (25.0%) | 12 (26.1%) |
| 4 Vehicles | 2 (3.3%) | 0 (0.0%) |
| 5 or more Vehicles | 0 (0.0%) | 0 (0.0%) |
| Total | 60 (100.0%) | 46 (100.0%) |
Commute Time in Universal
The most frequently occuring commute durations in Universal are 10 to 14 minutes (29 commuters, 30.5%), 20 to 24 minutes (12 commuters, 12.6%), and 25 to 29 minutes (9 commuters, 9.5%).
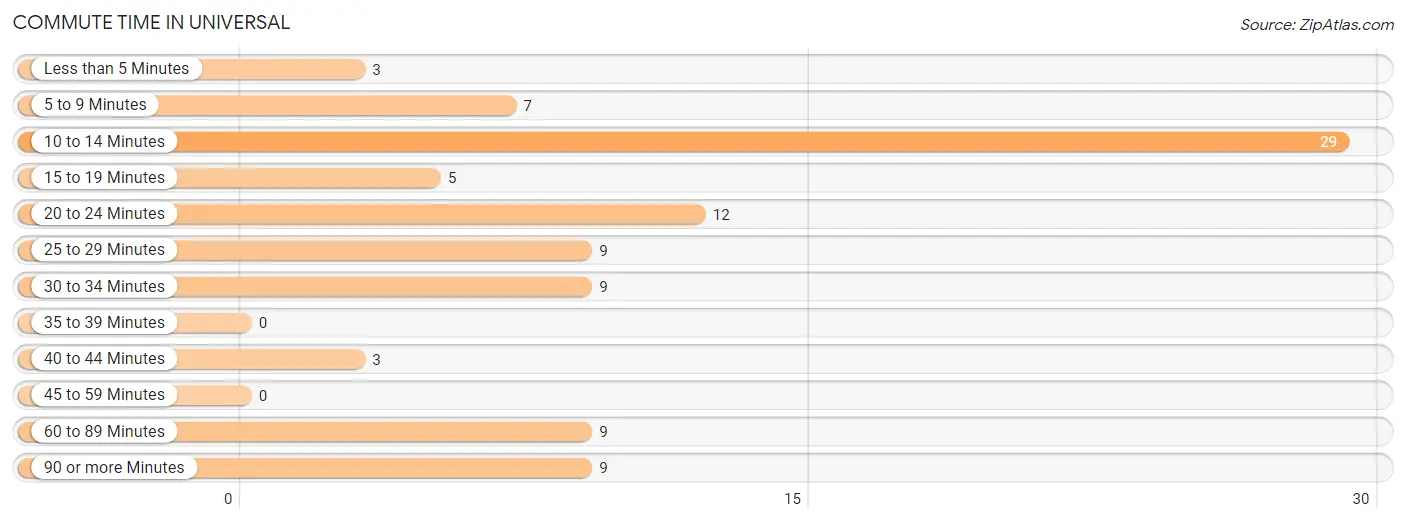
| Commute Time | # Commuters | % Commuters |
| Less than 5 Minutes | 3 | 3.2% |
| 5 to 9 Minutes | 7 | 7.4% |
| 10 to 14 Minutes | 29 | 30.5% |
| 15 to 19 Minutes | 5 | 5.3% |
| 20 to 24 Minutes | 12 | 12.6% |
| 25 to 29 Minutes | 9 | 9.5% |
| 30 to 34 Minutes | 9 | 9.5% |
| 35 to 39 Minutes | 0 | 0.0% |
| 40 to 44 Minutes | 3 | 3.2% |
| 45 to 59 Minutes | 0 | 0.0% |
| 60 to 89 Minutes | 9 | 9.5% |
| 90 or more Minutes | 9 | 9.5% |
Commute Time by Sex in Universal
The most common commute times in Universal are 10 to 14 minutes (17 commuters, 29.3%) for males and 10 to 14 minutes (12 commuters, 32.4%) for females.
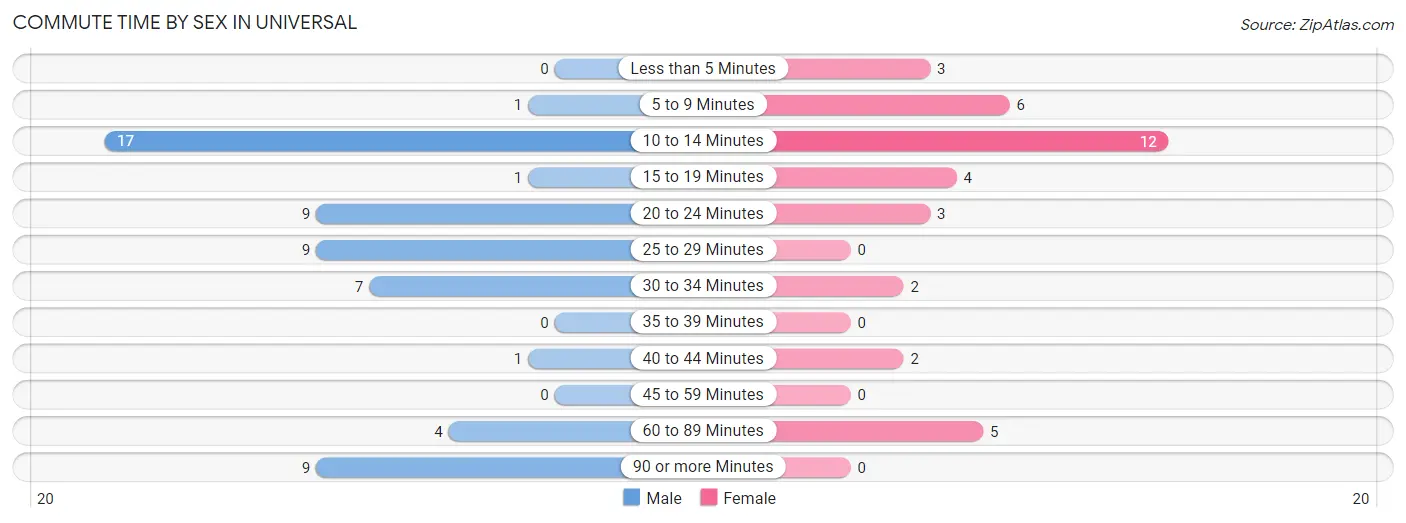
| Commute Time | Male | Female |
| Less than 5 Minutes | 0 (0.0%) | 3 (8.1%) |
| 5 to 9 Minutes | 1 (1.7%) | 6 (16.2%) |
| 10 to 14 Minutes | 17 (29.3%) | 12 (32.4%) |
| 15 to 19 Minutes | 1 (1.7%) | 4 (10.8%) |
| 20 to 24 Minutes | 9 (15.5%) | 3 (8.1%) |
| 25 to 29 Minutes | 9 (15.5%) | 0 (0.0%) |
| 30 to 34 Minutes | 7 (12.1%) | 2 (5.4%) |
| 35 to 39 Minutes | 0 (0.0%) | 0 (0.0%) |
| 40 to 44 Minutes | 1 (1.7%) | 2 (5.4%) |
| 45 to 59 Minutes | 0 (0.0%) | 0 (0.0%) |
| 60 to 89 Minutes | 4 (6.9%) | 5 (13.5%) |
| 90 or more Minutes | 9 (15.5%) | 0 (0.0%) |
Time of Departure to Work by Sex in Universal
The most frequent times of departure to work in Universal are 7:30 AM to 7:59 AM (17, 29.3%) for males and 6:30 AM to 6:59 AM (8, 21.6%) for females.
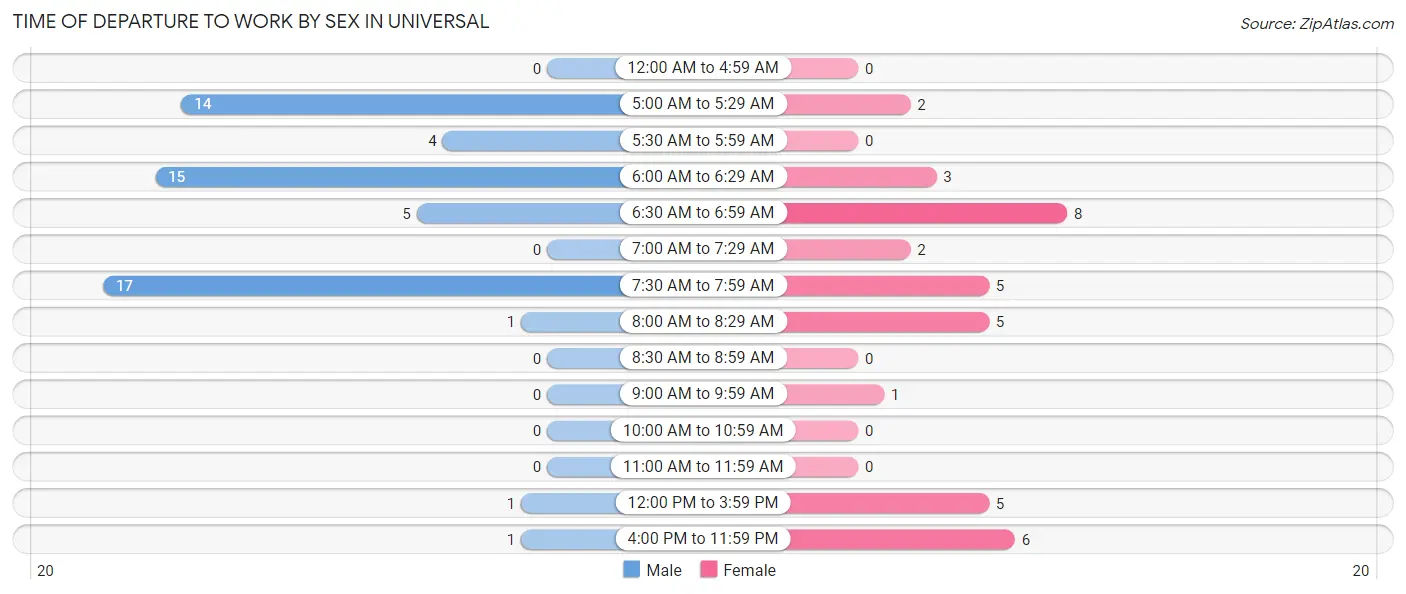
| Time of Departure | Male | Female |
| 12:00 AM to 4:59 AM | 0 (0.0%) | 0 (0.0%) |
| 5:00 AM to 5:29 AM | 14 (24.1%) | 2 (5.4%) |
| 5:30 AM to 5:59 AM | 4 (6.9%) | 0 (0.0%) |
| 6:00 AM to 6:29 AM | 15 (25.9%) | 3 (8.1%) |
| 6:30 AM to 6:59 AM | 5 (8.6%) | 8 (21.6%) |
| 7:00 AM to 7:29 AM | 0 (0.0%) | 2 (5.4%) |
| 7:30 AM to 7:59 AM | 17 (29.3%) | 5 (13.5%) |
| 8:00 AM to 8:29 AM | 1 (1.7%) | 5 (13.5%) |
| 8:30 AM to 8:59 AM | 0 (0.0%) | 0 (0.0%) |
| 9:00 AM to 9:59 AM | 0 (0.0%) | 1 (2.7%) |
| 10:00 AM to 10:59 AM | 0 (0.0%) | 0 (0.0%) |
| 11:00 AM to 11:59 AM | 0 (0.0%) | 0 (0.0%) |
| 12:00 PM to 3:59 PM | 1 (1.7%) | 5 (13.5%) |
| 4:00 PM to 11:59 PM | 1 (1.7%) | 6 (16.2%) |
| Total | 58 (100.0%) | 37 (100.0%) |
Housing Occupancy in Universal
Occupancy by Ownership in Universal
Of the total 118 dwellings in Universal, owner-occupied units account for 113 (95.8%), while renter-occupied units make up 5 (4.2%).
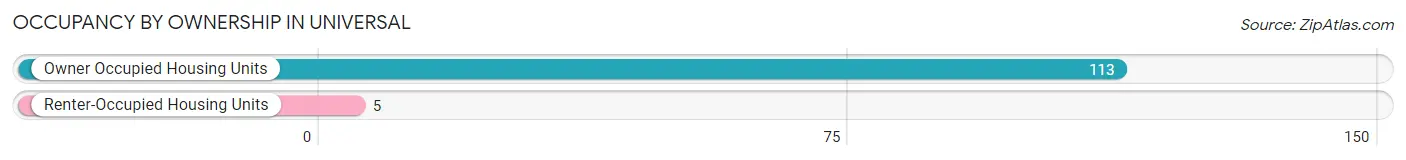
| Occupancy | # Housing Units | % Housing Units |
| Owner Occupied Housing Units | 113 | 95.8% |
| Renter-Occupied Housing Units | 5 | 4.2% |
| Total Occupied Housing Units | 118 | 100.0% |
Occupancy by Household Size in Universal
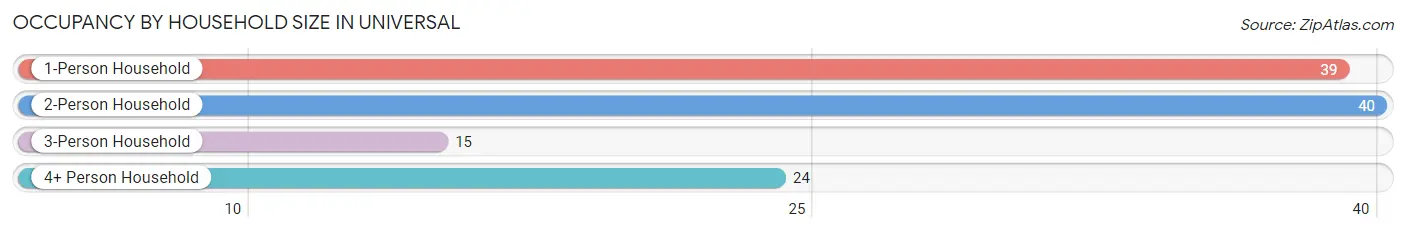
| Household Size | # Housing Units | % Housing Units |
| 1-Person Household | 39 | 33.1% |
| 2-Person Household | 40 | 33.9% |
| 3-Person Household | 15 | 12.7% |
| 4+ Person Household | 24 | 20.3% |
| Total Housing Units | 118 | 100.0% |
Occupancy by Ownership by Household Size in Universal
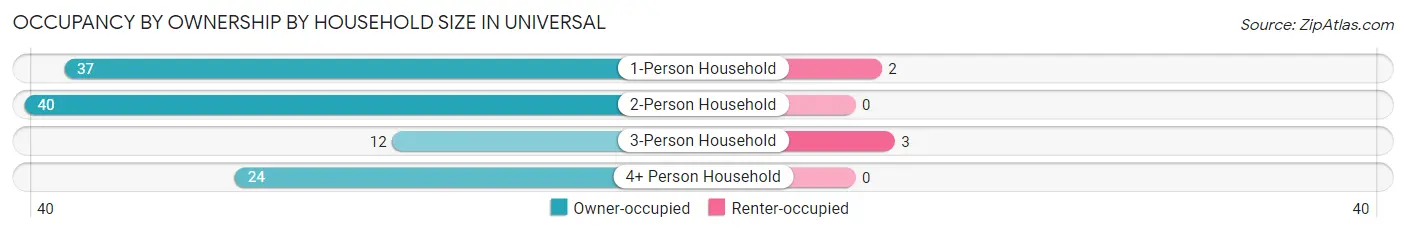
| Household Size | Owner-occupied | Renter-occupied |
| 1-Person Household | 37 (94.9%) | 2 (5.1%) |
| 2-Person Household | 40 (100.0%) | 0 (0.0%) |
| 3-Person Household | 12 (80.0%) | 3 (20.0%) |
| 4+ Person Household | 24 (100.0%) | 0 (0.0%) |
| Total Housing Units | 113 (95.8%) | 5 (4.2%) |
Occupancy by Educational Attainment in Universal
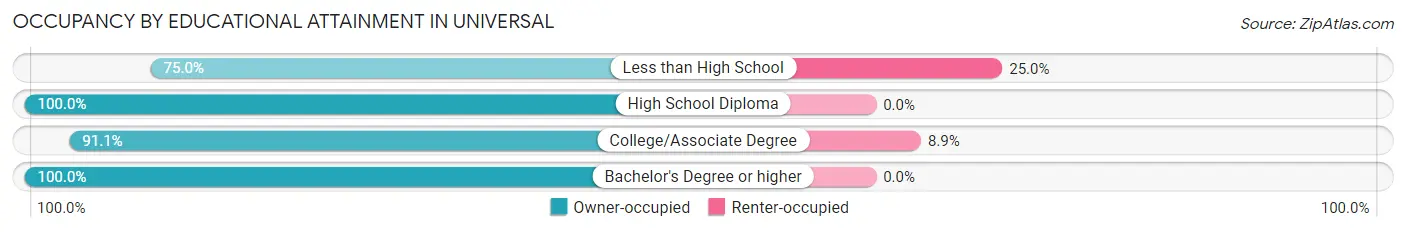
| Household Size | Owner-occupied | Renter-occupied |
| Less than High School | 3 (75.0%) | 1 (25.0%) |
| High School Diploma | 42 (100.0%) | 0 (0.0%) |
| College/Associate Degree | 41 (91.1%) | 4 (8.9%) |
| Bachelor's Degree or higher | 27 (100.0%) | 0 (0.0%) |
Occupancy by Age of Householder in Universal
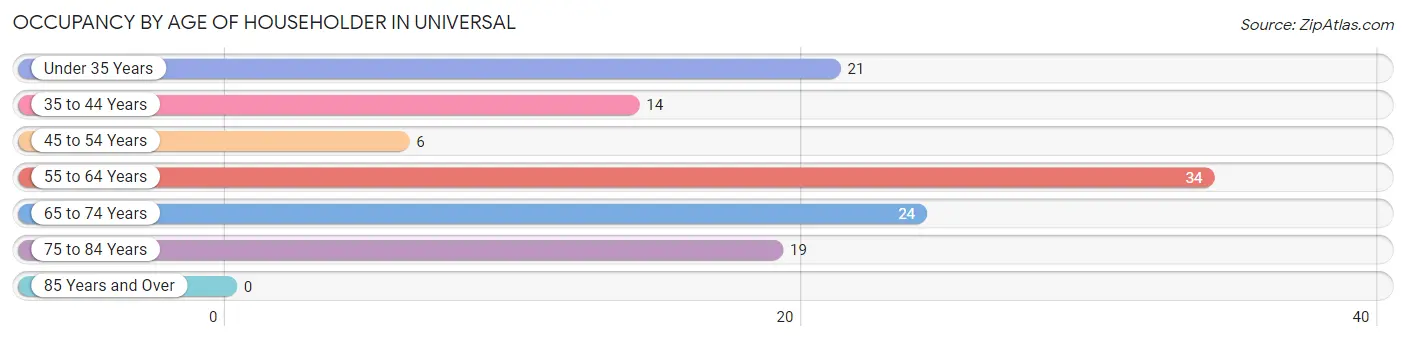
| Age Bracket | # Households | % Households |
| Under 35 Years | 21 | 17.8% |
| 35 to 44 Years | 14 | 11.9% |
| 45 to 54 Years | 6 | 5.1% |
| 55 to 64 Years | 34 | 28.8% |
| 65 to 74 Years | 24 | 20.3% |
| 75 to 84 Years | 19 | 16.1% |
| 85 Years and Over | 0 | 0.0% |
| Total | 118 | 100.0% |
Housing Finances in Universal
Median Income by Occupancy in Universal
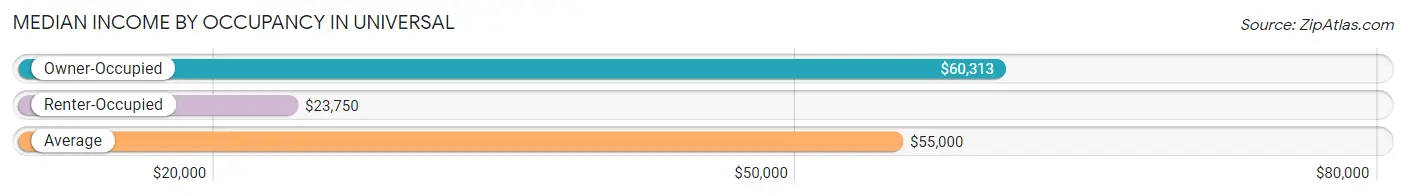
| Occupancy Type | # Households | Median Income |
| Owner-Occupied | 113 (95.8%) | $60,313 |
| Renter-Occupied | 5 (4.2%) | $23,750 |
| Average | 118 (100.0%) | $55,000 |
Occupancy by Householder Income Bracket in Universal
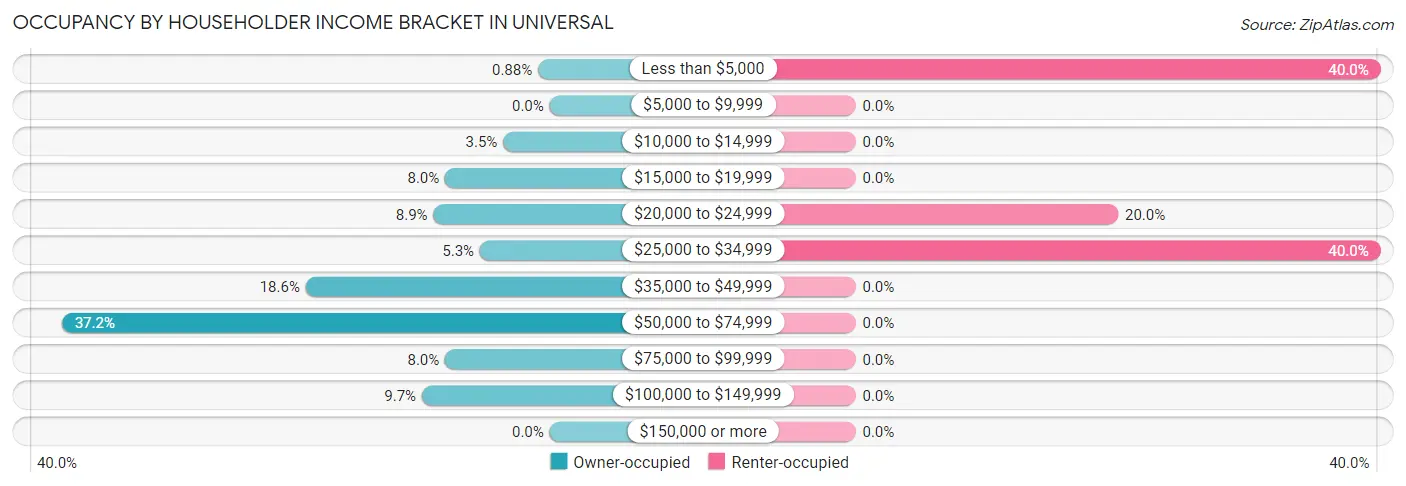
| Income Bracket | Owner-occupied | Renter-occupied |
| Less than $5,000 | 1 (0.9%) | 2 (40.0%) |
| $5,000 to $9,999 | 0 (0.0%) | 0 (0.0%) |
| $10,000 to $14,999 | 4 (3.5%) | 0 (0.0%) |
| $15,000 to $19,999 | 9 (8.0%) | 0 (0.0%) |
| $20,000 to $24,999 | 10 (8.8%) | 1 (20.0%) |
| $25,000 to $34,999 | 6 (5.3%) | 2 (40.0%) |
| $35,000 to $49,999 | 21 (18.6%) | 0 (0.0%) |
| $50,000 to $74,999 | 42 (37.2%) | 0 (0.0%) |
| $75,000 to $99,999 | 9 (8.0%) | 0 (0.0%) |
| $100,000 to $149,999 | 11 (9.7%) | 0 (0.0%) |
| $150,000 or more | 0 (0.0%) | 0 (0.0%) |
| Total | 113 (100.0%) | 5 (100.0%) |
Monthly Housing Cost Tiers in Universal
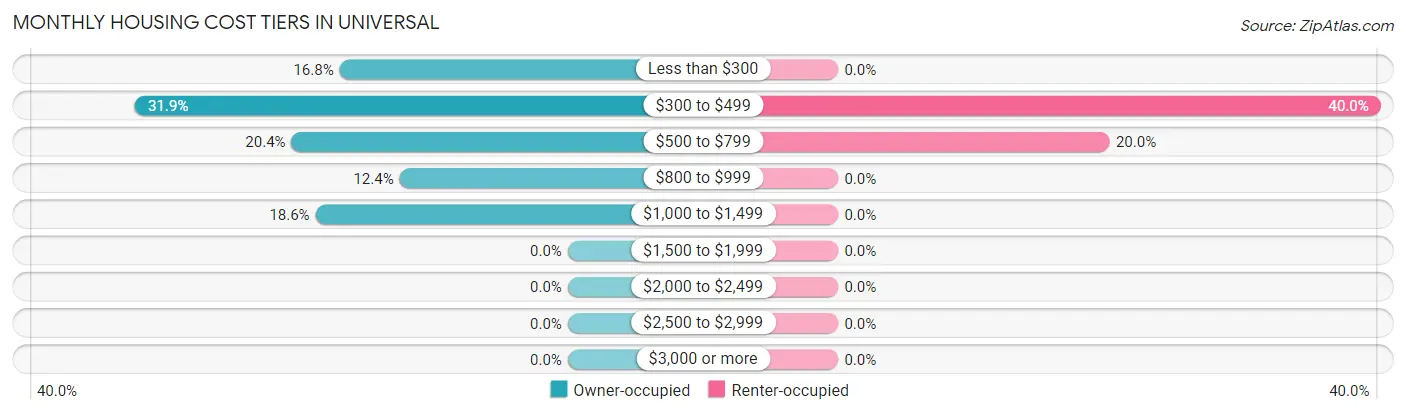
| Monthly Cost | Owner-occupied | Renter-occupied |
| Less than $300 | 19 (16.8%) | 0 (0.0%) |
| $300 to $499 | 36 (31.9%) | 2 (40.0%) |
| $500 to $799 | 23 (20.3%) | 1 (20.0%) |
| $800 to $999 | 14 (12.4%) | 0 (0.0%) |
| $1,000 to $1,499 | 21 (18.6%) | 0 (0.0%) |
| $1,500 to $1,999 | 0 (0.0%) | 0 (0.0%) |
| $2,000 to $2,499 | 0 (0.0%) | 0 (0.0%) |
| $2,500 to $2,999 | 0 (0.0%) | 0 (0.0%) |
| $3,000 or more | 0 (0.0%) | 0 (0.0%) |
| Total | 113 (100.0%) | 5 (100.0%) |
Physical Housing Characteristics in Universal
Housing Structures in Universal
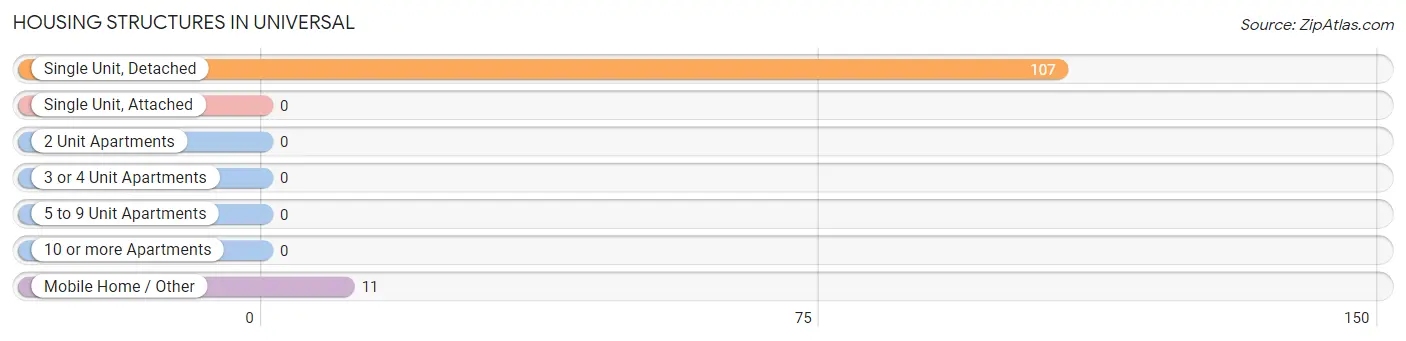
| Structure Type | # Housing Units | % Housing Units |
| Single Unit, Detached | 107 | 90.7% |
| Single Unit, Attached | 0 | 0.0% |
| 2 Unit Apartments | 0 | 0.0% |
| 3 or 4 Unit Apartments | 0 | 0.0% |
| 5 to 9 Unit Apartments | 0 | 0.0% |
| 10 or more Apartments | 0 | 0.0% |
| Mobile Home / Other | 11 | 9.3% |
| Total | 118 | 100.0% |
Housing Structures by Occupancy in Universal
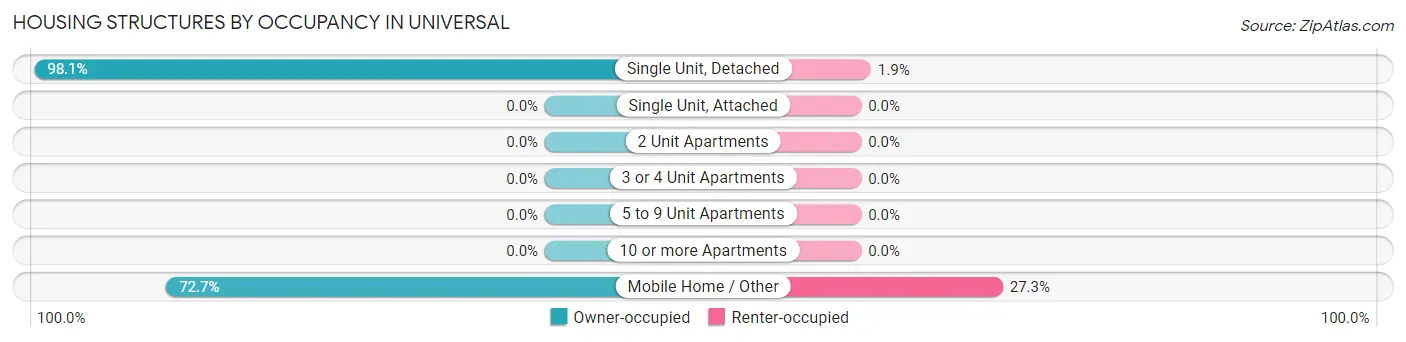
| Structure Type | Owner-occupied | Renter-occupied |
| Single Unit, Detached | 105 (98.1%) | 2 (1.9%) |
| Single Unit, Attached | 0 (0.0%) | 0 (0.0%) |
| 2 Unit Apartments | 0 (0.0%) | 0 (0.0%) |
| 3 or 4 Unit Apartments | 0 (0.0%) | 0 (0.0%) |
| 5 to 9 Unit Apartments | 0 (0.0%) | 0 (0.0%) |
| 10 or more Apartments | 0 (0.0%) | 0 (0.0%) |
| Mobile Home / Other | 8 (72.7%) | 3 (27.3%) |
| Total | 113 (95.8%) | 5 (4.2%) |
Housing Structures by Number of Rooms in Universal
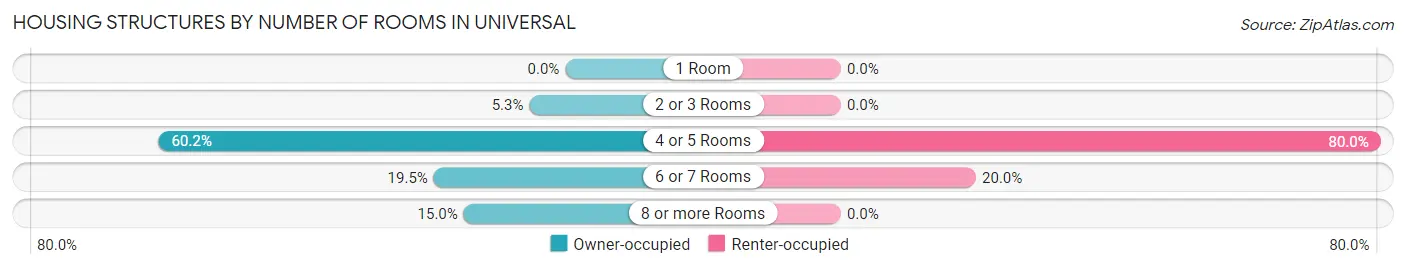
| Number of Rooms | Owner-occupied | Renter-occupied |
| 1 Room | 0 (0.0%) | 0 (0.0%) |
| 2 or 3 Rooms | 6 (5.3%) | 0 (0.0%) |
| 4 or 5 Rooms | 68 (60.2%) | 4 (80.0%) |
| 6 or 7 Rooms | 22 (19.5%) | 1 (20.0%) |
| 8 or more Rooms | 17 (15.0%) | 0 (0.0%) |
| Total | 113 (100.0%) | 5 (100.0%) |
Housing Structure by Heating Type in Universal
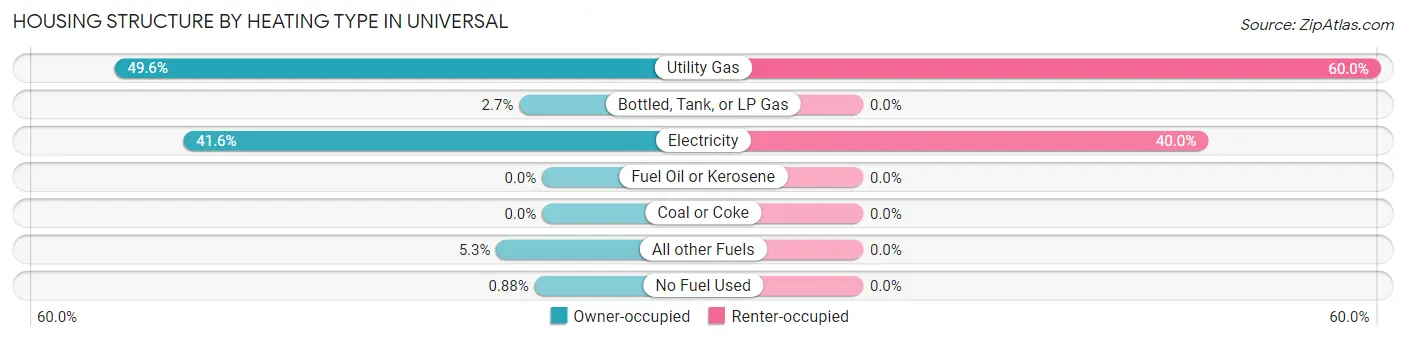
| Heating Type | Owner-occupied | Renter-occupied |
| Utility Gas | 56 (49.6%) | 3 (60.0%) |
| Bottled, Tank, or LP Gas | 3 (2.6%) | 0 (0.0%) |
| Electricity | 47 (41.6%) | 2 (40.0%) |
| Fuel Oil or Kerosene | 0 (0.0%) | 0 (0.0%) |
| Coal or Coke | 0 (0.0%) | 0 (0.0%) |
| All other Fuels | 6 (5.3%) | 0 (0.0%) |
| No Fuel Used | 1 (0.9%) | 0 (0.0%) |
| Total | 113 (100.0%) | 5 (100.0%) |
Household Vehicle Usage in Universal
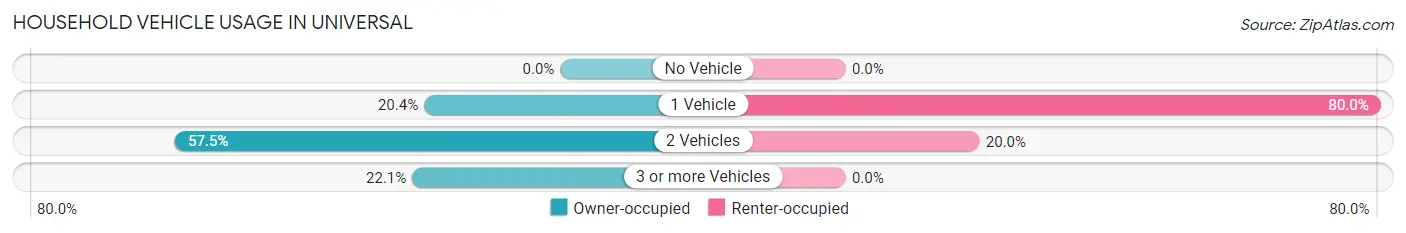
| Vehicles per Household | Owner-occupied | Renter-occupied |
| No Vehicle | 0 (0.0%) | 0 (0.0%) |
| 1 Vehicle | 23 (20.3%) | 4 (80.0%) |
| 2 Vehicles | 65 (57.5%) | 1 (20.0%) |
| 3 or more Vehicles | 25 (22.1%) | 0 (0.0%) |
| Total | 113 (100.0%) | 5 (100.0%) |
Real Estate & Mortgages in Universal
Real Estate and Mortgage Overview in Universal
| Characteristic | Without Mortgage | With Mortgage |
| Housing Units | 58 | 55 |
| Median Property Value | $66,000 | $66,300 |
| Median Household Income | $61,042 | $0 |
| Monthly Housing Costs | $329 | $0 |
| Real Estate Taxes | $575 | $9 |
Property Value by Mortgage Status in Universal
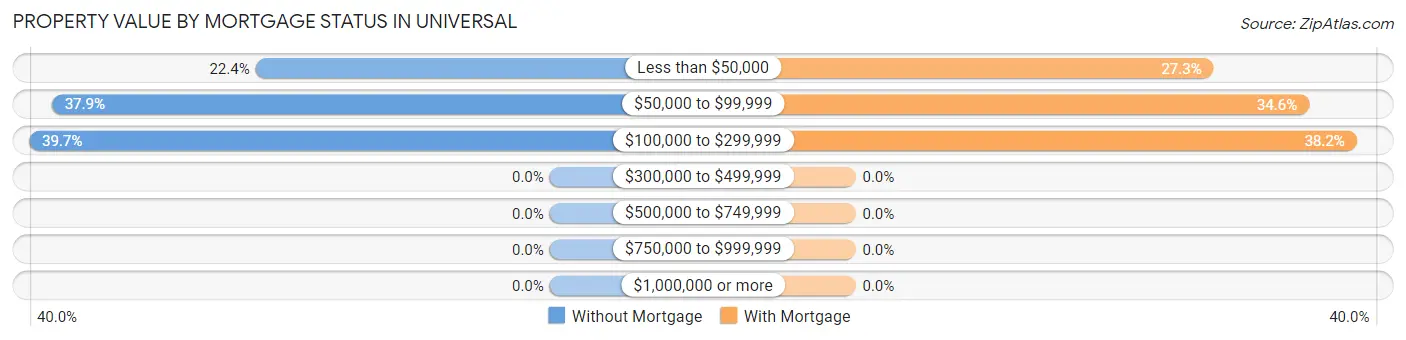
| Property Value | Without Mortgage | With Mortgage |
| Less than $50,000 | 13 (22.4%) | 15 (27.3%) |
| $50,000 to $99,999 | 22 (37.9%) | 19 (34.5%) |
| $100,000 to $299,999 | 23 (39.7%) | 21 (38.2%) |
| $300,000 to $499,999 | 0 (0.0%) | 0 (0.0%) |
| $500,000 to $749,999 | 0 (0.0%) | 0 (0.0%) |
| $750,000 to $999,999 | 0 (0.0%) | 0 (0.0%) |
| $1,000,000 or more | 0 (0.0%) | 0 (0.0%) |
| Total | 58 (100.0%) | 55 (100.0%) |
Household Income by Mortgage Status in Universal
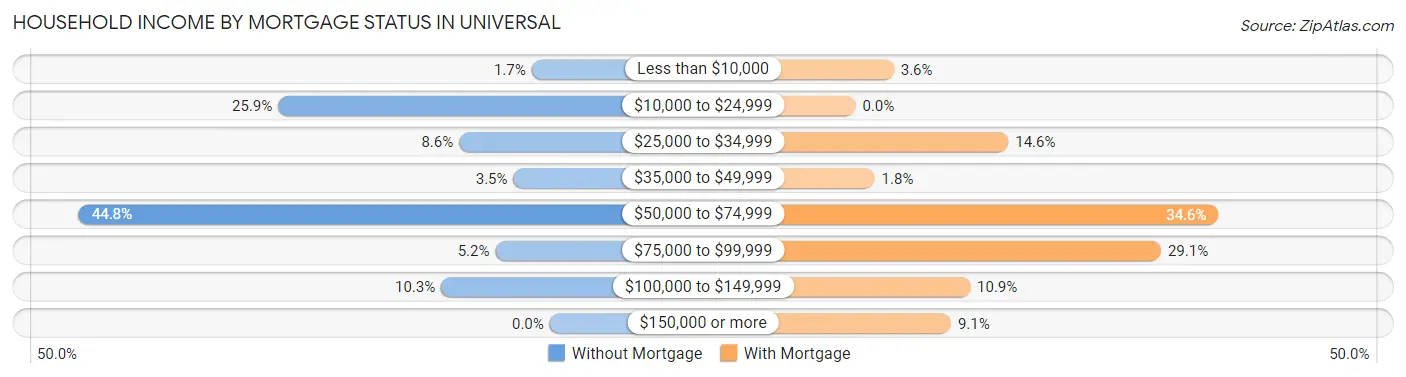
| Household Income | Without Mortgage | With Mortgage |
| Less than $10,000 | 1 (1.7%) | 2 (3.6%) |
| $10,000 to $24,999 | 15 (25.9%) | 0 (0.0%) |
| $25,000 to $34,999 | 5 (8.6%) | 8 (14.5%) |
| $35,000 to $49,999 | 2 (3.5%) | 1 (1.8%) |
| $50,000 to $74,999 | 26 (44.8%) | 19 (34.5%) |
| $75,000 to $99,999 | 3 (5.2%) | 16 (29.1%) |
| $100,000 to $149,999 | 6 (10.3%) | 6 (10.9%) |
| $150,000 or more | 0 (0.0%) | 5 (9.1%) |
| Total | 58 (100.0%) | 55 (100.0%) |
Property Value to Household Income Ratio in Universal
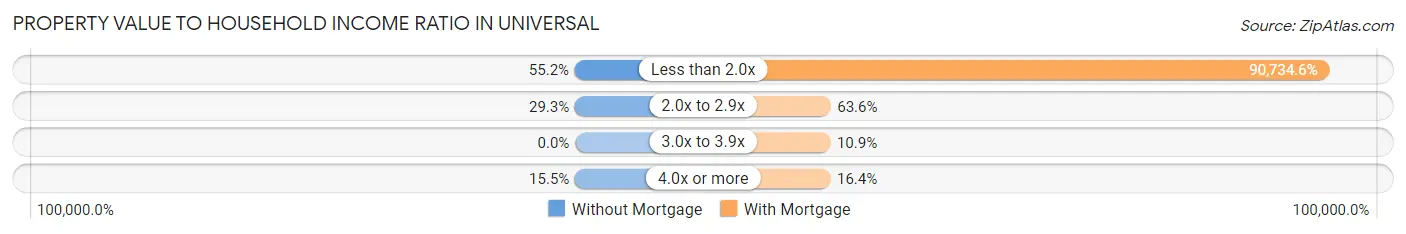
| Value-to-Income Ratio | Without Mortgage | With Mortgage |
| Less than 2.0x | 32 (55.2%) | 49,904 (90,734.6%) |
| 2.0x to 2.9x | 17 (29.3%) | 35 (63.6%) |
| 3.0x to 3.9x | 0 (0.0%) | 6 (10.9%) |
| 4.0x or more | 9 (15.5%) | 9 (16.4%) |
| Total | 58 (100.0%) | 55 (100.0%) |
Real Estate Taxes by Mortgage Status in Universal
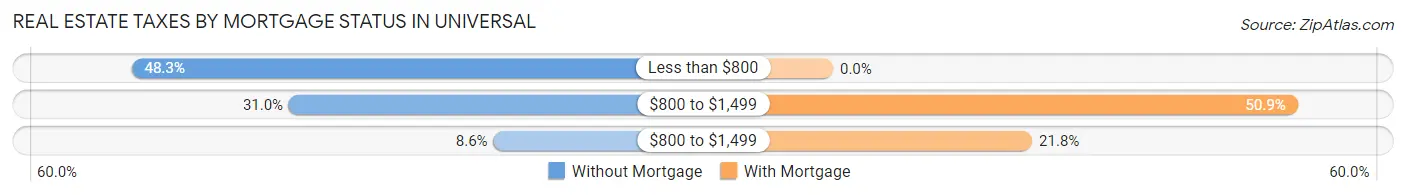
| Property Taxes | Without Mortgage | With Mortgage |
| Less than $800 | 28 (48.3%) | 0 (0.0%) |
| $800 to $1,499 | 18 (31.0%) | 28 (50.9%) |
| $800 to $1,499 | 5 (8.6%) | 12 (21.8%) |
| Total | 58 (100.0%) | 55 (100.0%) |
Health & Disability in Universal
Health Insurance Coverage by Age in Universal
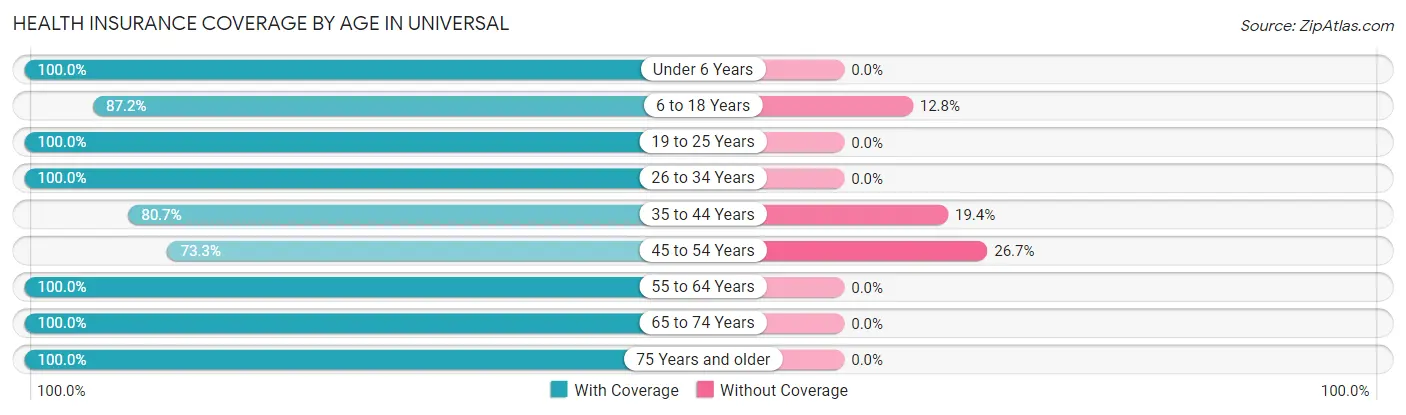
| Age Bracket | With Coverage | Without Coverage |
| Under 6 Years | 11 (100.0%) | 0 (0.0%) |
| 6 to 18 Years | 41 (87.2%) | 6 (12.8%) |
| 19 to 25 Years | 25 (100.0%) | 0 (0.0%) |
| 26 to 34 Years | 24 (100.0%) | 0 (0.0%) |
| 35 to 44 Years | 25 (80.6%) | 6 (19.4%) |
| 45 to 54 Years | 11 (73.3%) | 4 (26.7%) |
| 55 to 64 Years | 45 (100.0%) | 0 (0.0%) |
| 65 to 74 Years | 37 (100.0%) | 0 (0.0%) |
| 75 Years and older | 25 (100.0%) | 0 (0.0%) |
| Total | 244 (93.9%) | 16 (6.1%) |
Health Insurance Coverage by Citizenship Status in Universal
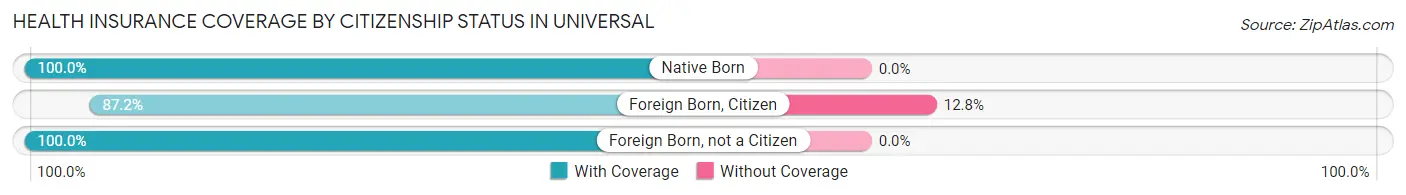
| Citizenship Status | With Coverage | Without Coverage |
| Native Born | 11 (100.0%) | 0 (0.0%) |
| Foreign Born, Citizen | 41 (87.2%) | 6 (12.8%) |
| Foreign Born, not a Citizen | 25 (100.0%) | 0 (0.0%) |
Health Insurance Coverage by Household Income in Universal
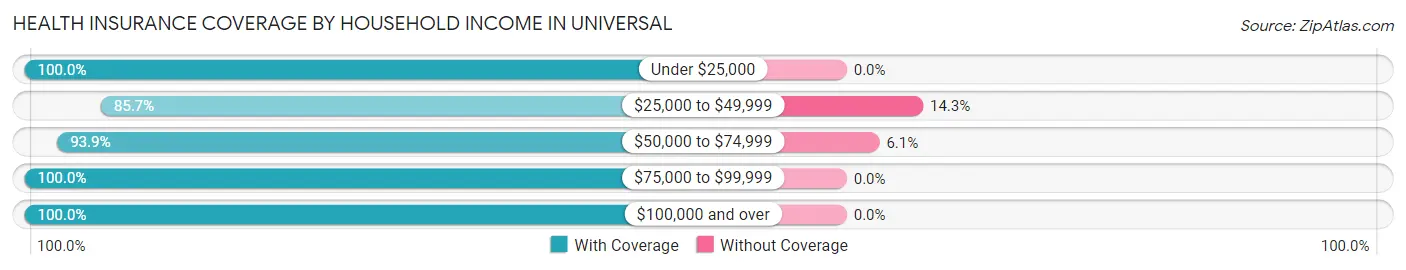
| Household Income | With Coverage | Without Coverage |
| Under $25,000 | 45 (100.0%) | 0 (0.0%) |
| $25,000 to $49,999 | 60 (85.7%) | 10 (14.3%) |
| $50,000 to $74,999 | 92 (93.9%) | 6 (6.1%) |
| $75,000 to $99,999 | 27 (100.0%) | 0 (0.0%) |
| $100,000 and over | 20 (100.0%) | 0 (0.0%) |
Public vs Private Health Insurance Coverage by Age in Universal
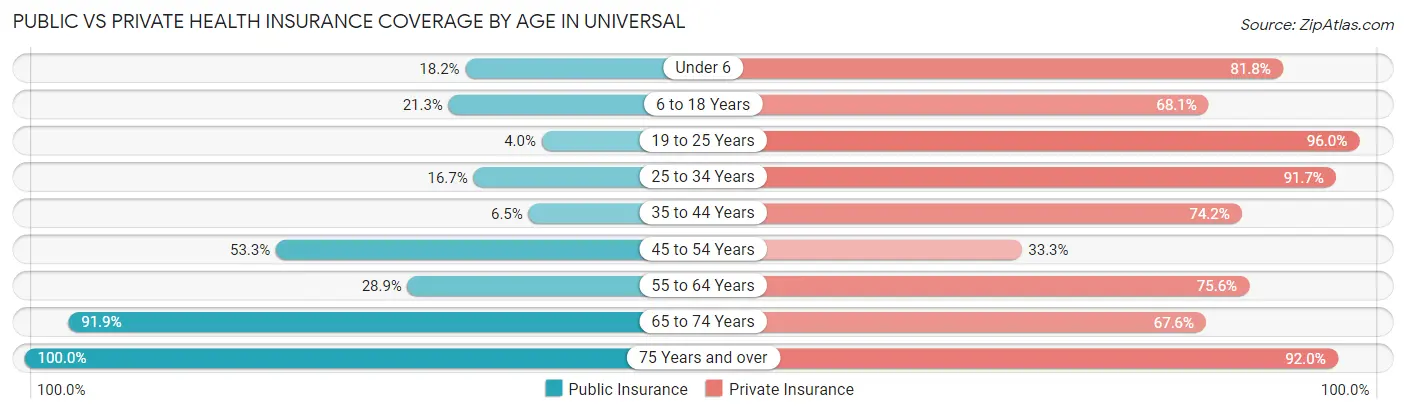
| Age Bracket | Public Insurance | Private Insurance |
| Under 6 | 2 (18.2%) | 9 (81.8%) |
| 6 to 18 Years | 10 (21.3%) | 32 (68.1%) |
| 19 to 25 Years | 1 (4.0%) | 24 (96.0%) |
| 25 to 34 Years | 4 (16.7%) | 22 (91.7%) |
| 35 to 44 Years | 2 (6.5%) | 23 (74.2%) |
| 45 to 54 Years | 8 (53.3%) | 5 (33.3%) |
| 55 to 64 Years | 13 (28.9%) | 34 (75.6%) |
| 65 to 74 Years | 34 (91.9%) | 25 (67.6%) |
| 75 Years and over | 25 (100.0%) | 23 (92.0%) |
| Total | 99 (38.1%) | 197 (75.8%) |
Disability Status by Sex by Age in Universal
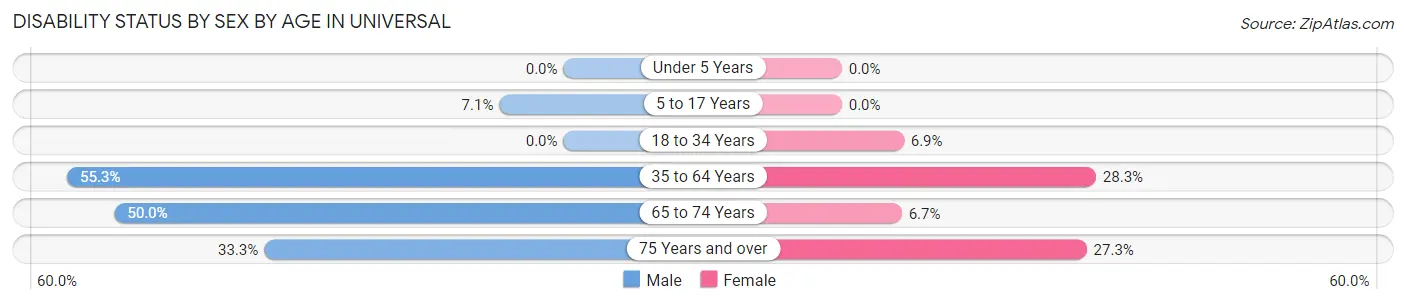
| Age Bracket | Male | Female |
| Under 5 Years | 0 (0.0%) | 0 (0.0%) |
| 5 to 17 Years | 1 (7.1%) | 0 (0.0%) |
| 18 to 34 Years | 0 (0.0%) | 2 (6.9%) |
| 35 to 64 Years | 21 (55.3%) | 15 (28.3%) |
| 65 to 74 Years | 11 (50.0%) | 1 (6.7%) |
| 75 Years and over | 1 (33.3%) | 6 (27.3%) |
Disability Class by Sex by Age in Universal
Disability Class: Hearing Difficulty
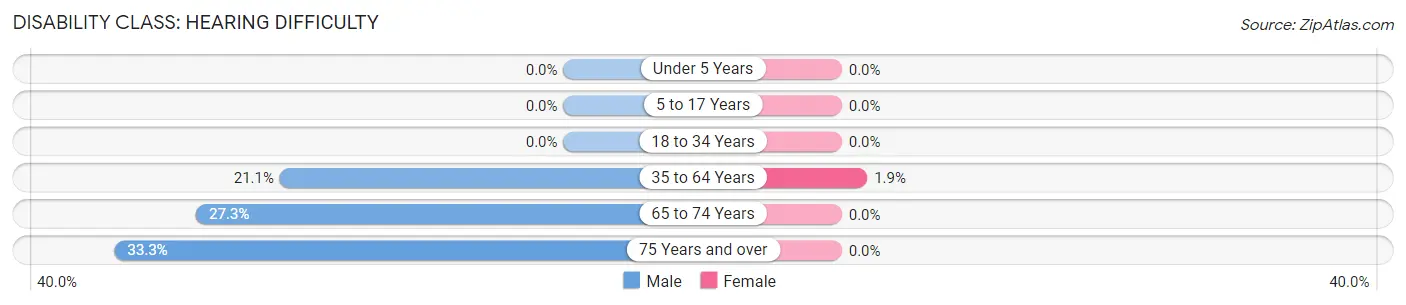
| Age Bracket | Male | Female |
| Under 5 Years | 0 (0.0%) | 0 (0.0%) |
| 5 to 17 Years | 0 (0.0%) | 0 (0.0%) |
| 18 to 34 Years | 0 (0.0%) | 0 (0.0%) |
| 35 to 64 Years | 8 (21.0%) | 1 (1.9%) |
| 65 to 74 Years | 6 (27.3%) | 0 (0.0%) |
| 75 Years and over | 1 (33.3%) | 0 (0.0%) |
Disability Class: Vision Difficulty
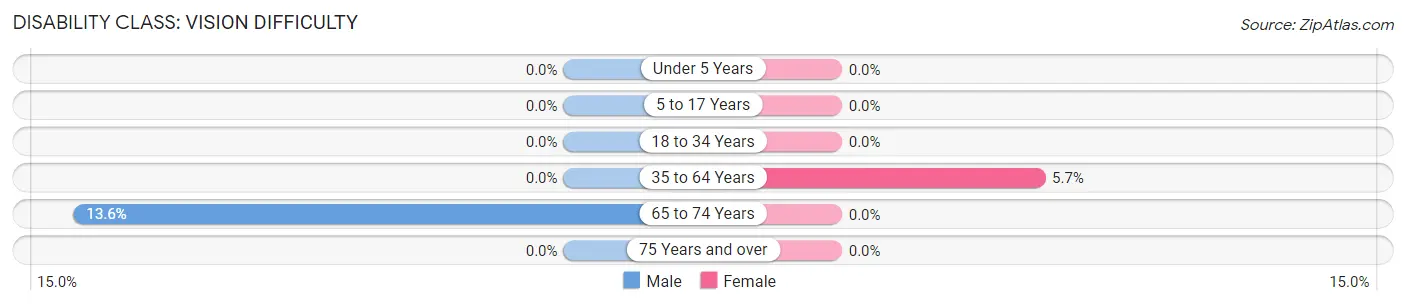
| Age Bracket | Male | Female |
| Under 5 Years | 0 (0.0%) | 0 (0.0%) |
| 5 to 17 Years | 0 (0.0%) | 0 (0.0%) |
| 18 to 34 Years | 0 (0.0%) | 0 (0.0%) |
| 35 to 64 Years | 0 (0.0%) | 3 (5.7%) |
| 65 to 74 Years | 3 (13.6%) | 0 (0.0%) |
| 75 Years and over | 0 (0.0%) | 0 (0.0%) |
Disability Class: Cognitive Difficulty
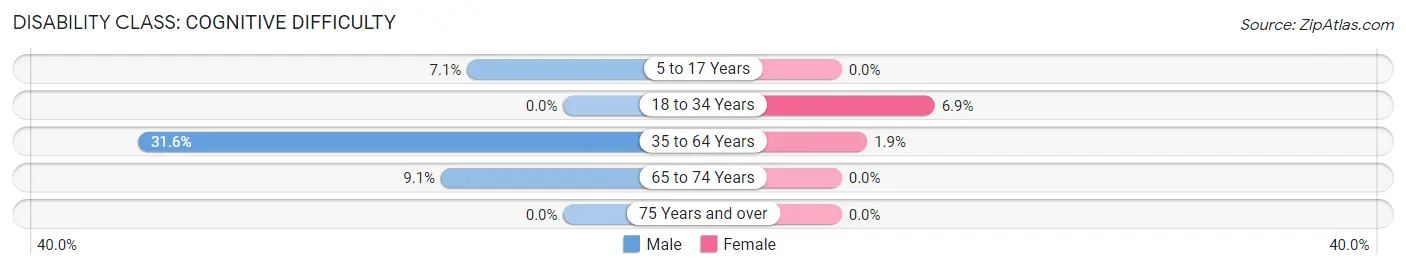
| Age Bracket | Male | Female |
| 5 to 17 Years | 1 (7.1%) | 0 (0.0%) |
| 18 to 34 Years | 0 (0.0%) | 2 (6.9%) |
| 35 to 64 Years | 12 (31.6%) | 1 (1.9%) |
| 65 to 74 Years | 2 (9.1%) | 0 (0.0%) |
| 75 Years and over | 0 (0.0%) | 0 (0.0%) |
Disability Class: Ambulatory Difficulty
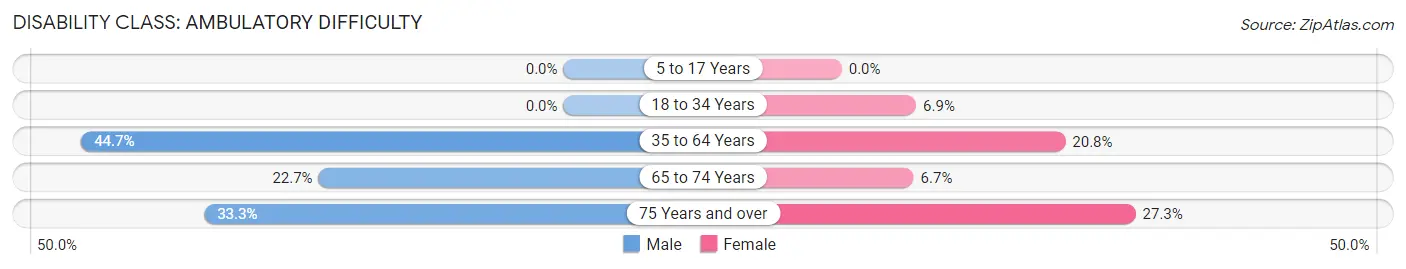
| Age Bracket | Male | Female |
| 5 to 17 Years | 0 (0.0%) | 0 (0.0%) |
| 18 to 34 Years | 0 (0.0%) | 2 (6.9%) |
| 35 to 64 Years | 17 (44.7%) | 11 (20.7%) |
| 65 to 74 Years | 5 (22.7%) | 1 (6.7%) |
| 75 Years and over | 1 (33.3%) | 6 (27.3%) |
Disability Class: Self-Care Difficulty
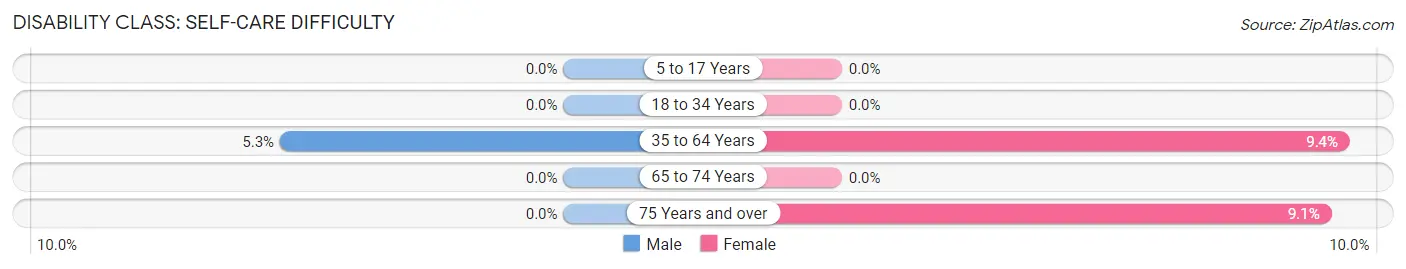
| Age Bracket | Male | Female |
| 5 to 17 Years | 0 (0.0%) | 0 (0.0%) |
| 18 to 34 Years | 0 (0.0%) | 0 (0.0%) |
| 35 to 64 Years | 2 (5.3%) | 5 (9.4%) |
| 65 to 74 Years | 0 (0.0%) | 0 (0.0%) |
| 75 Years and over | 0 (0.0%) | 2 (9.1%) |
Technology Access in Universal
Computing Device Access in Universal
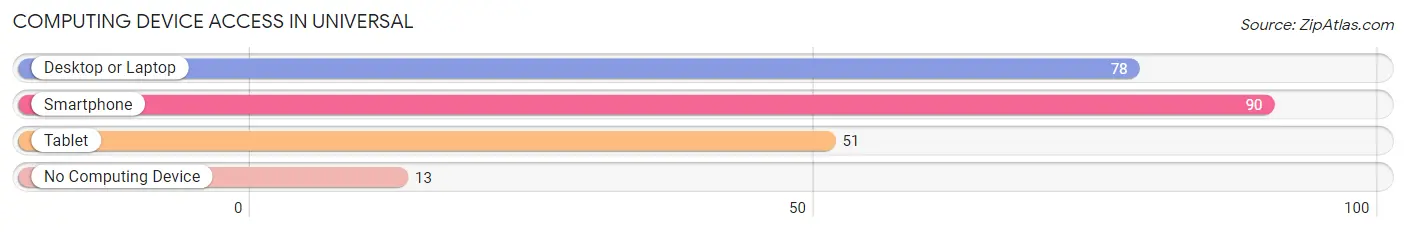
| Device Type | # Households | % Households |
| Desktop or Laptop | 78 | 66.1% |
| Smartphone | 90 | 76.3% |
| Tablet | 51 | 43.2% |
| No Computing Device | 13 | 11.0% |
| Total | 118 | 100.0% |
Internet Access in Universal
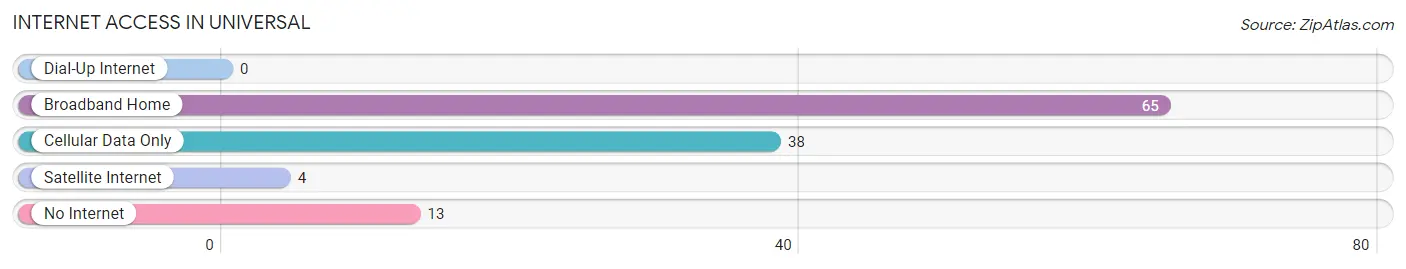
| Internet Type | # Households | % Households |
| Dial-Up Internet | 0 | 0.0% |
| Broadband Home | 65 | 55.1% |
| Cellular Data Only | 38 | 32.2% |
| Satellite Internet | 4 | 3.4% |
| No Internet | 13 | 11.0% |
| Total | 118 | 100.0% |
Universal Summary
Universal
Universal is a term that is used to describe something that is applicable to all people, places, or things. It is often used to describe a concept or idea that is shared by all people, regardless of their culture, race, or religion. Universal concepts are often seen as being fundamental to the human experience, and are often seen as being essential to the functioning of society.
History
The concept of universality has been around for centuries, and has been used in various ways throughout history. In ancient Greece, the concept of universality was used to describe the idea that all people were equal and should be treated as such. This idea was further developed by the Roman Empire, which used the concept of universality to create a unified legal system that applied to all citizens.
In the Middle Ages, the concept of universality was used to describe the idea that all people were subject to the same laws and should be treated equally. This idea was further developed during the Enlightenment, when philosophers such as John Locke argued that all people should have the same rights and freedoms regardless of their social class or race.
The concept of universality was also used in the 19th century to describe the idea that all people should have the same rights and freedoms regardless of their gender or race. This idea was further developed during the 20th century, when the Universal Declaration of Human Rights was adopted by the United Nations in 1948. This document declared that all people should have the same rights and freedoms regardless of their race, gender, or religion.
Geography
The concept of universality is also used in geography to describe the idea that all places on Earth should be treated equally. This idea is often used to describe the idea that all countries should have access to the same resources and opportunities, regardless of their location or size. This concept is often used to describe the idea that all countries should have access to the same level of economic development, regardless of their location or size.
Economy
The concept of universality is also used in economics to describe the idea that all people should have access to the same economic opportunities, regardless of their race, gender, or religion. This idea is often used to describe the idea that all people should have access to the same level of economic development, regardless of their location or size. This concept is often used to describe the idea that all countries should have access to the same level of economic development, regardless of their location or size.
Demographics
The concept of universality is also used in demographics to describe the idea that all people should have access to the same opportunities, regardless of their race, gender, or religion. This idea is often used to describe the idea that all people should have access to the same level of economic development, regardless of their location or size. This concept is often used to describe the idea that all countries should have access to the same level of economic development, regardless of their location or size.
Common Questions
What is Per Capita Income in Universal?
Per Capita income in Universal is $26,413.
What is the Median Family Income in Universal?
Median Family Income in Universal is $60,833.
What is the Median Household income in Universal?
Median Household Income in Universal is $55,000.
What is Family Income Deficit in Universal?
Family Income Deficit in Universal is $5,143.
Families that are below poverty line in Universal earn $5,143 less on average than the poverty threshold level.
What is Inequality or Gini Index in Universal?
Inequality or Gini Index in Universal is 0.32.
What is the Total Population of Universal?
Total Population of Universal is 260.
What is the Total Male Population of Universal?
Total Male Population of Universal is 110.
What is the Total Female Population of Universal?
Total Female Population of Universal is 150.
What is the Ratio of Males per 100 Females in Universal?
There are 73.33 Males per 100 Females in Universal.
What is the Ratio of Females per 100 Males in Universal?
There are 136.36 Females per 100 Males in Universal.
What is the Median Population Age in Universal?
Median Population Age in Universal is 40.6 Years.
What is the Average Family Size in Universal
Average Family Size in Universal is 2.8 People.
What is the Average Household Size in Universal
Average Household Size in Universal is 2.2 People.
How Large is the Labor Force in Universal?
There are 113 People in the Labor Forcein in Universal.
What is the Percentage of People in the Labor Force in Universal?
54.3% of People are in the Labor Force in Universal.
What is the Unemployment Rate in Universal?
Unemployment Rate in Universal is 6.2%.