Union City, IN Map & Demographics
Union City Map
Union City Overview
$24,094
PER CAPITA INCOME
$54,760
AVG FAMILY INCOME
$36,250
AVG HOUSEHOLD INCOME
18.2%
WAGE / INCOME GAP [ % ]
81.8¢/ $1
WAGE / INCOME GAP [ $ ]
0.45
INEQUALITY / GINI INDEX
3,511
TOTAL POPULATION
1,819
MALE POPULATION
1,692
FEMALE POPULATION
107.51
MALES / 100 FEMALES
93.02
FEMALES / 100 MALES
37.8
MEDIAN AGE
3.2
AVG FAMILY SIZE
2.2
AVG HOUSEHOLD SIZE
1,437
LABOR FORCE [ PEOPLE ]
56.9%
PERCENT IN LABOR FORCE
10.0%
UNEMPLOYMENT RATE
Union City Zip Codes
Union City Area Codes
Income in Union City
Income Overview in Union City
Per Capita Income in Union City is $24,094, while median incomes of families and households are $54,760 and $36,250 respectively.
| Characteristic | Number | Measure |
| Per Capita Income | 3,511 | $24,094 |
| Median Family Income | 781 | $54,760 |
| Mean Family Income | 781 | $65,967 |
| Median Household Income | 1,583 | $36,250 |
| Mean Household Income | 1,583 | $51,406 |
| Income Deficit | 781 | $0 |
| Wage / Income Gap (%) | 3,511 | 18.17% |
| Wage / Income Gap ($) | 3,511 | 81.83¢ per $1 |
| Gini / Inequality Index | 3,511 | 0.45 |
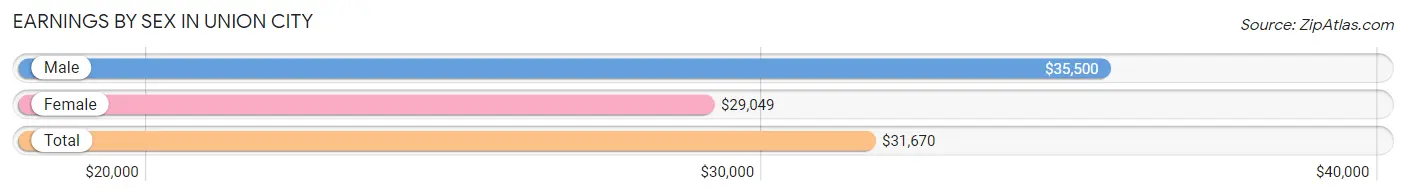
Earnings by Sex in Union City
Average Earnings in Union City are $31,670, $35,500 for men and $29,049 for women, a difference of 18.2%.
| Sex | Number | Average Earnings |
| Male | 858 (60.0%) | $35,500 |
| Female | 573 (40.0%) | $29,049 |
| Total | 1,431 (100.0%) | $31,670 |
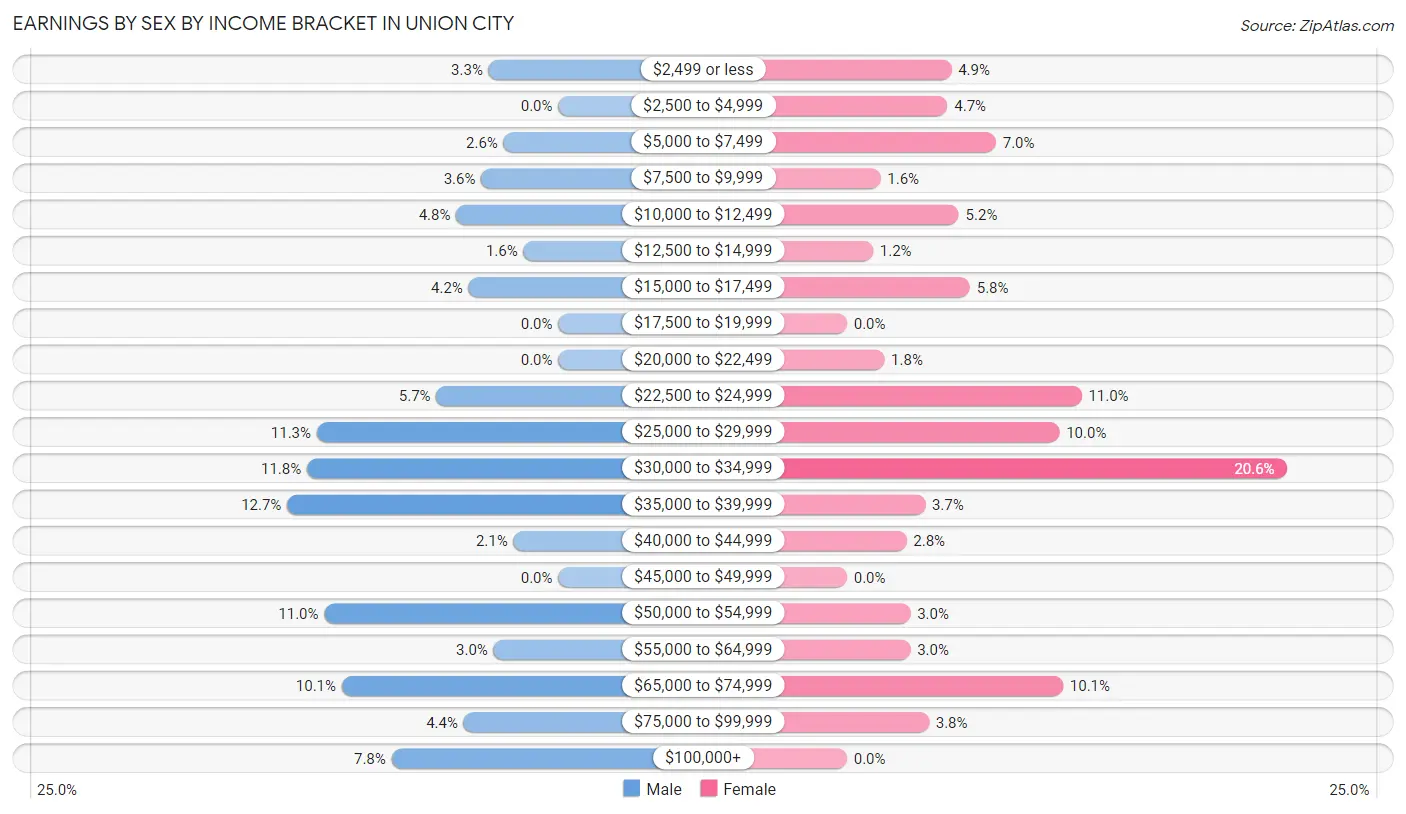
Earnings by Sex by Income Bracket in Union City
The most common earnings brackets in Union City are $35,000 to $39,999 for men (109 | 12.7%) and $30,000 to $34,999 for women (118 | 20.6%).
| Income | Male | Female |
| $2,499 or less | 28 (3.3%) | 28 (4.9%) |
| $2,500 to $4,999 | 0 (0.0%) | 27 (4.7%) |
| $5,000 to $7,499 | 22 (2.6%) | 40 (7.0%) |
| $7,500 to $9,999 | 31 (3.6%) | 9 (1.6%) |
| $10,000 to $12,499 | 41 (4.8%) | 30 (5.2%) |
| $12,500 to $14,999 | 14 (1.6%) | 7 (1.2%) |
| $15,000 to $17,499 | 36 (4.2%) | 33 (5.8%) |
| $17,500 to $19,999 | 0 (0.0%) | 0 (0.0%) |
| $20,000 to $22,499 | 0 (0.0%) | 10 (1.8%) |
| $22,500 to $24,999 | 49 (5.7%) | 63 (11.0%) |
| $25,000 to $29,999 | 97 (11.3%) | 57 (10.0%) |
| $30,000 to $34,999 | 101 (11.8%) | 118 (20.6%) |
| $35,000 to $39,999 | 109 (12.7%) | 21 (3.7%) |
| $40,000 to $44,999 | 18 (2.1%) | 16 (2.8%) |
| $45,000 to $49,999 | 0 (0.0%) | 0 (0.0%) |
| $50,000 to $54,999 | 94 (11.0%) | 17 (3.0%) |
| $55,000 to $64,999 | 26 (3.0%) | 17 (3.0%) |
| $65,000 to $74,999 | 87 (10.1%) | 58 (10.1%) |
| $75,000 to $99,999 | 38 (4.4%) | 22 (3.8%) |
| $100,000+ | 67 (7.8%) | 0 (0.0%) |
| Total | 858 (100.0%) | 573 (100.0%) |
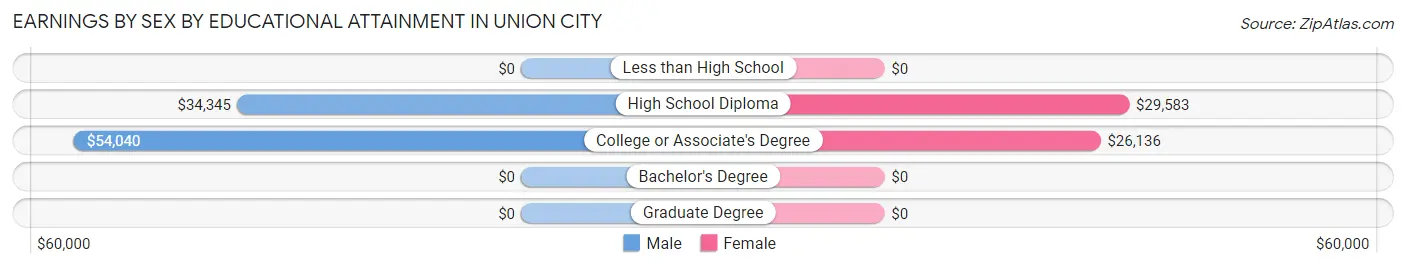
Earnings by Sex by Educational Attainment in Union City
Average earnings in Union City are $38,199 for men and $30,549 for women, a difference of 20.0%. Men with an educational attainment of college or associate's degree enjoy the highest average annual earnings of $54,040, while those with high school diploma education earn the least with $34,345. Women with an educational attainment of high school diploma earn the most with the average annual earnings of $29,583, while those with college or associate's degree education have the smallest earnings of $26,136.
| Educational Attainment | Male Income | Female Income |
| Less than High School | - | - |
| High School Diploma | $34,345 | $29,583 |
| College or Associate's Degree | $54,040 | $26,136 |
| Bachelor's Degree | - | - |
| Graduate Degree | - | - |
| Total | $38,199 | $30,549 |
Family Income in Union City
Family Income Brackets in Union City
According to the Union City family income data, there are 148 families falling into the $50,000 to $74,999 income range, which is the most common income bracket and makes up 19.0% of all families. Conversely, the $10,000 to $14,999 income bracket is the least frequent group with only 14 families (1.8%) belonging to this category.
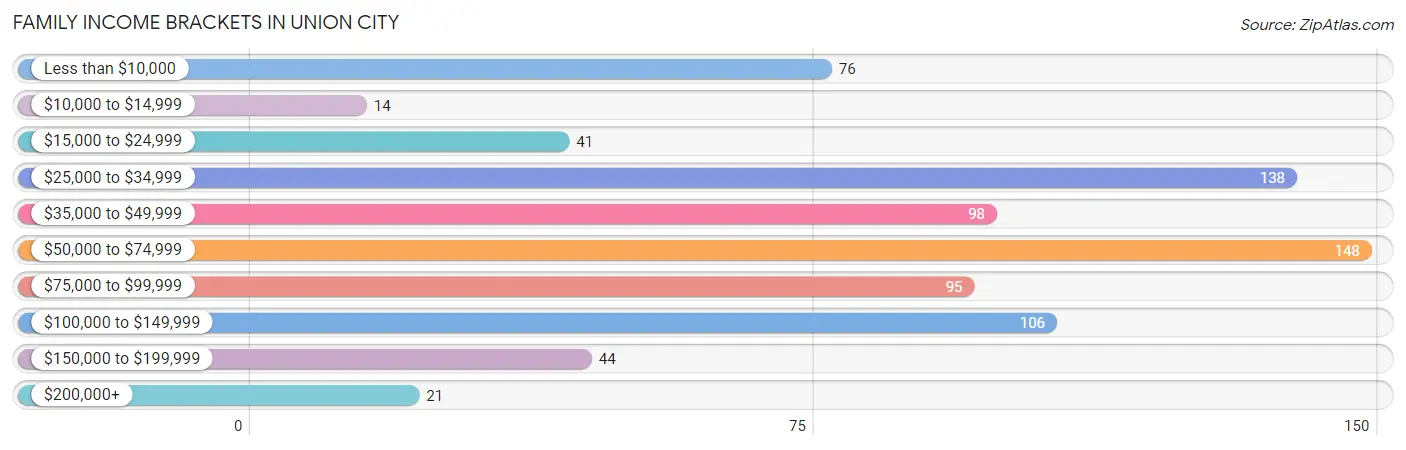
| Income Bracket | # Families | % Families |
| Less than $10,000 | 76 | 9.7% |
| $10,000 to $14,999 | 14 | 1.8% |
| $15,000 to $24,999 | 41 | 5.2% |
| $25,000 to $34,999 | 138 | 17.7% |
| $35,000 to $49,999 | 98 | 12.5% |
| $50,000 to $74,999 | 148 | 19.0% |
| $75,000 to $99,999 | 95 | 12.2% |
| $100,000 to $149,999 | 106 | 13.6% |
| $150,000 to $199,999 | 44 | 5.6% |
| $200,000+ | 21 | 2.7% |
Family Income by Famaliy Size in Union City
2-person families (348 | 44.6%) account for the highest median family income in Union City with $60,300 per family, while 2-person families (348 | 44.6%) have the highest median income of $30,150 per family member.
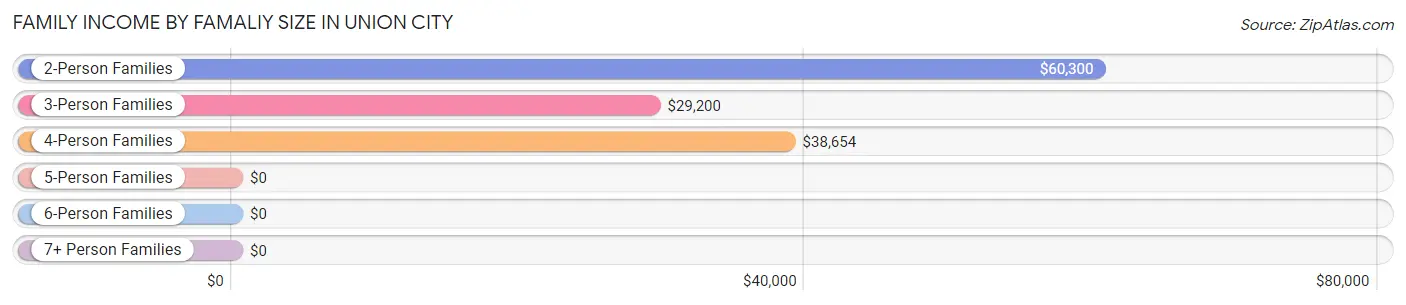
| Income Bracket | # Families | Median Income |
| 2-Person Families | 348 (44.6%) | $60,300 |
| 3-Person Families | 128 (16.4%) | $29,200 |
| 4-Person Families | 174 (22.3%) | $38,654 |
| 5-Person Families | 83 (10.6%) | $0 |
| 6-Person Families | 48 (6.1%) | $0 |
| 7+ Person Families | 0 (0.0%) | $0 |
| Total | 781 (100.0%) | $54,760 |
Family Income by Number of Earners in Union City
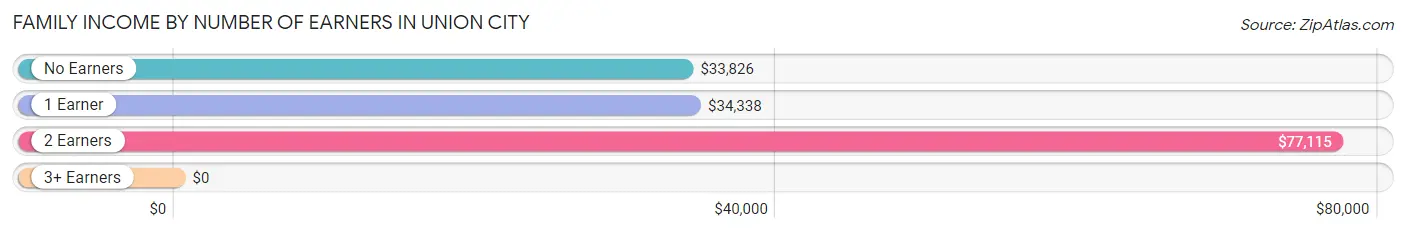
| Number of Earners | # Families | Median Income |
| No Earners | 223 (28.5%) | $33,826 |
| 1 Earner | 275 (35.2%) | $34,338 |
| 2 Earners | 226 (28.9%) | $77,115 |
| 3+ Earners | 57 (7.3%) | $0 |
| Total | 781 (100.0%) | $54,760 |
Household Income in Union City
Household Income Brackets in Union City
With 312 households falling in the category, the $15,000 to $24,999 income range is the most frequent in Union City, accounting for 19.7% of all households. In contrast, only 21 households (1.3%) fall into the $200,000+ income bracket, making it the least populous group.
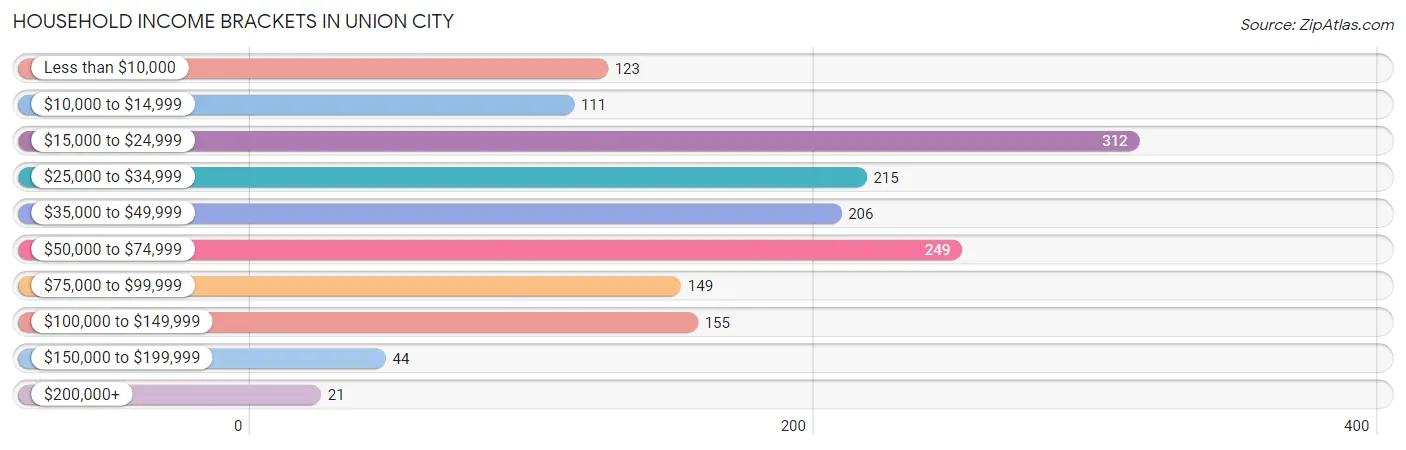
| Income Bracket | # Households | % Households |
| Less than $10,000 | 123 | 7.8% |
| $10,000 to $14,999 | 111 | 7.0% |
| $15,000 to $24,999 | 312 | 19.7% |
| $25,000 to $34,999 | 215 | 13.6% |
| $35,000 to $49,999 | 206 | 13.0% |
| $50,000 to $74,999 | 249 | 15.7% |
| $75,000 to $99,999 | 149 | 9.4% |
| $100,000 to $149,999 | 155 | 9.8% |
| $150,000 to $199,999 | 44 | 2.8% |
| $200,000+ | 21 | 1.3% |
Household Income by Householder Age in Union City
The median household income in Union City is $36,250, with the highest median household income of $61,797 found in the 15 to 24 years age bracket for the primary householder. A total of 35 households (2.2%) fall into this category. Meanwhile, the 25 to 44 years age bracket for the primary householder has the lowest median household income of $34,647, with 546 households (34.5%) in this group.
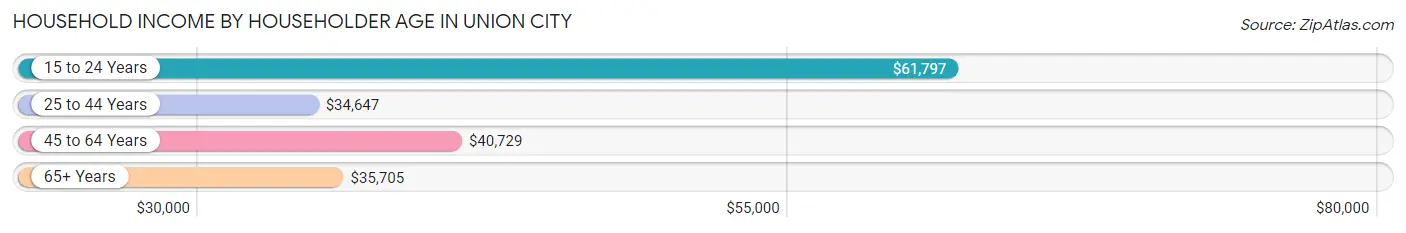
| Income Bracket | # Households | Median Income |
| 15 to 24 Years | 35 (2.2%) | $61,797 |
| 25 to 44 Years | 546 (34.5%) | $34,647 |
| 45 to 64 Years | 545 (34.4%) | $40,729 |
| 65+ Years | 457 (28.9%) | $35,705 |
| Total | 1,583 (100.0%) | $36,250 |
Poverty in Union City
Income Below Poverty by Sex and Age in Union City
With 20.2% poverty level for males and 26.7% for females among the residents of Union City, under 5 year old males and 5 year old females are the most vulnerable to poverty, with 119 males (61.7%) and 26 females (100.0%) in their respective age groups living below the poverty level.
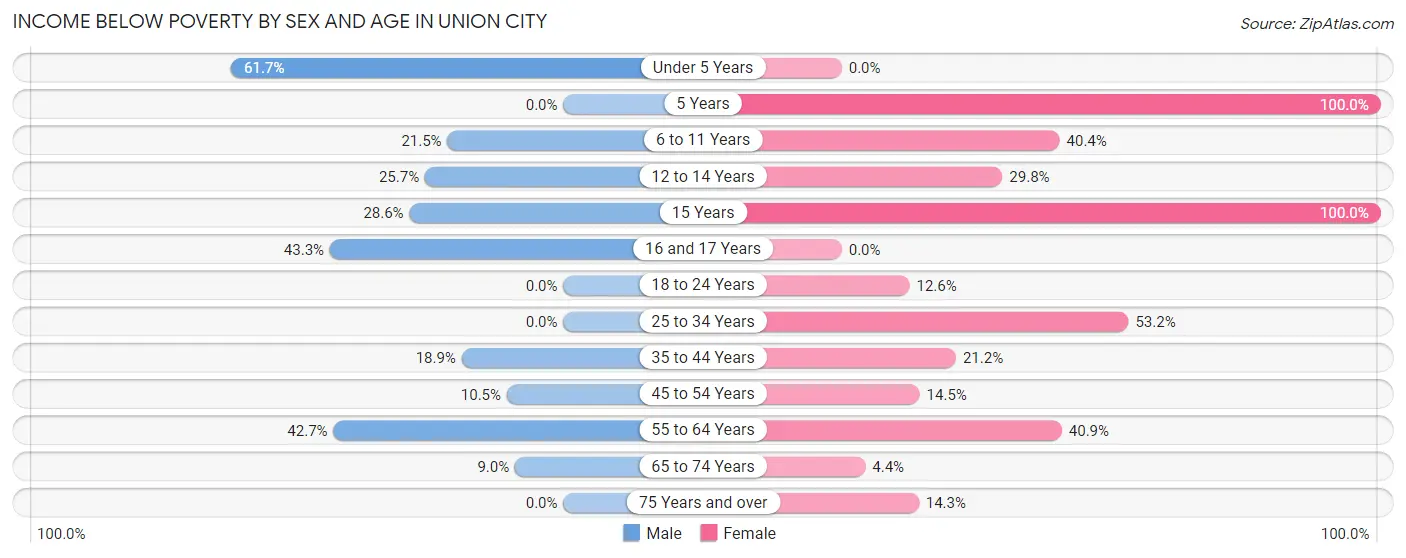
| Age Bracket | Male | Female |
| Under 5 Years | 119 (61.7%) | 0 (0.0%) |
| 5 Years | 0 (0.0%) | 26 (100.0%) |
| 6 to 11 Years | 37 (21.5%) | 76 (40.4%) |
| 12 to 14 Years | 19 (25.7%) | 48 (29.8%) |
| 15 Years | 12 (28.6%) | 26 (100.0%) |
| 16 and 17 Years | 13 (43.3%) | 0 (0.0%) |
| 18 to 24 Years | 0 (0.0%) | 19 (12.6%) |
| 25 to 34 Years | 0 (0.0%) | 83 (53.2%) |
| 35 to 44 Years | 30 (18.9%) | 60 (21.2%) |
| 45 to 54 Years | 15 (10.5%) | 25 (14.4%) |
| 55 to 64 Years | 102 (42.7%) | 58 (40.8%) |
| 65 to 74 Years | 20 (9.0%) | 8 (4.4%) |
| 75 Years and over | 0 (0.0%) | 18 (14.3%) |
| Total | 367 (20.2%) | 447 (26.7%) |
Income Above Poverty by Sex and Age in Union City
According to the poverty statistics in Union City, males aged 5 years and females aged under 5 years are the age groups that are most secure financially, with 100.0% of males and 100.0% of females in these age groups living above the poverty line.
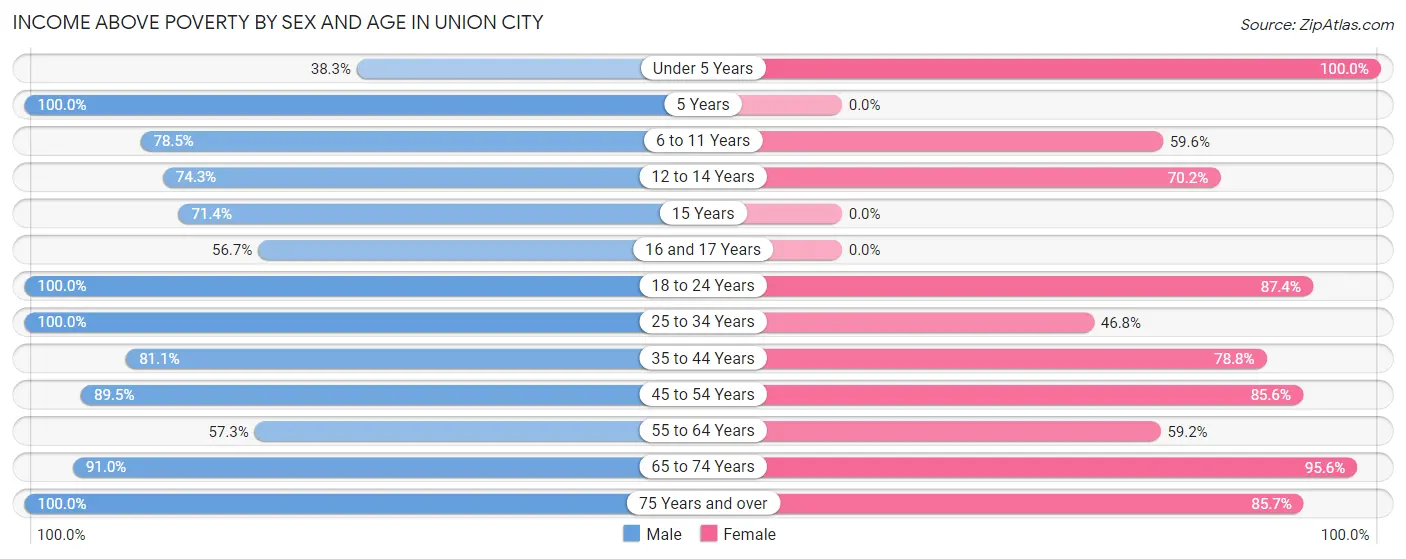
| Age Bracket | Male | Female |
| Under 5 Years | 74 (38.3%) | 62 (100.0%) |
| 5 Years | 42 (100.0%) | 0 (0.0%) |
| 6 to 11 Years | 135 (78.5%) | 112 (59.6%) |
| 12 to 14 Years | 55 (74.3%) | 113 (70.2%) |
| 15 Years | 30 (71.4%) | 0 (0.0%) |
| 16 and 17 Years | 17 (56.7%) | 0 (0.0%) |
| 18 to 24 Years | 120 (100.0%) | 132 (87.4%) |
| 25 to 34 Years | 254 (100.0%) | 73 (46.8%) |
| 35 to 44 Years | 129 (81.1%) | 223 (78.8%) |
| 45 to 54 Years | 128 (89.5%) | 148 (85.6%) |
| 55 to 64 Years | 137 (57.3%) | 84 (59.2%) |
| 65 to 74 Years | 203 (91.0%) | 175 (95.6%) |
| 75 Years and over | 128 (100.0%) | 108 (85.7%) |
| Total | 1,452 (79.8%) | 1,230 (73.4%) |
Income Below Poverty Among Married-Couple Families in Union City
The poverty statistics for married-couple families in Union City show that 6.5% or 30 of the total 460 families live below the poverty line. Families with 3 or 4 children have the highest poverty rate of 23.5%, comprising of 20 families. On the other hand, families with 1 or 2 children have the lowest poverty rate of 0.0%, which includes 0 families.
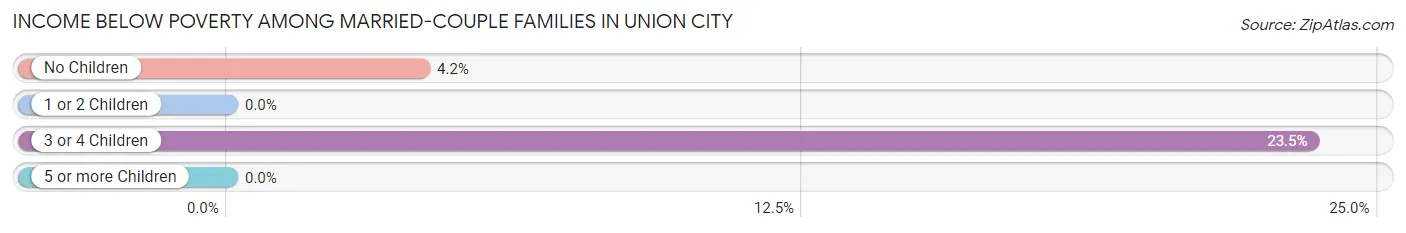
| Children | Above Poverty | Below Poverty |
| No Children | 229 (95.8%) | 10 (4.2%) |
| 1 or 2 Children | 136 (100.0%) | 0 (0.0%) |
| 3 or 4 Children | 65 (76.5%) | 20 (23.5%) |
| 5 or more Children | 0 (0.0%) | 0 (0.0%) |
| Total | 430 (93.5%) | 30 (6.5%) |
Income Below Poverty Among Single-Parent Households in Union City
According to the poverty data in Union City, 23.7% or 14 single-father households and 42.7% or 112 single-mother households are living below the poverty line. Among single-father households, those with 3 or 4 children have the highest poverty rate, with 14 households (100.0%) experiencing poverty. Likewise, among single-mother households, those with 3 or 4 children have the highest poverty rate, with 61 households (100.0%) falling below the poverty line.
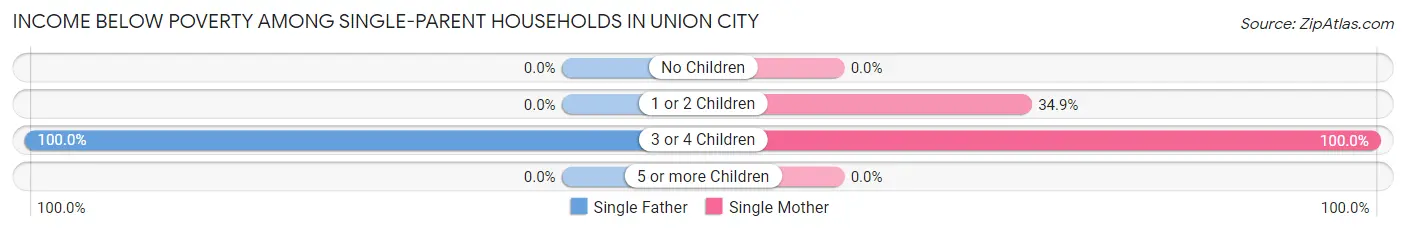
| Children | Single Father | Single Mother |
| No Children | 0 (0.0%) | 0 (0.0%) |
| 1 or 2 Children | 0 (0.0%) | 51 (34.9%) |
| 3 or 4 Children | 14 (100.0%) | 61 (100.0%) |
| 5 or more Children | 0 (0.0%) | 0 (0.0%) |
| Total | 14 (23.7%) | 112 (42.7%) |
Income Below Poverty Among Married-Couple vs Single-Parent Households in Union City
The poverty data for Union City shows that 30 of the married-couple family households (6.5%) and 126 of the single-parent households (39.3%) are living below the poverty level. Within the married-couple family households, those with 3 or 4 children have the highest poverty rate, with 20 households (23.5%) falling below the poverty line. Among the single-parent households, those with 3 or 4 children have the highest poverty rate, with 75 household (100.0%) living below poverty.
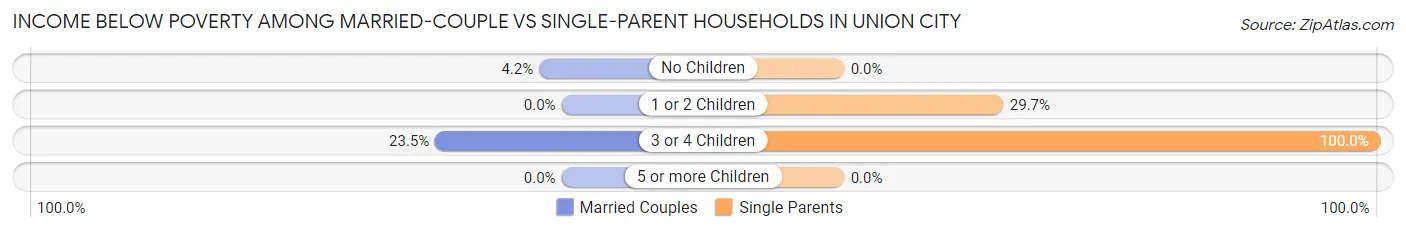
| Children | Married-Couple Families | Single-Parent Households |
| No Children | 10 (4.2%) | 0 (0.0%) |
| 1 or 2 Children | 0 (0.0%) | 51 (29.6%) |
| 3 or 4 Children | 20 (23.5%) | 75 (100.0%) |
| 5 or more Children | 0 (0.0%) | 0 (0.0%) |
| Total | 30 (6.5%) | 126 (39.3%) |
Race in Union City
The most populous races in Union City are White / Caucasian (2,835 | 80.7%), Hispanic or Latino (648 | 18.5%), and Two or more Races (487 | 13.9%).
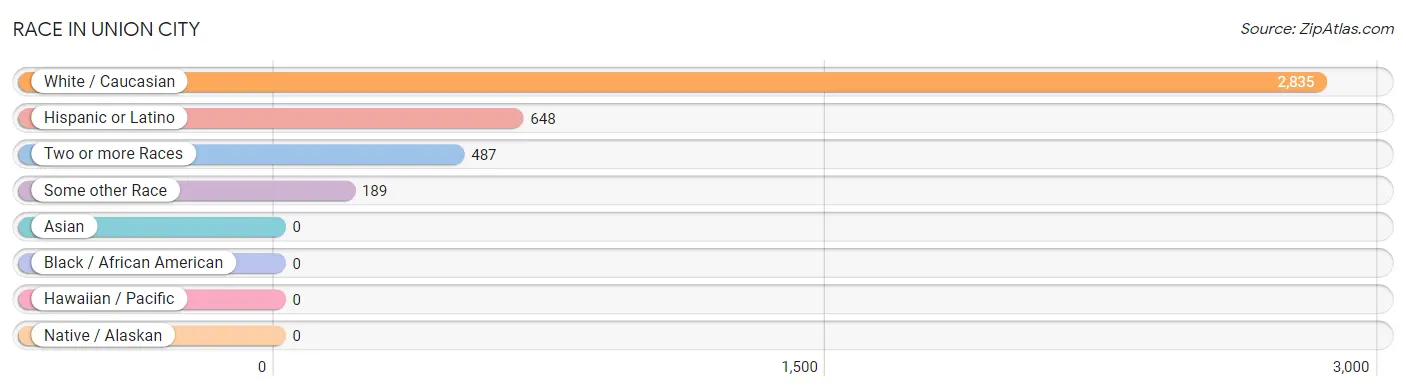
| Race | # Population | % Population |
| Asian | 0 | 0.0% |
| Black / African American | 0 | 0.0% |
| Hawaiian / Pacific | 0 | 0.0% |
| Hispanic or Latino | 648 | 18.5% |
| Native / Alaskan | 0 | 0.0% |
| White / Caucasian | 2,835 | 80.7% |
| Two or more Races | 487 | 13.9% |
| Some other Race | 189 | 5.4% |
| Total | 3,511 | 100.0% |
Ancestry in Union City
The most populous ancestries reported in Union City are German (619 | 17.6%), Mexican (516 | 14.7%), Irish (491 | 14.0%), English (277 | 7.9%), and American (257 | 7.3%), together accounting for 61.5% of all Union City residents.
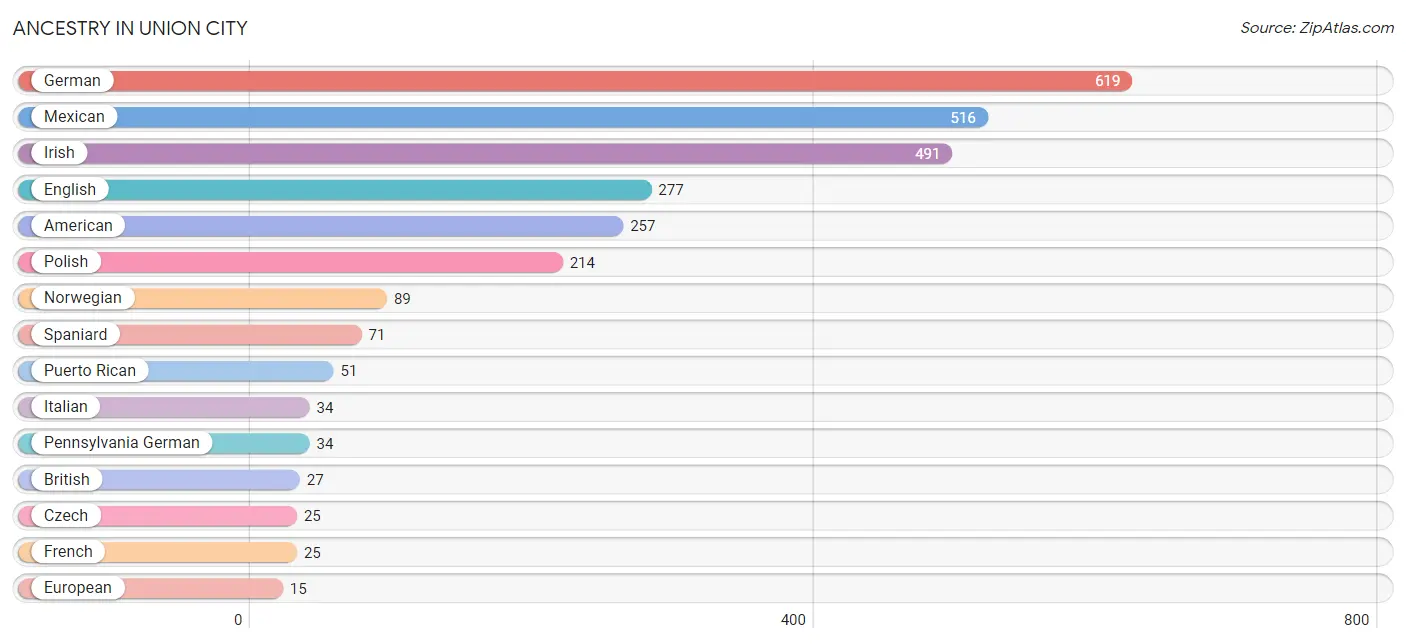
| Ancestry | # Population | % Population |
| American | 257 | 7.3% |
| British | 27 | 0.8% |
| Czech | 25 | 0.7% |
| English | 277 | 7.9% |
| European | 15 | 0.4% |
| French | 25 | 0.7% |
| German | 619 | 17.6% |
| Irish | 491 | 14.0% |
| Italian | 34 | 1.0% |
| Mexican | 516 | 14.7% |
| Norwegian | 89 | 2.5% |
| Pennsylvania German | 34 | 1.0% |
| Polish | 214 | 6.1% |
| Puerto Rican | 51 | 1.5% |
| Scottish | 8 | 0.2% |
| Spaniard | 71 | 2.0% |
| Spanish | 10 | 0.3% |
| Welsh | 12 | 0.3% | View All 18 Rows |
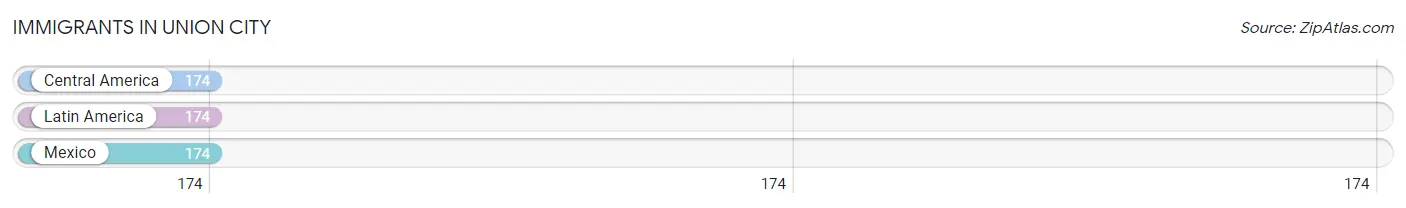
Immigrants in Union City
The most numerous immigrant groups reported in Union City came from Central America (174 | 5.0%), Latin America (174 | 5.0%), and Mexico (174 | 5.0%), together accounting for 14.9% of all Union City residents.
| Immigration Origin | # Population | % Population |
| Central America | 174 | 5.0% |
| Latin America | 174 | 5.0% |
| Mexico | 174 | 5.0% | View All 3 Rows |
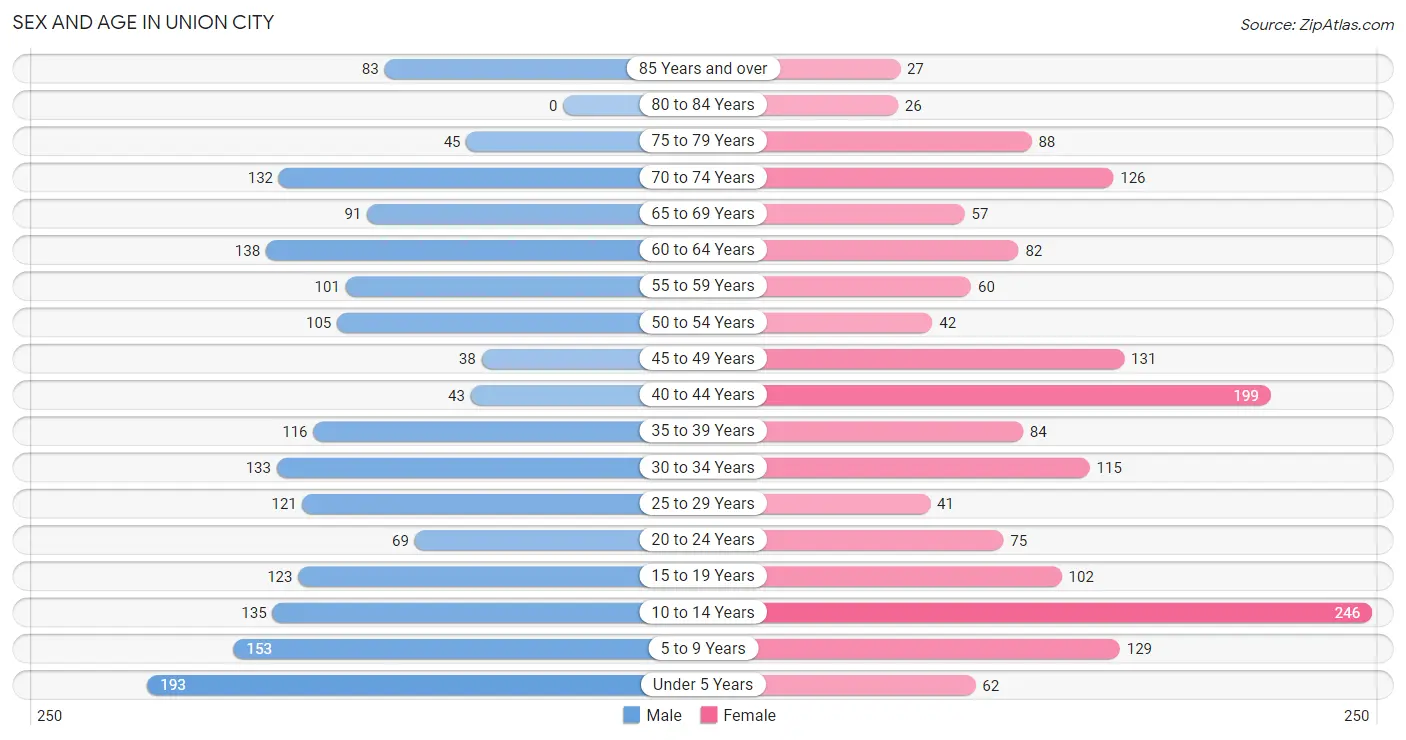
Sex and Age in Union City
Sex and Age in Union City
The most populous age groups in Union City are Under 5 Years (193 | 10.6%) for men and 10 to 14 Years (246 | 14.5%) for women.
| Age Bracket | Male | Female |
| Under 5 Years | 193 (10.6%) | 62 (3.7%) |
| 5 to 9 Years | 153 (8.4%) | 129 (7.6%) |
| 10 to 14 Years | 135 (7.4%) | 246 (14.5%) |
| 15 to 19 Years | 123 (6.8%) | 102 (6.0%) |
| 20 to 24 Years | 69 (3.8%) | 75 (4.4%) |
| 25 to 29 Years | 121 (6.7%) | 41 (2.4%) |
| 30 to 34 Years | 133 (7.3%) | 115 (6.8%) |
| 35 to 39 Years | 116 (6.4%) | 84 (5.0%) |
| 40 to 44 Years | 43 (2.4%) | 199 (11.8%) |
| 45 to 49 Years | 38 (2.1%) | 131 (7.7%) |
| 50 to 54 Years | 105 (5.8%) | 42 (2.5%) |
| 55 to 59 Years | 101 (5.6%) | 60 (3.5%) |
| 60 to 64 Years | 138 (7.6%) | 82 (4.9%) |
| 65 to 69 Years | 91 (5.0%) | 57 (3.4%) |
| 70 to 74 Years | 132 (7.3%) | 126 (7.4%) |
| 75 to 79 Years | 45 (2.5%) | 88 (5.2%) |
| 80 to 84 Years | 0 (0.0%) | 26 (1.5%) |
| 85 Years and over | 83 (4.6%) | 27 (1.6%) |
| Total | 1,819 (100.0%) | 1,692 (100.0%) |
Families and Households in Union City
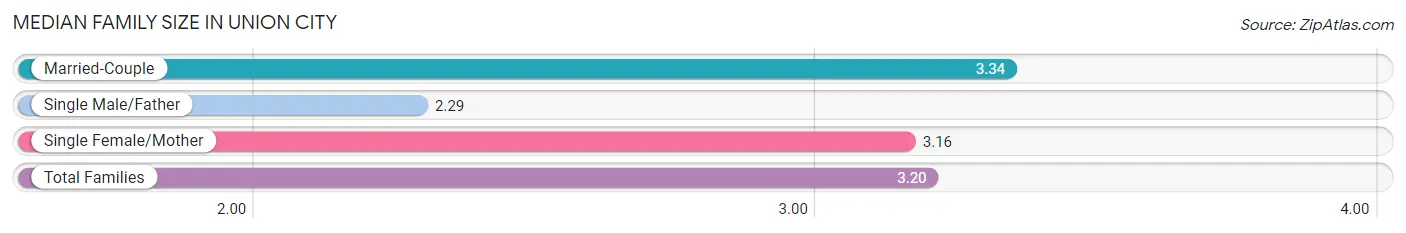
Median Family Size in Union City
The median family size in Union City is 3.20 persons per family, with married-couple families (460 | 58.9%) accounting for the largest median family size of 3.34 persons per family. On the other hand, single male/father families (59 | 7.5%) represent the smallest median family size with 2.29 persons per family.
| Family Type | # Families | Family Size |
| Married-Couple | 460 (58.9%) | 3.34 |
| Single Male/Father | 59 (7.5%) | 2.29 |
| Single Female/Mother | 262 (33.6%) | 3.16 |
| Total Families | 781 (100.0%) | 3.20 |
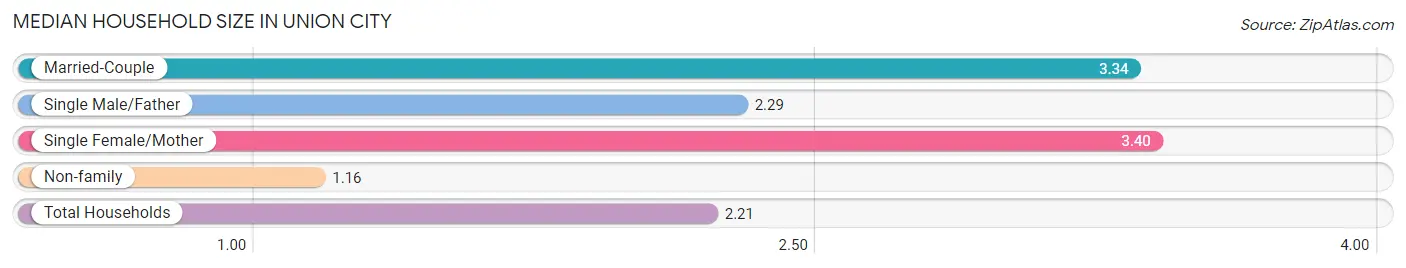
Median Household Size in Union City
The median household size in Union City is 2.21 persons per household, with single female/mother households (262 | 16.6%) accounting for the largest median household size of 3.4 persons per household. non-family households (802 | 50.7%) represent the smallest median household size with 1.16 persons per household.
| Household Type | # Households | Household Size |
| Married-Couple | 460 (29.1%) | 3.34 |
| Single Male/Father | 59 (3.7%) | 2.29 |
| Single Female/Mother | 262 (16.6%) | 3.40 |
| Non-family | 802 (50.7%) | 1.16 |
| Total Households | 1,583 (100.0%) | 2.21 |
Household Size by Marriage Status in Union City
Out of a total of 1,583 households in Union City, 781 (49.3%) are family households, while 802 (50.7%) are nonfamily households. The most numerous type of family households are 2-person households, comprising 331, and the most common type of nonfamily households are 1-person households, comprising 684.
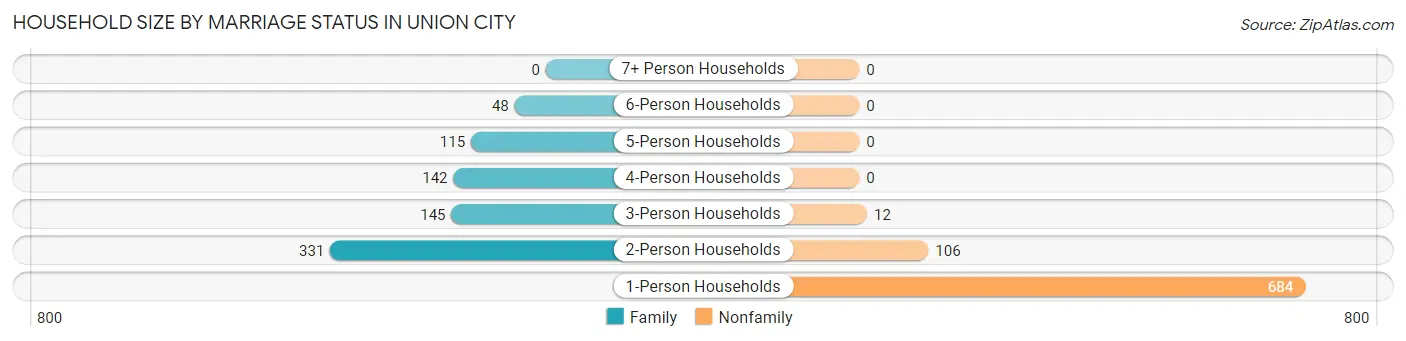
| Household Size | Family Households | Nonfamily Households |
| 1-Person Households | - | 684 (43.2%) |
| 2-Person Households | 331 (20.9%) | 106 (6.7%) |
| 3-Person Households | 145 (9.2%) | 12 (0.8%) |
| 4-Person Households | 142 (9.0%) | 0 (0.0%) |
| 5-Person Households | 115 (7.3%) | 0 (0.0%) |
| 6-Person Households | 48 (3.0%) | 0 (0.0%) |
| 7+ Person Households | 0 (0.0%) | 0 (0.0%) |
| Total | 781 (49.3%) | 802 (50.7%) |
Female Fertility in Union City
Fertility by Age in Union City
Average fertility rate in Union City is 60.0 births per 1,000 women. Women in the age bracket of 20 to 34 years have the highest fertility rate with 203.0 births per 1,000 women. Women in the age bracket of 20 to 34 years acount for 100.0% of all women with births.
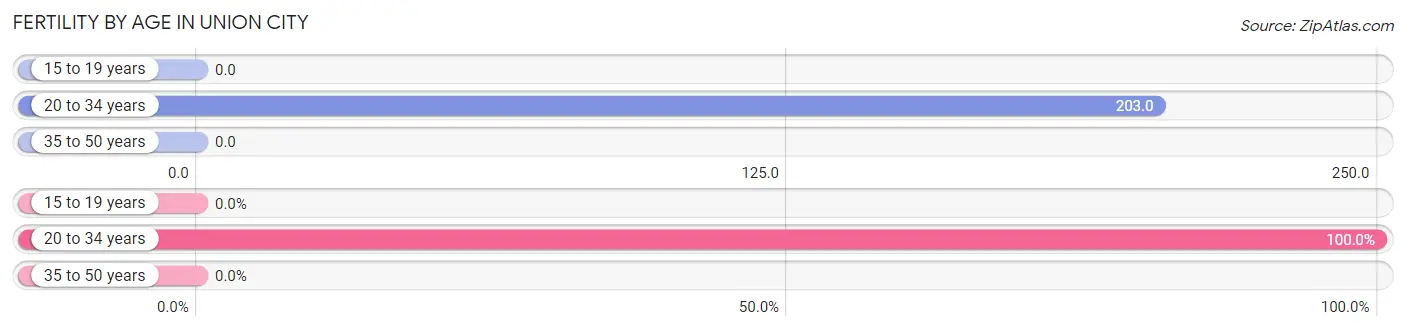
| Age Bracket | Women with Births | Births / 1,000 Women |
| 15 to 19 years | 0 (0.0%) | 0.0 |
| 20 to 34 years | 47 (100.0%) | 203.0 |
| 35 to 50 years | 0 (0.0%) | 0.0 |
| Total | 47 (100.0%) | 60.0 |
Fertility by Age by Marriage Status in Union City
55.3% of women with births (47) in Union City are married. The highest percentage of unmarried women with births falls into 20 to 34 years age bracket with 44.7% of them unmarried at the time of birth, while the lowest percentage of unmarried women with births belong to 20 to 34 years age bracket with 44.7% of them unmarried.
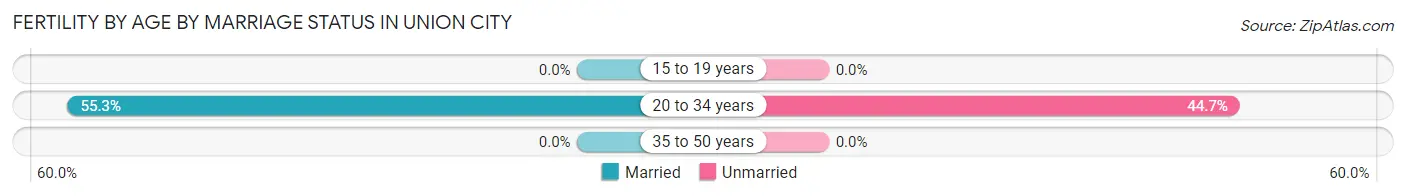
| Age Bracket | Married | Unmarried |
| 15 to 19 years | 0 (0.0%) | 0 (0.0%) |
| 20 to 34 years | 26 (55.3%) | 21 (44.7%) |
| 35 to 50 years | 0 (0.0%) | 0 (0.0%) |
| Total | 26 (55.3%) | 21 (44.7%) |
Fertility by Education in Union City
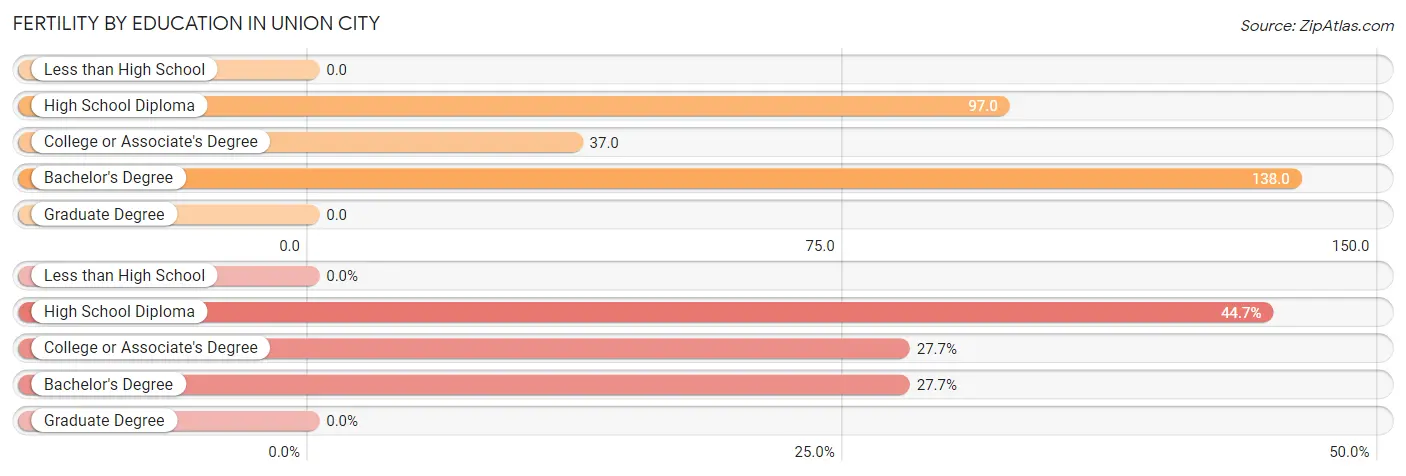
| Educational Attainment | Women with Births | Births / 1,000 Women |
| Less than High School | 0 (0.0%) | 0.0 |
| High School Diploma | 21 (44.7%) | 97.0 |
| College or Associate's Degree | 13 (27.7%) | 37.0 |
| Bachelor's Degree | 13 (27.7%) | 138.0 |
| Graduate Degree | 0 (0.0%) | 0.0 |
| Total | 47 (100.0%) | 60.0 |
Fertility by Education by Marriage Status in Union City
44.7% of women with births in Union City are unmarried. Women with the educational attainment of college or associate's degree are most likely to be married with 100.0% of them married at childbirth, while women with the educational attainment of high school diploma are least likely to be married with 100.0% of them unmarried at childbirth.
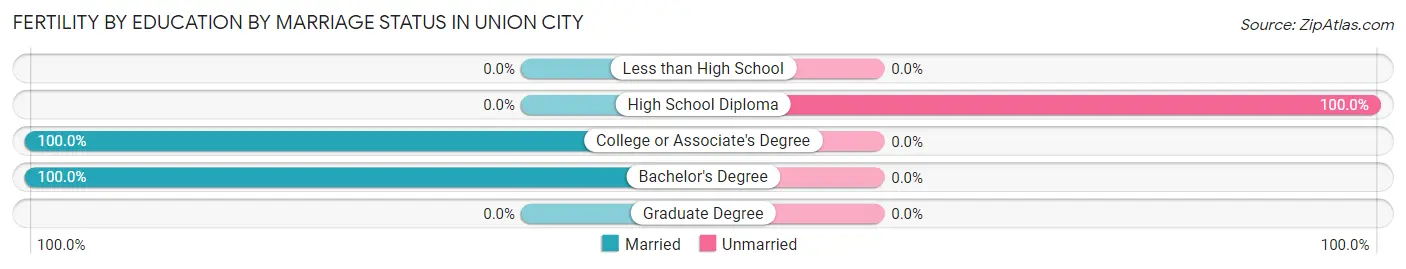
| Educational Attainment | Married | Unmarried |
| Less than High School | 0 (0.0%) | 0 (0.0%) |
| High School Diploma | 0 (0.0%) | 21 (100.0%) |
| College or Associate's Degree | 13 (100.0%) | 0 (0.0%) |
| Bachelor's Degree | 13 (100.0%) | 0 (0.0%) |
| Graduate Degree | 0 (0.0%) | 0 (0.0%) |
| Total | 26 (55.3%) | 21 (44.7%) |
Employment Characteristics in Union City
Employment by Class of Employer in Union City
Among the 1,273 employed individuals in Union City, private company employees (909 | 71.4%), local government employees (189 | 14.8%), and not-for-profit organizations (117 | 9.2%) make up the most common classes of employment.
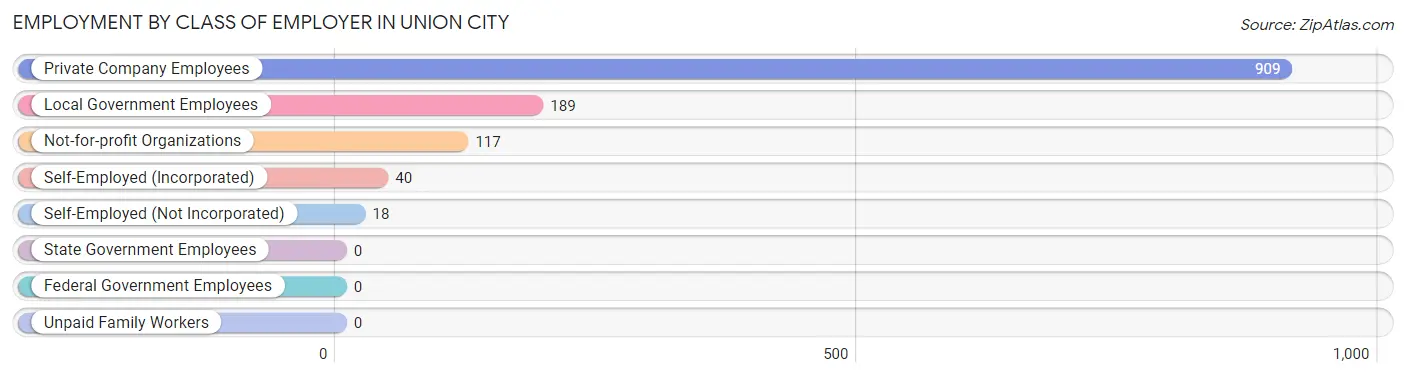
| Employer Class | # Employees | % Employees |
| Private Company Employees | 909 | 71.4% |
| Self-Employed (Incorporated) | 40 | 3.1% |
| Self-Employed (Not Incorporated) | 18 | 1.4% |
| Not-for-profit Organizations | 117 | 9.2% |
| Local Government Employees | 189 | 14.8% |
| State Government Employees | 0 | 0.0% |
| Federal Government Employees | 0 | 0.0% |
| Unpaid Family Workers | 0 | 0.0% |
| Total | 1,273 | 100.0% |
Employment Status by Age in Union City
According to the labor force statistics for Union City, out of the total population over 16 years of age (2,525), 56.9% or 1,437 individuals are in the labor force, with 10.0% or 144 of them unemployed. The age group with the highest labor force participation rate is 20 to 24 years, with 100.0% or 144 individuals in the labor force. Within the labor force, the 45 to 54 years age range has the highest percentage of unemployed individuals, with 23.1% or 54 of them being unemployed.
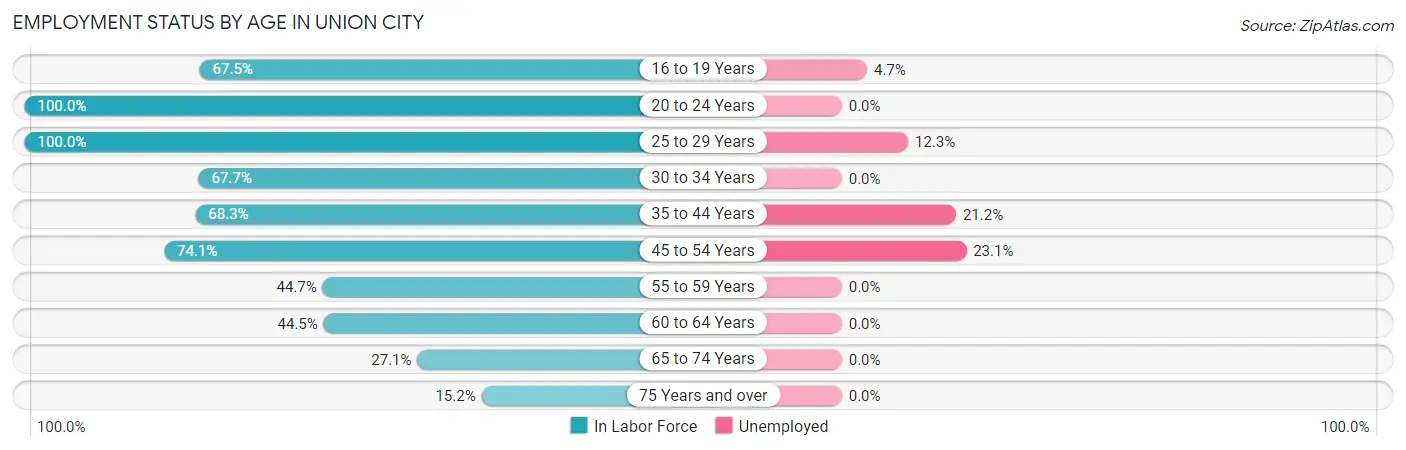
| Age Bracket | In Labor Force | Unemployed |
| 16 to 19 Years | 106 (67.5%) | 5 (4.7%) |
| 20 to 24 Years | 144 (100.0%) | 0 (0.0%) |
| 25 to 29 Years | 162 (100.0%) | 20 (12.3%) |
| 30 to 34 Years | 168 (67.7%) | 0 (0.0%) |
| 35 to 44 Years | 302 (68.3%) | 64 (21.2%) |
| 45 to 54 Years | 234 (74.1%) | 54 (23.1%) |
| 55 to 59 Years | 72 (44.7%) | 0 (0.0%) |
| 60 to 64 Years | 98 (44.5%) | 0 (0.0%) |
| 65 to 74 Years | 110 (27.1%) | 0 (0.0%) |
| 75 Years and over | 41 (15.2%) | 0 (0.0%) |
| Total | 1,437 (56.9%) | 144 (10.0%) |
Employment Status by Educational Attainment in Union City
According to labor force statistics for Union City, 66.9% of individuals (1,036) out of the total population between 25 and 64 years of age (1,549) are in the labor force, with 13.3% or 138 of them being unemployed. The group with the highest labor force participation rate are those with the educational attainment of bachelor's degree or higher, with 86.4% or 152 individuals in the labor force. Within the labor force, individuals with less than high school education have the highest percentage of unemployment, with 26.4% or 29 of them being unemployed.
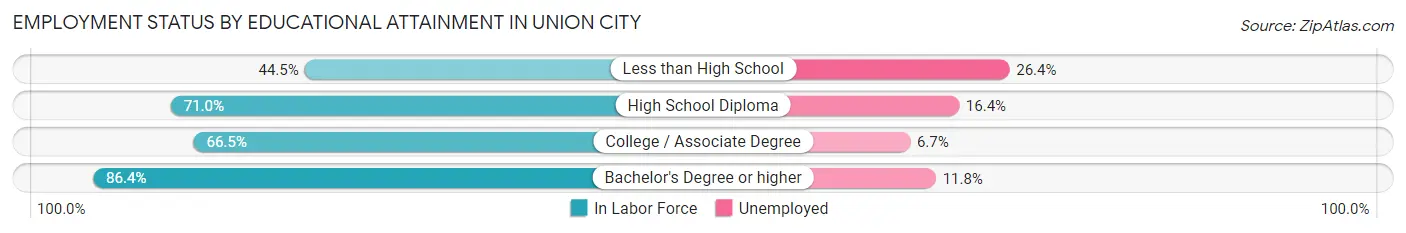
| Educational Attainment | In Labor Force | Unemployed |
| Less than High School | 110 (44.5%) | 65 (26.4%) |
| High School Diploma | 403 (71.0%) | 93 (16.4%) |
| College / Associate Degree | 371 (66.5%) | 37 (6.7%) |
| Bachelor's Degree or higher | 152 (86.4%) | 21 (11.8%) |
| Total | 1,036 (66.9%) | 206 (13.3%) |
Employment Occupations by Sex in Union City
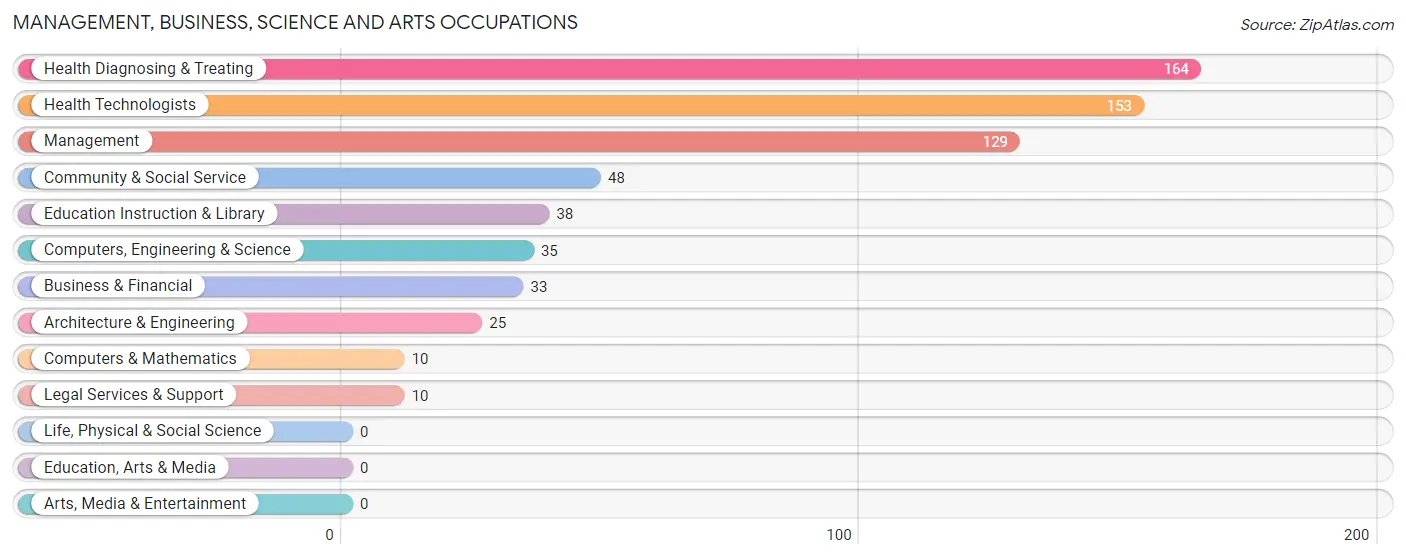
Management, Business, Science and Arts Occupations
The most common Management, Business, Science and Arts occupations in Union City are Health Diagnosing & Treating (164 | 12.7%), Health Technologists (153 | 11.8%), Management (129 | 10.0%), Community & Social Service (48 | 3.7%), and Education Instruction & Library (38 | 2.9%).
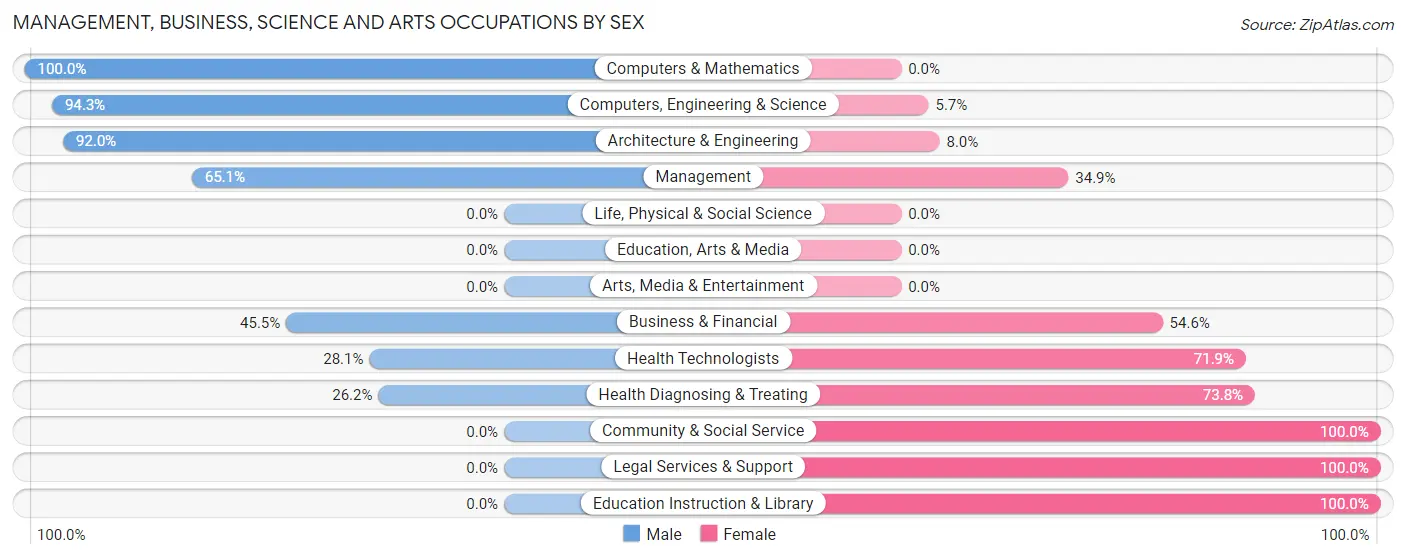
Management, Business, Science and Arts Occupations by Sex
Within the Management, Business, Science and Arts occupations in Union City, the most male-oriented occupations are Computers & Mathematics (100.0%), Computers, Engineering & Science (94.3%), and Architecture & Engineering (92.0%), while the most female-oriented occupations are Community & Social Service (100.0%), Legal Services & Support (100.0%), and Education Instruction & Library (100.0%).
| Occupation | Male | Female |
| Management | 84 (65.1%) | 45 (34.9%) |
| Business & Financial | 15 (45.5%) | 18 (54.5%) |
| Computers, Engineering & Science | 33 (94.3%) | 2 (5.7%) |
| Computers & Mathematics | 10 (100.0%) | 0 (0.0%) |
| Architecture & Engineering | 23 (92.0%) | 2 (8.0%) |
| Life, Physical & Social Science | 0 (0.0%) | 0 (0.0%) |
| Community & Social Service | 0 (0.0%) | 48 (100.0%) |
| Education, Arts & Media | 0 (0.0%) | 0 (0.0%) |
| Legal Services & Support | 0 (0.0%) | 10 (100.0%) |
| Education Instruction & Library | 0 (0.0%) | 38 (100.0%) |
| Arts, Media & Entertainment | 0 (0.0%) | 0 (0.0%) |
| Health Diagnosing & Treating | 43 (26.2%) | 121 (73.8%) |
| Health Technologists | 43 (28.1%) | 110 (71.9%) |
| Total (Category) | 175 (42.8%) | 234 (57.2%) |
| Total (Overall) | 784 (60.6%) | 510 (39.4%) |
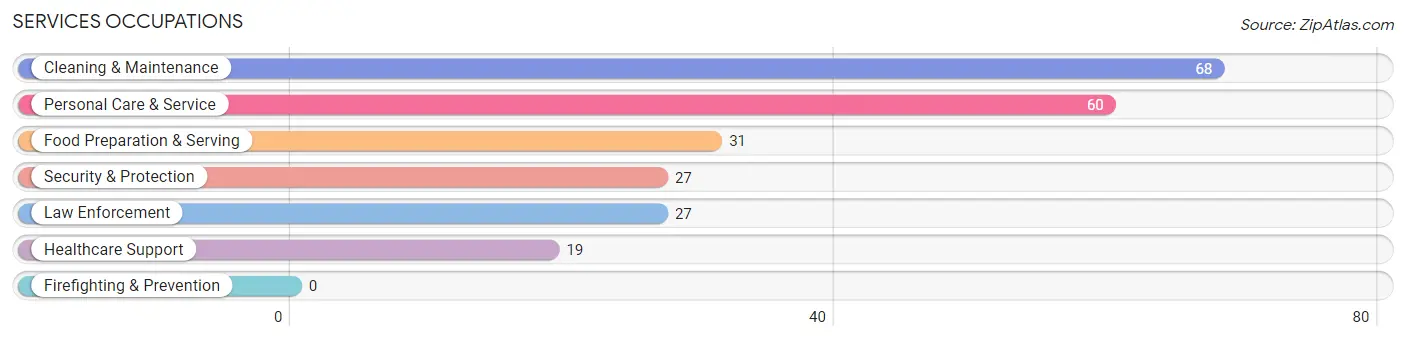
Services Occupations
The most common Services occupations in Union City are Cleaning & Maintenance (68 | 5.3%), Personal Care & Service (60 | 4.6%), Food Preparation & Serving (31 | 2.4%), Security & Protection (27 | 2.1%), and Law Enforcement (27 | 2.1%).
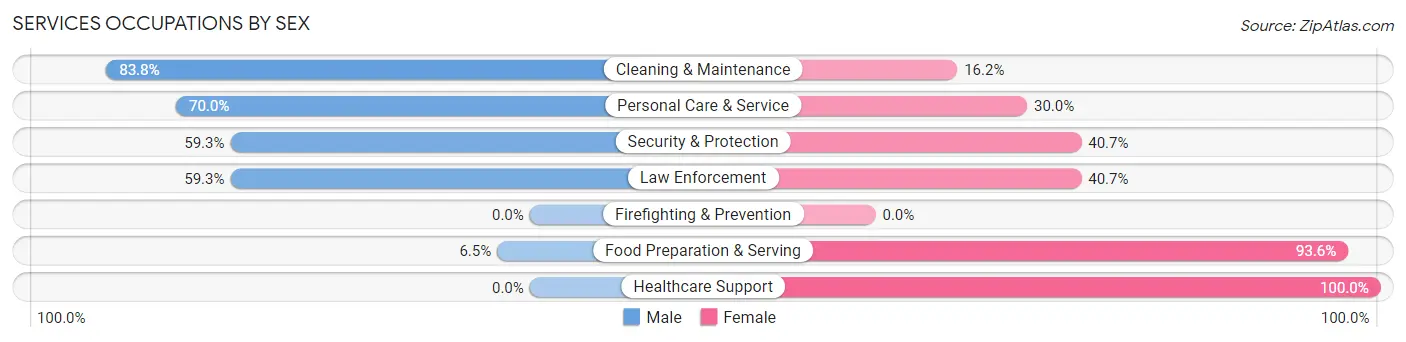
Services Occupations by Sex
Within the Services occupations in Union City, the most male-oriented occupations are Cleaning & Maintenance (83.8%), Personal Care & Service (70.0%), and Security & Protection (59.3%), while the most female-oriented occupations are Healthcare Support (100.0%), Food Preparation & Serving (93.5%), and Security & Protection (40.7%).
| Occupation | Male | Female |
| Healthcare Support | 0 (0.0%) | 19 (100.0%) |
| Security & Protection | 16 (59.3%) | 11 (40.7%) |
| Firefighting & Prevention | 0 (0.0%) | 0 (0.0%) |
| Law Enforcement | 16 (59.3%) | 11 (40.7%) |
| Food Preparation & Serving | 2 (6.5%) | 29 (93.5%) |
| Cleaning & Maintenance | 57 (83.8%) | 11 (16.2%) |
| Personal Care & Service | 42 (70.0%) | 18 (30.0%) |
| Total (Category) | 117 (57.1%) | 88 (42.9%) |
| Total (Overall) | 784 (60.6%) | 510 (39.4%) |
Sales and Office Occupations
The most common Sales and Office occupations in Union City are Sales & Related (82 | 6.3%), and Office & Administration (49 | 3.8%).
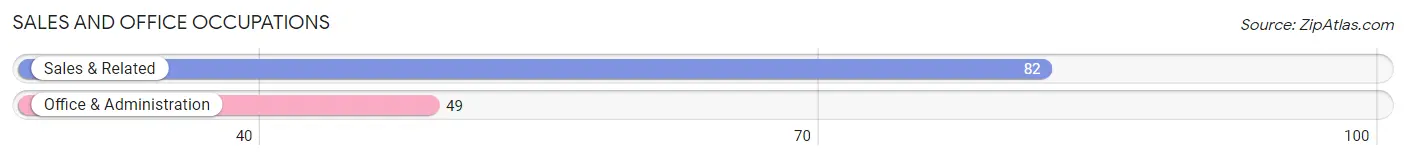
Sales and Office Occupations by Sex
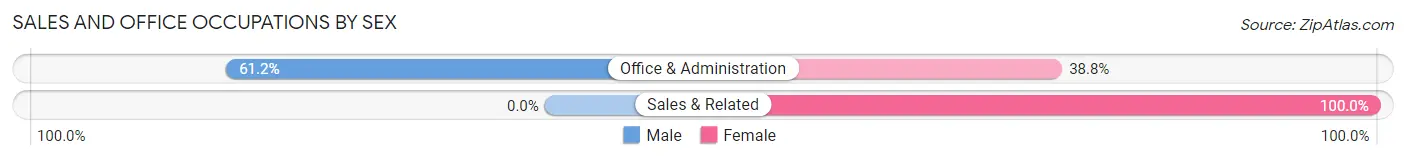
| Occupation | Male | Female |
| Sales & Related | 0 (0.0%) | 82 (100.0%) |
| Office & Administration | 30 (61.2%) | 19 (38.8%) |
| Total (Category) | 30 (22.9%) | 101 (77.1%) |
| Total (Overall) | 784 (60.6%) | 510 (39.4%) |
Natural Resources, Construction and Maintenance Occupations
The most common Natural Resources, Construction and Maintenance occupations in Union City are Installation, Maintenance & Repair (54 | 4.2%), and Construction & Extraction (42 | 3.3%).
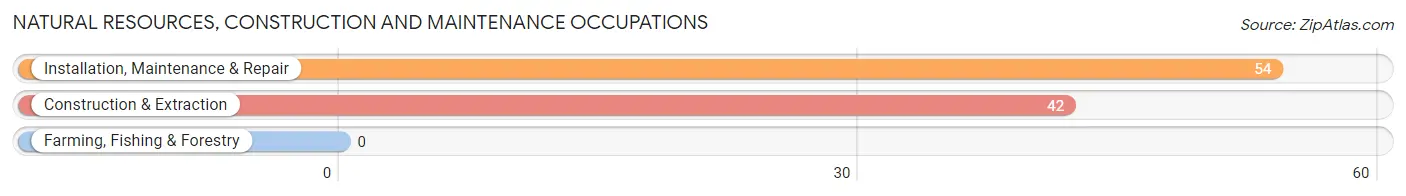
Natural Resources, Construction and Maintenance Occupations by Sex
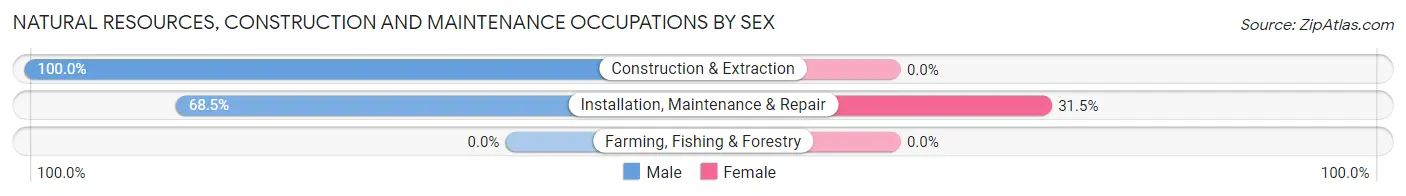
| Occupation | Male | Female |
| Farming, Fishing & Forestry | 0 (0.0%) | 0 (0.0%) |
| Construction & Extraction | 42 (100.0%) | 0 (0.0%) |
| Installation, Maintenance & Repair | 37 (68.5%) | 17 (31.5%) |
| Total (Category) | 79 (82.3%) | 17 (17.7%) |
| Total (Overall) | 784 (60.6%) | 510 (39.4%) |
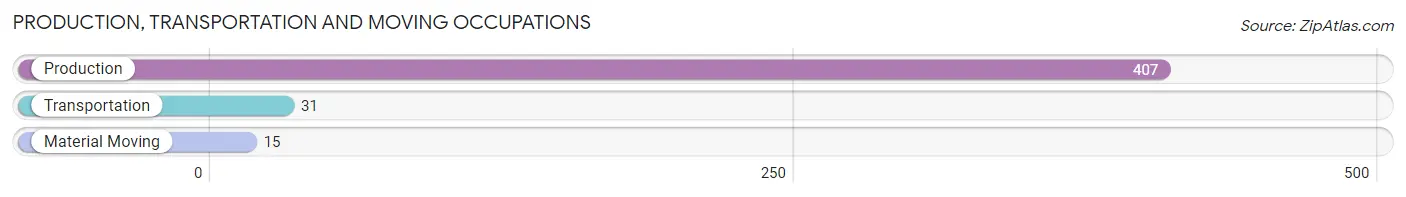
Production, Transportation and Moving Occupations
The most common Production, Transportation and Moving occupations in Union City are Production (407 | 31.5%), Transportation (31 | 2.4%), and Material Moving (15 | 1.2%).
Production, Transportation and Moving Occupations by Sex
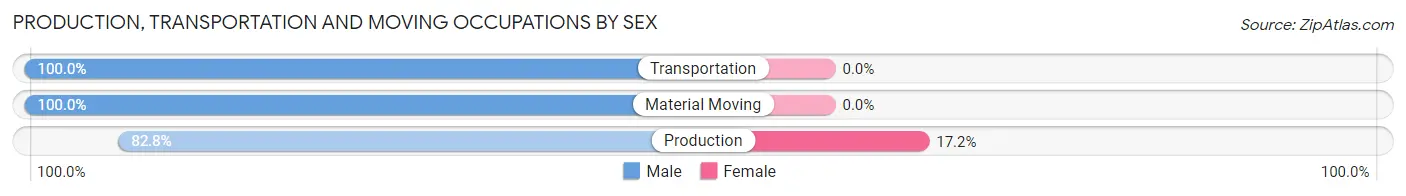
| Occupation | Male | Female |
| Production | 337 (82.8%) | 70 (17.2%) |
| Transportation | 31 (100.0%) | 0 (0.0%) |
| Material Moving | 15 (100.0%) | 0 (0.0%) |
| Total (Category) | 383 (84.6%) | 70 (15.4%) |
| Total (Overall) | 784 (60.6%) | 510 (39.4%) |
Employment Industries by Sex in Union City
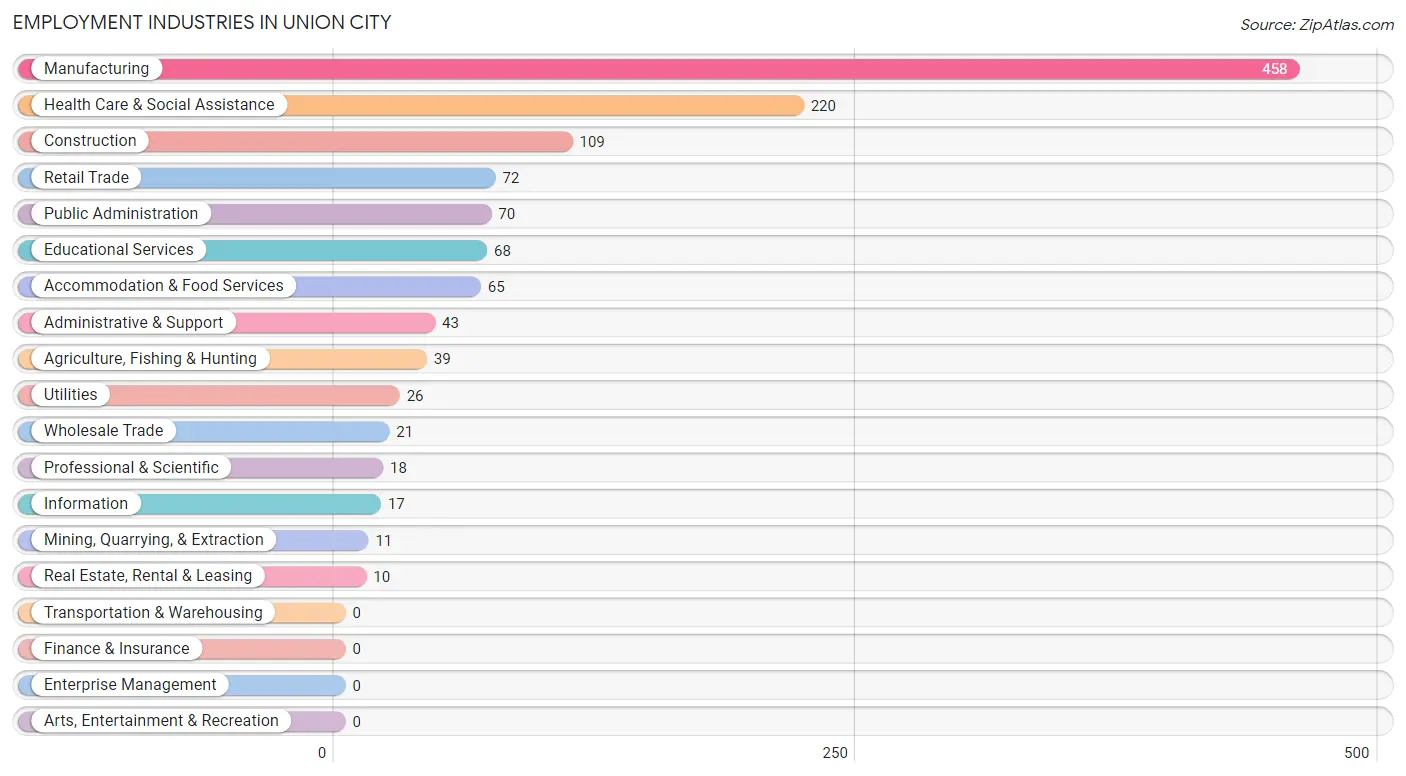
Employment Industries in Union City
The major employment industries in Union City include Manufacturing (458 | 35.4%), Health Care & Social Assistance (220 | 17.0%), Construction (109 | 8.4%), Retail Trade (72 | 5.6%), and Public Administration (70 | 5.4%).
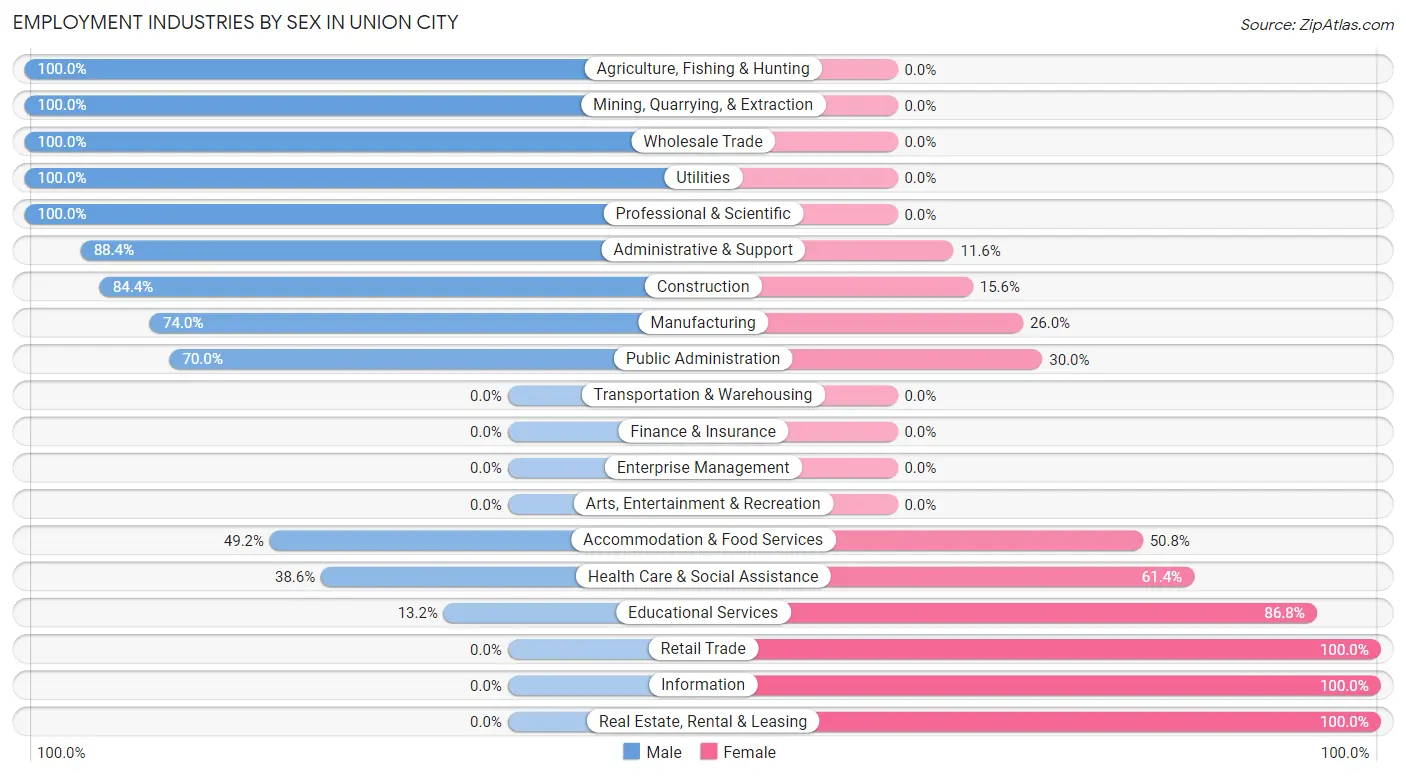
Employment Industries by Sex in Union City
The Union City industries that see more men than women are Agriculture, Fishing & Hunting (100.0%), Mining, Quarrying, & Extraction (100.0%), and Wholesale Trade (100.0%), whereas the industries that tend to have a higher number of women are Retail Trade (100.0%), Information (100.0%), and Real Estate, Rental & Leasing (100.0%).
| Industry | Male | Female |
| Agriculture, Fishing & Hunting | 39 (100.0%) | 0 (0.0%) |
| Mining, Quarrying, & Extraction | 11 (100.0%) | 0 (0.0%) |
| Construction | 92 (84.4%) | 17 (15.6%) |
| Manufacturing | 339 (74.0%) | 119 (26.0%) |
| Wholesale Trade | 21 (100.0%) | 0 (0.0%) |
| Retail Trade | 0 (0.0%) | 72 (100.0%) |
| Transportation & Warehousing | 0 (0.0%) | 0 (0.0%) |
| Utilities | 26 (100.0%) | 0 (0.0%) |
| Information | 0 (0.0%) | 17 (100.0%) |
| Finance & Insurance | 0 (0.0%) | 0 (0.0%) |
| Real Estate, Rental & Leasing | 0 (0.0%) | 10 (100.0%) |
| Professional & Scientific | 18 (100.0%) | 0 (0.0%) |
| Enterprise Management | 0 (0.0%) | 0 (0.0%) |
| Administrative & Support | 38 (88.4%) | 5 (11.6%) |
| Educational Services | 9 (13.2%) | 59 (86.8%) |
| Health Care & Social Assistance | 85 (38.6%) | 135 (61.4%) |
| Arts, Entertainment & Recreation | 0 (0.0%) | 0 (0.0%) |
| Accommodation & Food Services | 32 (49.2%) | 33 (50.8%) |
| Public Administration | 49 (70.0%) | 21 (30.0%) |
| Total | 784 (60.6%) | 510 (39.4%) |
Education in Union City
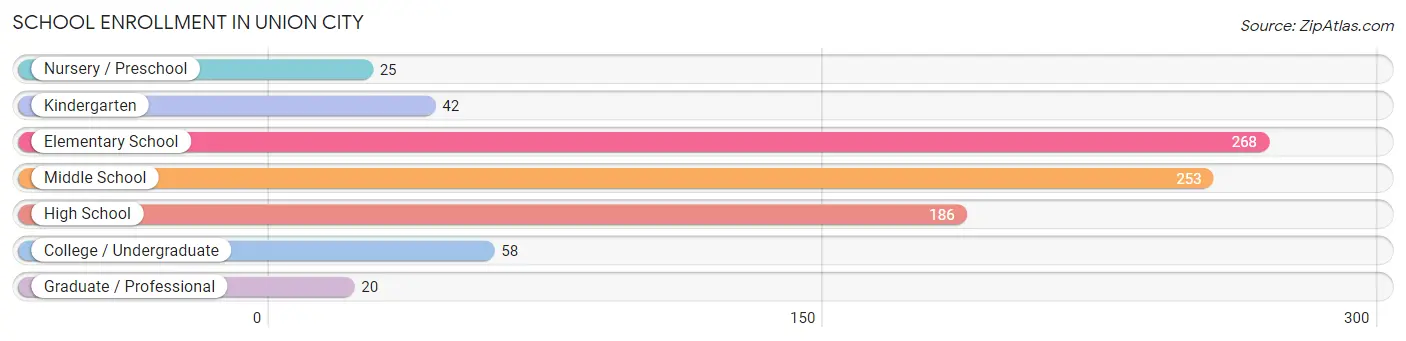
School Enrollment in Union City
The most common levels of schooling among the 852 students in Union City are elementary school (268 | 31.5%), middle school (253 | 29.7%), and high school (186 | 21.8%).
| School Level | # Students | % Students |
| Nursery / Preschool | 25 | 2.9% |
| Kindergarten | 42 | 4.9% |
| Elementary School | 268 | 31.5% |
| Middle School | 253 | 29.7% |
| High School | 186 | 21.8% |
| College / Undergraduate | 58 | 6.8% |
| Graduate / Professional | 20 | 2.4% |
| Total | 852 | 100.0% |
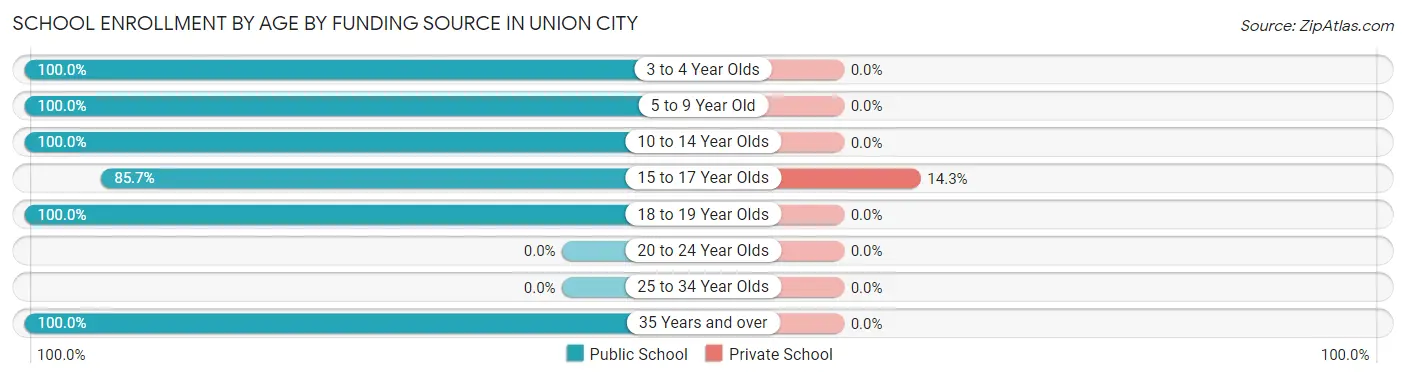
School Enrollment by Age by Funding Source in Union City
Out of a total of 852 students who are enrolled in schools in Union City, 14 (1.6%) attend a private institution, while the remaining 838 (98.4%) are enrolled in public schools. The age group of 15 to 17 year olds has the highest likelihood of being enrolled in private schools, with 14 (14.3% in the age bracket) enrolled. Conversely, the age group of 3 to 4 year olds has the lowest likelihood of being enrolled in a private school, with 25 (100.0% in the age bracket) attending a public institution.
| Age Bracket | Public School | Private School |
| 3 to 4 Year Olds | 25 (100.0%) | 0 (0.0%) |
| 5 to 9 Year Old | 256 (100.0%) | 0 (0.0%) |
| 10 to 14 Year Olds | 326 (100.0%) | 0 (0.0%) |
| 15 to 17 Year Olds | 84 (85.7%) | 14 (14.3%) |
| 18 to 19 Year Olds | 92 (100.0%) | 0 (0.0%) |
| 20 to 24 Year Olds | 0 (0.0%) | 0 (0.0%) |
| 25 to 34 Year Olds | 0 (0.0%) | 0 (0.0%) |
| 35 Years and over | 55 (100.0%) | 0 (0.0%) |
| Total | 838 (98.4%) | 14 (1.6%) |
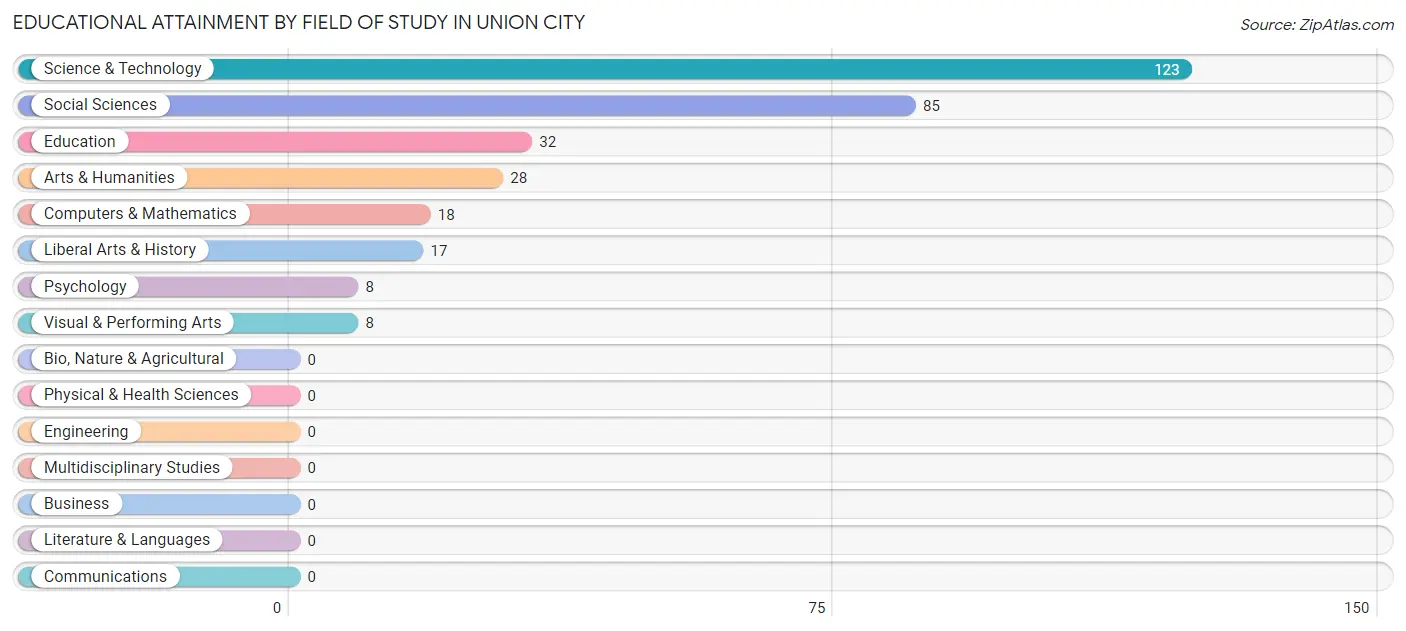
Educational Attainment by Field of Study in Union City
Science & technology (123 | 38.6%), social sciences (85 | 26.7%), education (32 | 10.0%), arts & humanities (28 | 8.8%), and computers & mathematics (18 | 5.6%) are the most common fields of study among 319 individuals in Union City who have obtained a bachelor's degree or higher.
| Field of Study | # Graduates | % Graduates |
| Computers & Mathematics | 18 | 5.6% |
| Bio, Nature & Agricultural | 0 | 0.0% |
| Physical & Health Sciences | 0 | 0.0% |
| Psychology | 8 | 2.5% |
| Social Sciences | 85 | 26.7% |
| Engineering | 0 | 0.0% |
| Multidisciplinary Studies | 0 | 0.0% |
| Science & Technology | 123 | 38.6% |
| Business | 0 | 0.0% |
| Education | 32 | 10.0% |
| Literature & Languages | 0 | 0.0% |
| Liberal Arts & History | 17 | 5.3% |
| Visual & Performing Arts | 8 | 2.5% |
| Communications | 0 | 0.0% |
| Arts & Humanities | 28 | 8.8% |
| Total | 319 | 100.0% |
Transportation & Commute in Union City
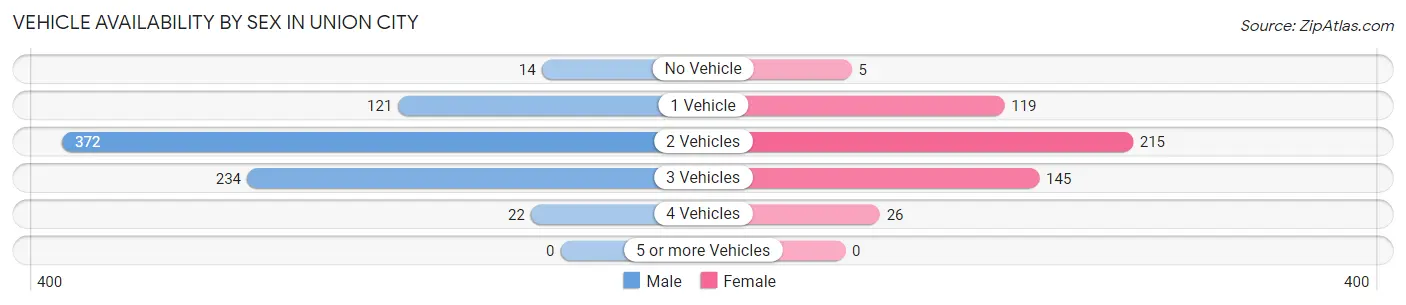
Vehicle Availability by Sex in Union City
The most prevalent vehicle ownership categories in Union City are males with 2 vehicles (372, accounting for 48.7%) and females with 2 vehicles (215, making up 72.9%).
| Vehicles Available | Male | Female |
| No Vehicle | 14 (1.8%) | 5 (1.0%) |
| 1 Vehicle | 121 (15.9%) | 119 (23.3%) |
| 2 Vehicles | 372 (48.7%) | 215 (42.2%) |
| 3 Vehicles | 234 (30.7%) | 145 (28.4%) |
| 4 Vehicles | 22 (2.9%) | 26 (5.1%) |
| 5 or more Vehicles | 0 (0.0%) | 0 (0.0%) |
| Total | 763 (100.0%) | 510 (100.0%) |
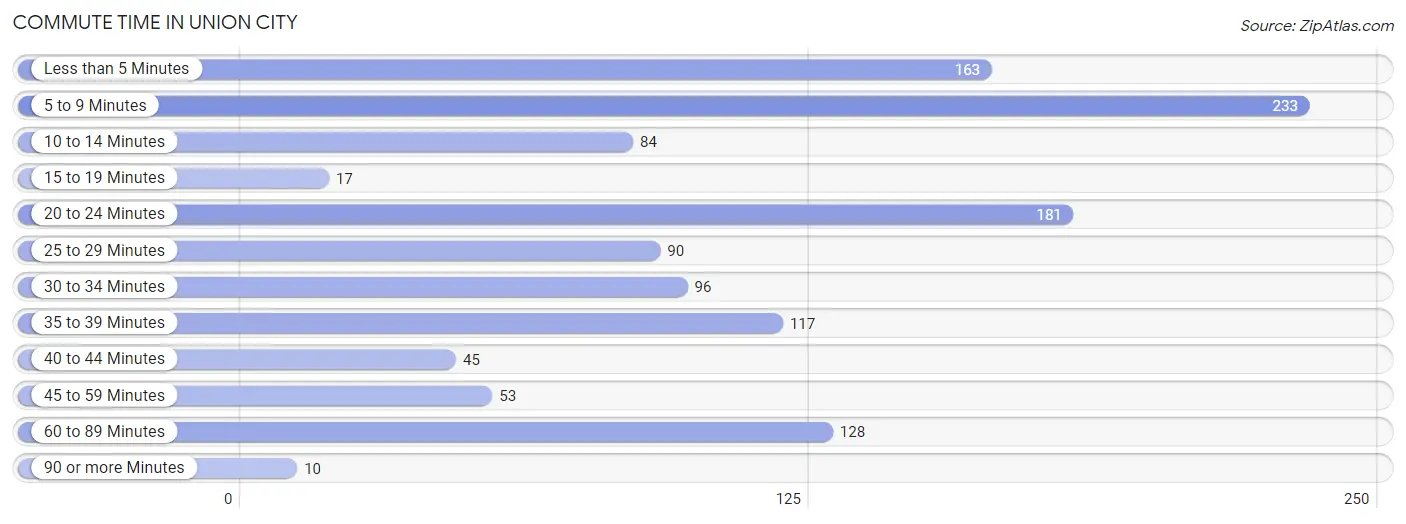
Commute Time in Union City
The most frequently occuring commute durations in Union City are 5 to 9 minutes (233 commuters, 19.2%), 20 to 24 minutes (181 commuters, 14.9%), and less than 5 minutes (163 commuters, 13.4%).
| Commute Time | # Commuters | % Commuters |
| Less than 5 Minutes | 163 | 13.4% |
| 5 to 9 Minutes | 233 | 19.2% |
| 10 to 14 Minutes | 84 | 6.9% |
| 15 to 19 Minutes | 17 | 1.4% |
| 20 to 24 Minutes | 181 | 14.9% |
| 25 to 29 Minutes | 90 | 7.4% |
| 30 to 34 Minutes | 96 | 7.9% |
| 35 to 39 Minutes | 117 | 9.6% |
| 40 to 44 Minutes | 45 | 3.7% |
| 45 to 59 Minutes | 53 | 4.3% |
| 60 to 89 Minutes | 128 | 10.5% |
| 90 or more Minutes | 10 | 0.8% |
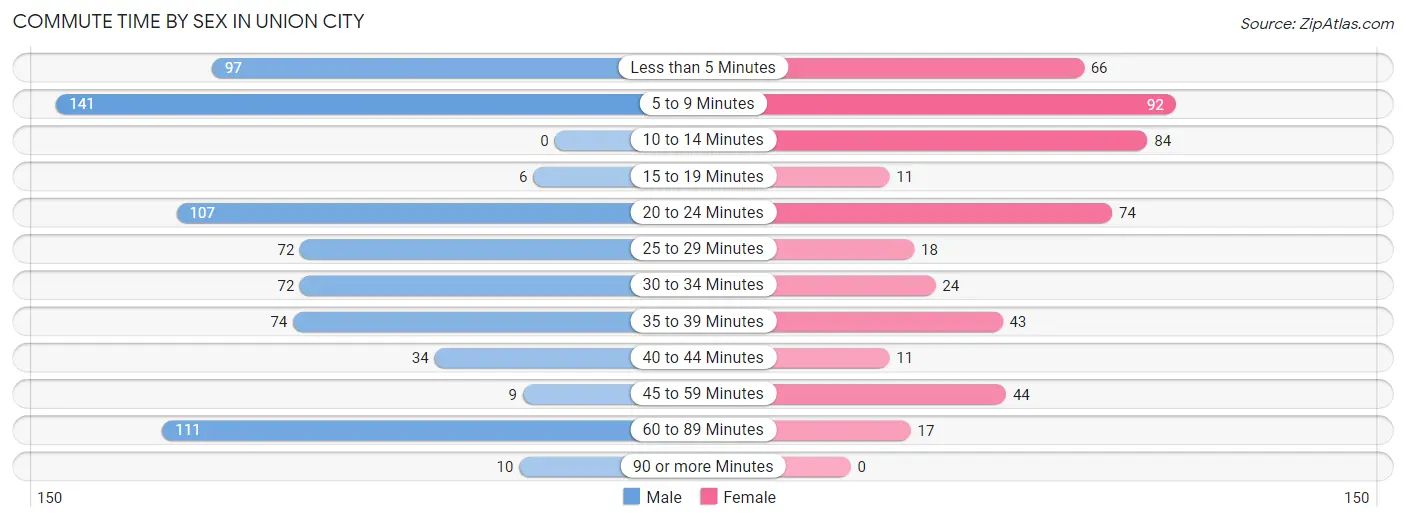
Commute Time by Sex in Union City
The most common commute times in Union City are 5 to 9 minutes (141 commuters, 19.2%) for males and 5 to 9 minutes (92 commuters, 19.0%) for females.
| Commute Time | Male | Female |
| Less than 5 Minutes | 97 (13.2%) | 66 (13.6%) |
| 5 to 9 Minutes | 141 (19.2%) | 92 (19.0%) |
| 10 to 14 Minutes | 0 (0.0%) | 84 (17.4%) |
| 15 to 19 Minutes | 6 (0.8%) | 11 (2.3%) |
| 20 to 24 Minutes | 107 (14.6%) | 74 (15.3%) |
| 25 to 29 Minutes | 72 (9.8%) | 18 (3.7%) |
| 30 to 34 Minutes | 72 (9.8%) | 24 (5.0%) |
| 35 to 39 Minutes | 74 (10.1%) | 43 (8.9%) |
| 40 to 44 Minutes | 34 (4.6%) | 11 (2.3%) |
| 45 to 59 Minutes | 9 (1.2%) | 44 (9.1%) |
| 60 to 89 Minutes | 111 (15.1%) | 17 (3.5%) |
| 90 or more Minutes | 10 (1.4%) | 0 (0.0%) |
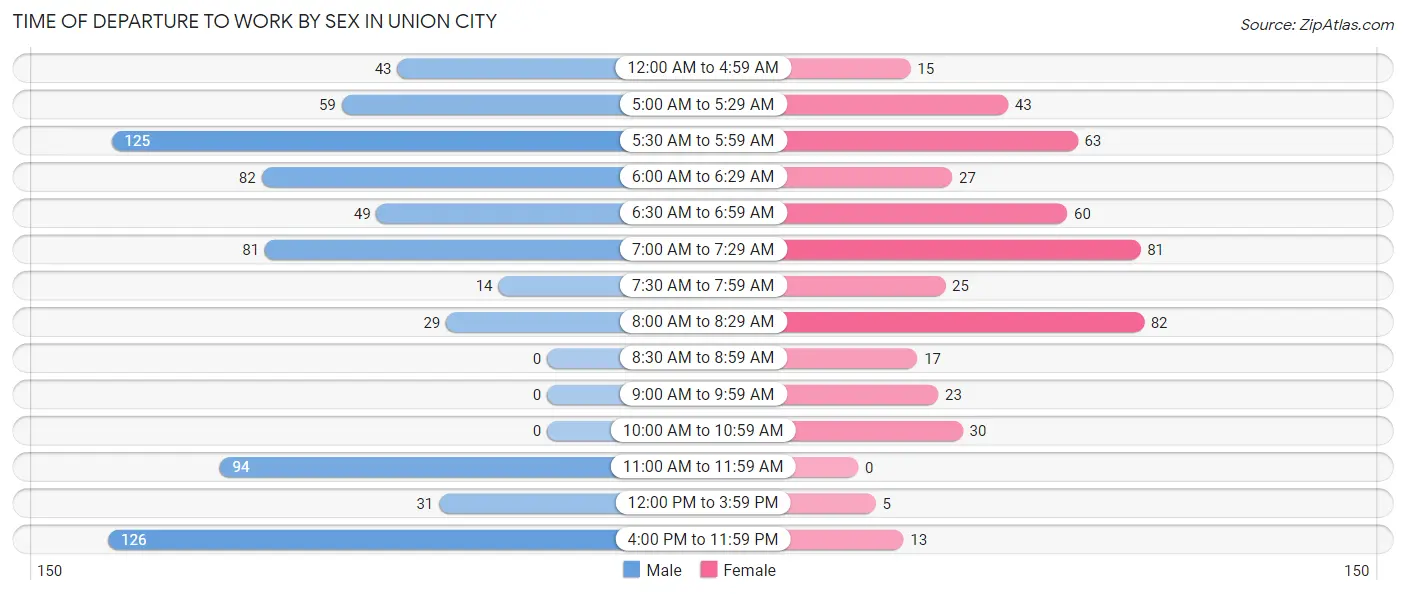
Time of Departure to Work by Sex in Union City
The most frequent times of departure to work in Union City are 4:00 PM to 11:59 PM (126, 17.2%) for males and 8:00 AM to 8:29 AM (82, 16.9%) for females.
| Time of Departure | Male | Female |
| 12:00 AM to 4:59 AM | 43 (5.9%) | 15 (3.1%) |
| 5:00 AM to 5:29 AM | 59 (8.1%) | 43 (8.9%) |
| 5:30 AM to 5:59 AM | 125 (17.1%) | 63 (13.0%) |
| 6:00 AM to 6:29 AM | 82 (11.2%) | 27 (5.6%) |
| 6:30 AM to 6:59 AM | 49 (6.7%) | 60 (12.4%) |
| 7:00 AM to 7:29 AM | 81 (11.1%) | 81 (16.7%) |
| 7:30 AM to 7:59 AM | 14 (1.9%) | 25 (5.2%) |
| 8:00 AM to 8:29 AM | 29 (4.0%) | 82 (16.9%) |
| 8:30 AM to 8:59 AM | 0 (0.0%) | 17 (3.5%) |
| 9:00 AM to 9:59 AM | 0 (0.0%) | 23 (4.8%) |
| 10:00 AM to 10:59 AM | 0 (0.0%) | 30 (6.2%) |
| 11:00 AM to 11:59 AM | 94 (12.8%) | 0 (0.0%) |
| 12:00 PM to 3:59 PM | 31 (4.2%) | 5 (1.0%) |
| 4:00 PM to 11:59 PM | 126 (17.2%) | 13 (2.7%) |
| Total | 733 (100.0%) | 484 (100.0%) |
Housing Occupancy in Union City
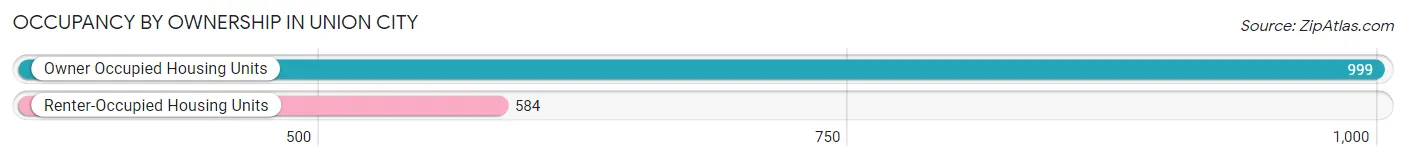
Occupancy by Ownership in Union City
Of the total 1,583 dwellings in Union City, owner-occupied units account for 999 (63.1%), while renter-occupied units make up 584 (36.9%).
| Occupancy | # Housing Units | % Housing Units |
| Owner Occupied Housing Units | 999 | 63.1% |
| Renter-Occupied Housing Units | 584 | 36.9% |
| Total Occupied Housing Units | 1,583 | 100.0% |
Occupancy by Household Size in Union City
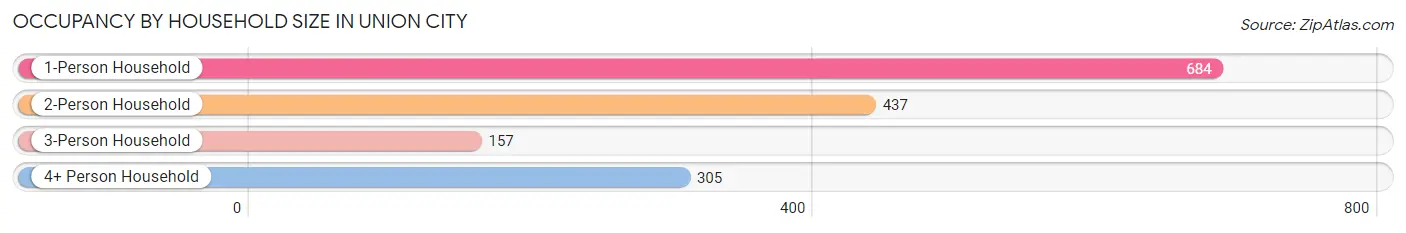
| Household Size | # Housing Units | % Housing Units |
| 1-Person Household | 684 | 43.2% |
| 2-Person Household | 437 | 27.6% |
| 3-Person Household | 157 | 9.9% |
| 4+ Person Household | 305 | 19.3% |
| Total Housing Units | 1,583 | 100.0% |
Occupancy by Ownership by Household Size in Union City
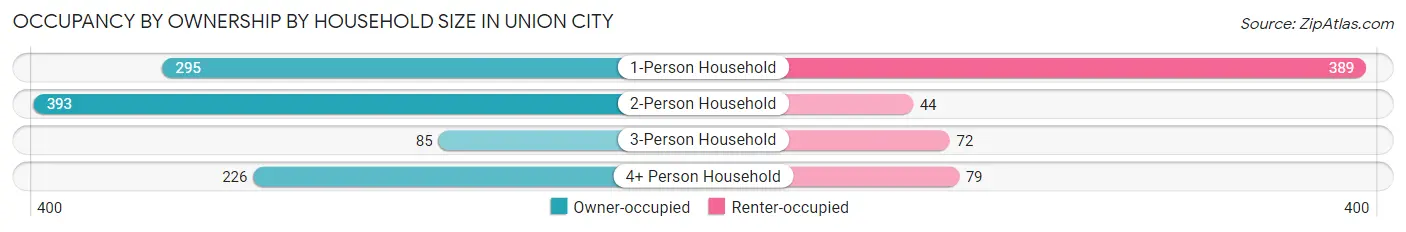
| Household Size | Owner-occupied | Renter-occupied |
| 1-Person Household | 295 (43.1%) | 389 (56.9%) |
| 2-Person Household | 393 (89.9%) | 44 (10.1%) |
| 3-Person Household | 85 (54.1%) | 72 (45.9%) |
| 4+ Person Household | 226 (74.1%) | 79 (25.9%) |
| Total Housing Units | 999 (63.1%) | 584 (36.9%) |
Occupancy by Educational Attainment in Union City
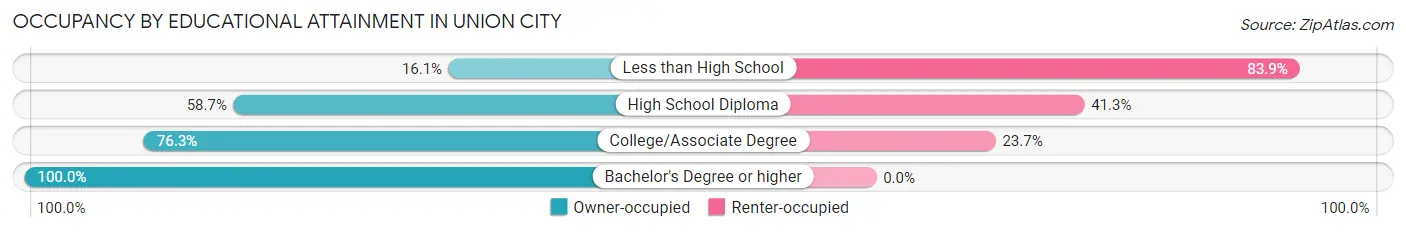
| Household Size | Owner-occupied | Renter-occupied |
| Less than High School | 36 (16.1%) | 188 (83.9%) |
| High School Diploma | 407 (58.7%) | 286 (41.3%) |
| College/Associate Degree | 355 (76.3%) | 110 (23.7%) |
| Bachelor's Degree or higher | 201 (100.0%) | 0 (0.0%) |
Occupancy by Age of Householder in Union City
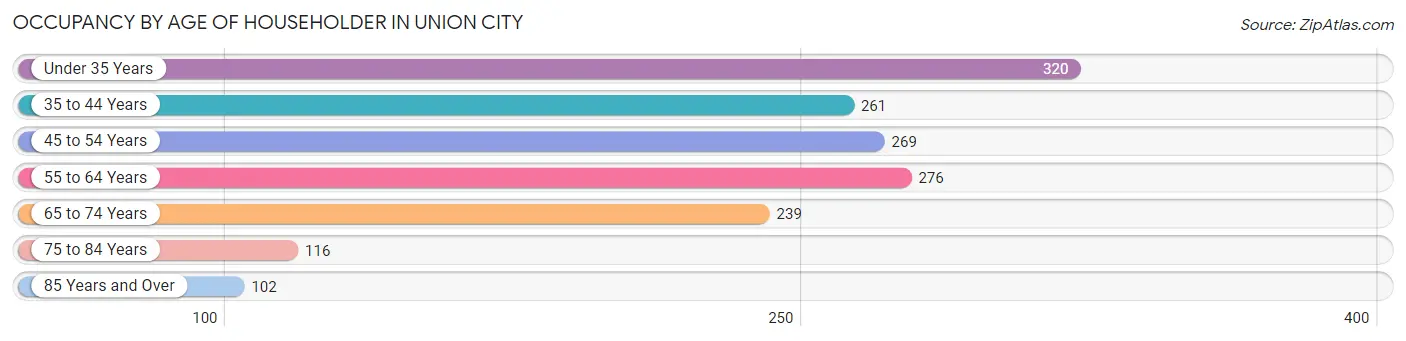
| Age Bracket | # Households | % Households |
| Under 35 Years | 320 | 20.2% |
| 35 to 44 Years | 261 | 16.5% |
| 45 to 54 Years | 269 | 17.0% |
| 55 to 64 Years | 276 | 17.4% |
| 65 to 74 Years | 239 | 15.1% |
| 75 to 84 Years | 116 | 7.3% |
| 85 Years and Over | 102 | 6.4% |
| Total | 1,583 | 100.0% |
Housing Finances in Union City
Median Income by Occupancy in Union City
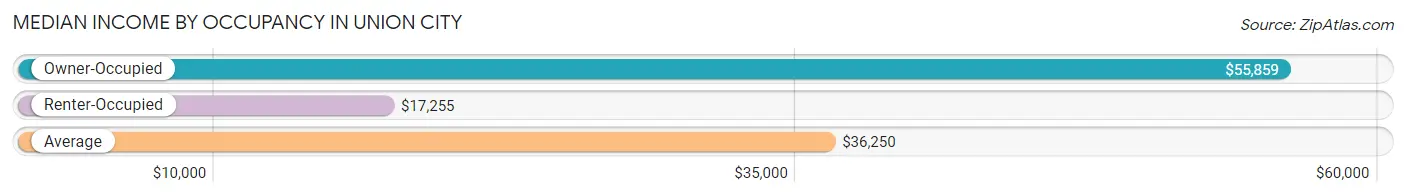
| Occupancy Type | # Households | Median Income |
| Owner-Occupied | 999 (63.1%) | $55,859 |
| Renter-Occupied | 584 (36.9%) | $17,255 |
| Average | 1,583 (100.0%) | $36,250 |
Occupancy by Householder Income Bracket in Union City
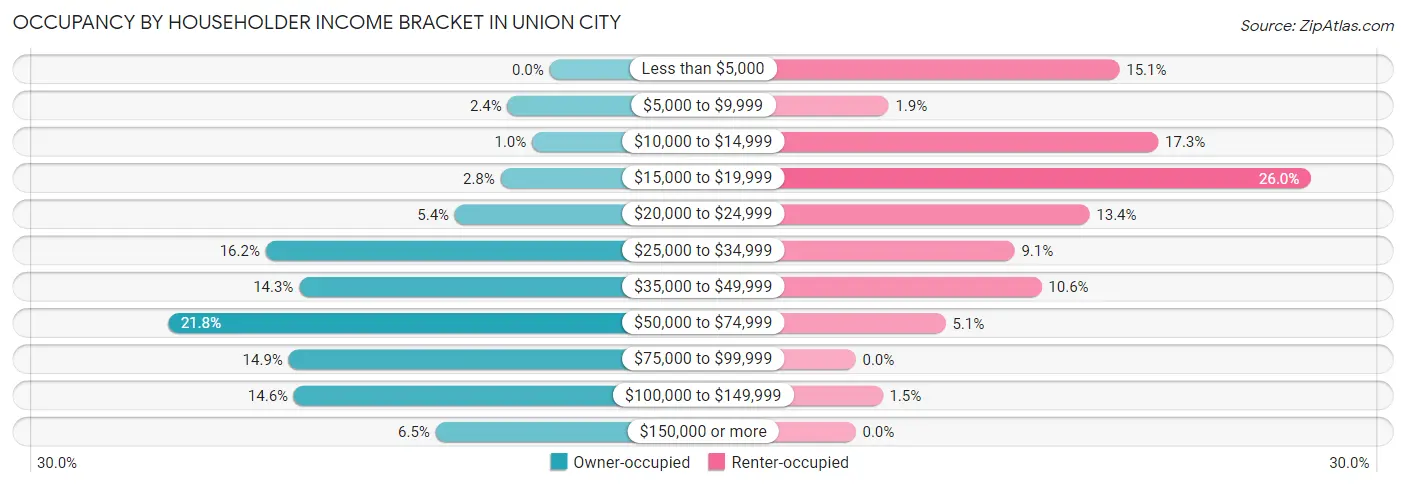
| Income Bracket | Owner-occupied | Renter-occupied |
| Less than $5,000 | 0 (0.0%) | 88 (15.1%) |
| $5,000 to $9,999 | 24 (2.4%) | 11 (1.9%) |
| $10,000 to $14,999 | 10 (1.0%) | 101 (17.3%) |
| $15,000 to $19,999 | 28 (2.8%) | 152 (26.0%) |
| $20,000 to $24,999 | 54 (5.4%) | 78 (13.4%) |
| $25,000 to $34,999 | 162 (16.2%) | 53 (9.1%) |
| $35,000 to $49,999 | 143 (14.3%) | 62 (10.6%) |
| $50,000 to $74,999 | 218 (21.8%) | 30 (5.1%) |
| $75,000 to $99,999 | 149 (14.9%) | 0 (0.0%) |
| $100,000 to $149,999 | 146 (14.6%) | 9 (1.5%) |
| $150,000 or more | 65 (6.5%) | 0 (0.0%) |
| Total | 999 (100.0%) | 584 (100.0%) |
Monthly Housing Cost Tiers in Union City
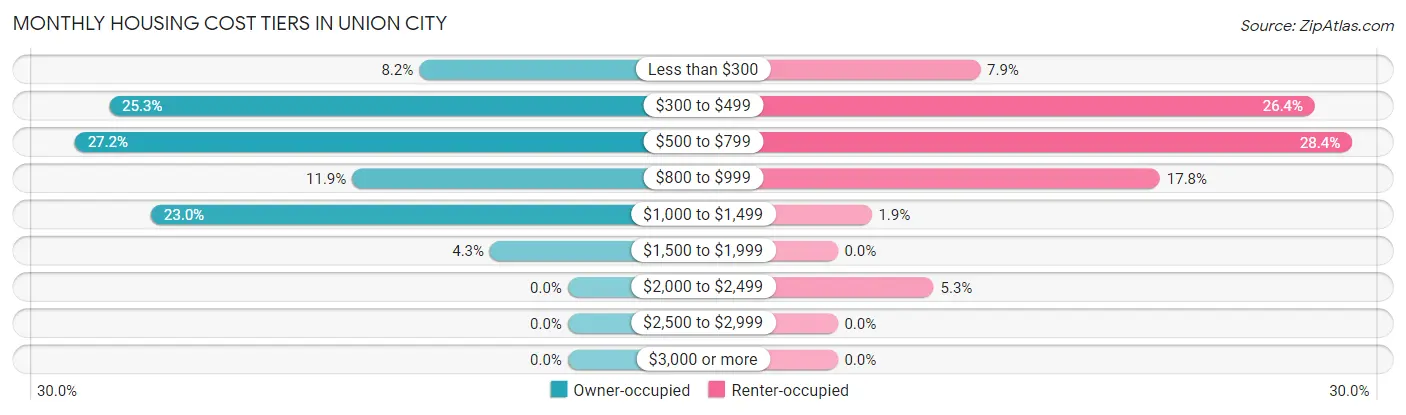
| Monthly Cost | Owner-occupied | Renter-occupied |
| Less than $300 | 82 (8.2%) | 46 (7.9%) |
| $300 to $499 | 253 (25.3%) | 154 (26.4%) |
| $500 to $799 | 272 (27.2%) | 166 (28.4%) |
| $800 to $999 | 119 (11.9%) | 104 (17.8%) |
| $1,000 to $1,499 | 230 (23.0%) | 11 (1.9%) |
| $1,500 to $1,999 | 43 (4.3%) | 0 (0.0%) |
| $2,000 to $2,499 | 0 (0.0%) | 31 (5.3%) |
| $2,500 to $2,999 | 0 (0.0%) | 0 (0.0%) |
| $3,000 or more | 0 (0.0%) | 0 (0.0%) |
| Total | 999 (100.0%) | 584 (100.0%) |
Physical Housing Characteristics in Union City
Housing Structures in Union City
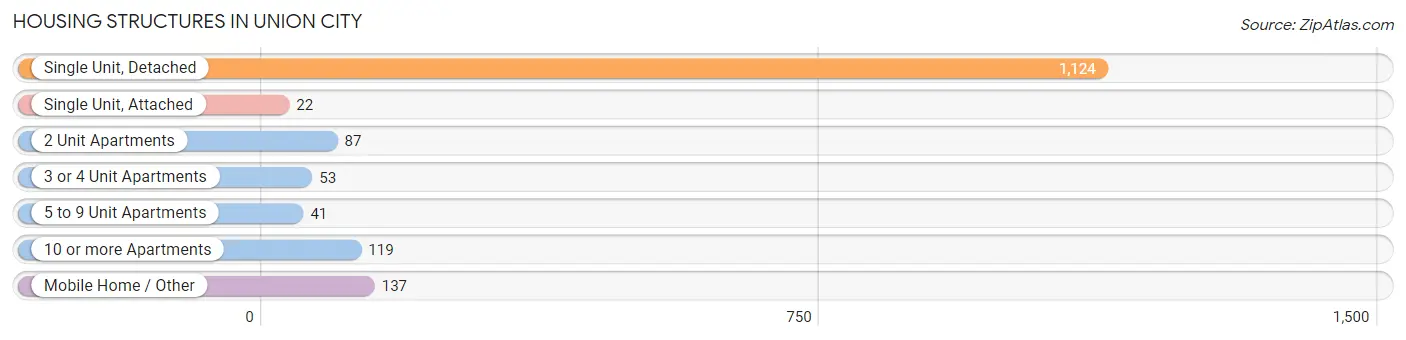
| Structure Type | # Housing Units | % Housing Units |
| Single Unit, Detached | 1,124 | 71.0% |
| Single Unit, Attached | 22 | 1.4% |
| 2 Unit Apartments | 87 | 5.5% |
| 3 or 4 Unit Apartments | 53 | 3.4% |
| 5 to 9 Unit Apartments | 41 | 2.6% |
| 10 or more Apartments | 119 | 7.5% |
| Mobile Home / Other | 137 | 8.6% |
| Total | 1,583 | 100.0% |
Housing Structures by Occupancy in Union City
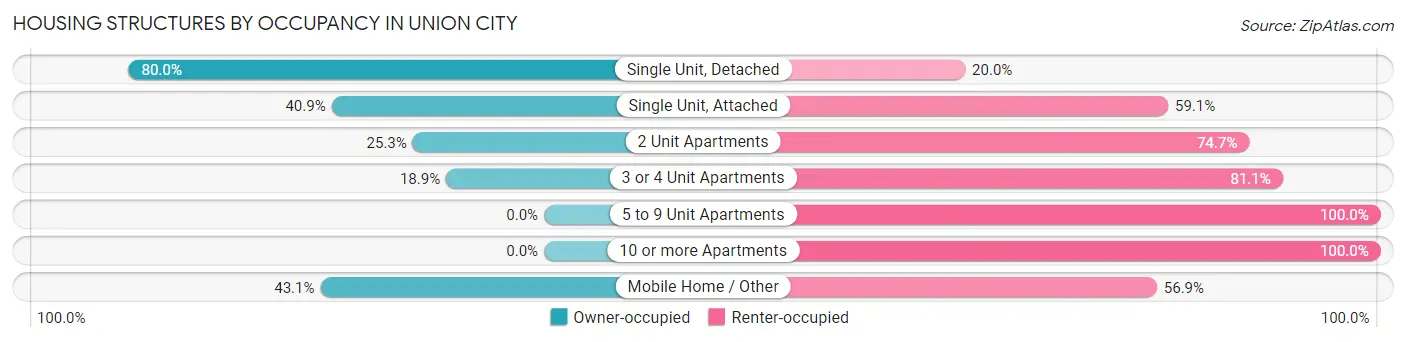
| Structure Type | Owner-occupied | Renter-occupied |
| Single Unit, Detached | 899 (80.0%) | 225 (20.0%) |
| Single Unit, Attached | 9 (40.9%) | 13 (59.1%) |
| 2 Unit Apartments | 22 (25.3%) | 65 (74.7%) |
| 3 or 4 Unit Apartments | 10 (18.9%) | 43 (81.1%) |
| 5 to 9 Unit Apartments | 0 (0.0%) | 41 (100.0%) |
| 10 or more Apartments | 0 (0.0%) | 119 (100.0%) |
| Mobile Home / Other | 59 (43.1%) | 78 (56.9%) |
| Total | 999 (63.1%) | 584 (36.9%) |
Housing Structures by Number of Rooms in Union City
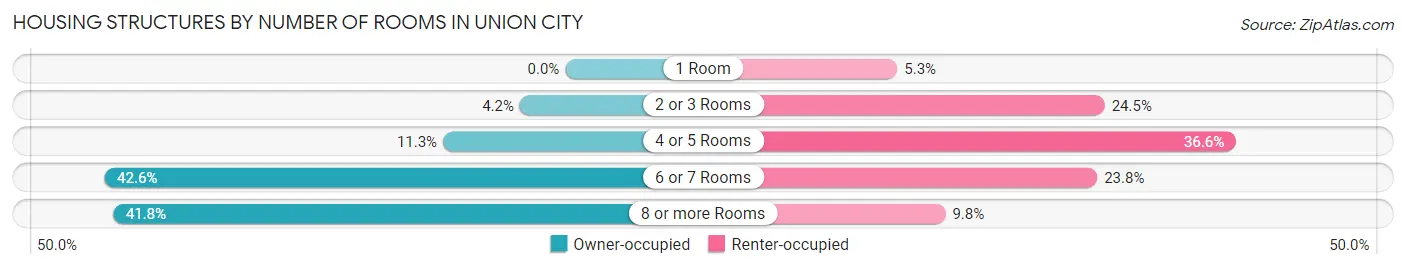
| Number of Rooms | Owner-occupied | Renter-occupied |
| 1 Room | 0 (0.0%) | 31 (5.3%) |
| 2 or 3 Rooms | 42 (4.2%) | 143 (24.5%) |
| 4 or 5 Rooms | 113 (11.3%) | 214 (36.6%) |
| 6 or 7 Rooms | 426 (42.6%) | 139 (23.8%) |
| 8 or more Rooms | 418 (41.8%) | 57 (9.8%) |
| Total | 999 (100.0%) | 584 (100.0%) |
Housing Structure by Heating Type in Union City
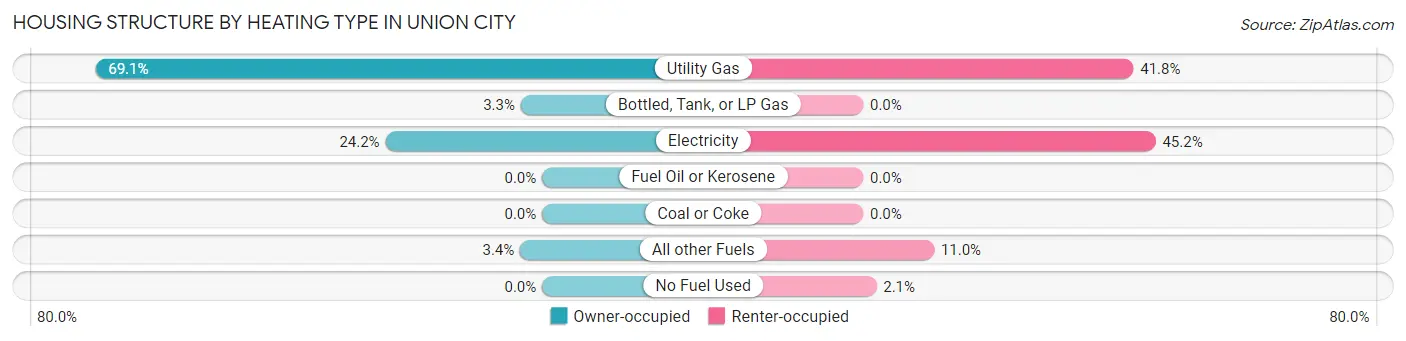
| Heating Type | Owner-occupied | Renter-occupied |
| Utility Gas | 690 (69.1%) | 244 (41.8%) |
| Bottled, Tank, or LP Gas | 33 (3.3%) | 0 (0.0%) |
| Electricity | 242 (24.2%) | 264 (45.2%) |
| Fuel Oil or Kerosene | 0 (0.0%) | 0 (0.0%) |
| Coal or Coke | 0 (0.0%) | 0 (0.0%) |
| All other Fuels | 34 (3.4%) | 64 (11.0%) |
| No Fuel Used | 0 (0.0%) | 12 (2.1%) |
| Total | 999 (100.0%) | 584 (100.0%) |
Household Vehicle Usage in Union City
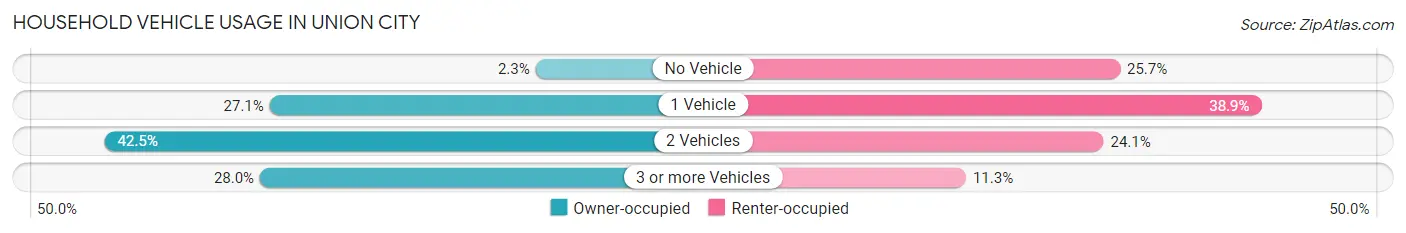
| Vehicles per Household | Owner-occupied | Renter-occupied |
| No Vehicle | 23 (2.3%) | 150 (25.7%) |
| 1 Vehicle | 271 (27.1%) | 227 (38.9%) |
| 2 Vehicles | 425 (42.5%) | 141 (24.1%) |
| 3 or more Vehicles | 280 (28.0%) | 66 (11.3%) |
| Total | 999 (100.0%) | 584 (100.0%) |
Real Estate & Mortgages in Union City
Real Estate and Mortgage Overview in Union City
| Characteristic | Without Mortgage | With Mortgage |
| Housing Units | 527 | 472 |
| Median Property Value | $72,800 | $86,000 |
| Median Household Income | $42,656 | $44 |
| Monthly Housing Costs | $450 | $0 |
| Real Estate Taxes | $649 | $16 |
Property Value by Mortgage Status in Union City
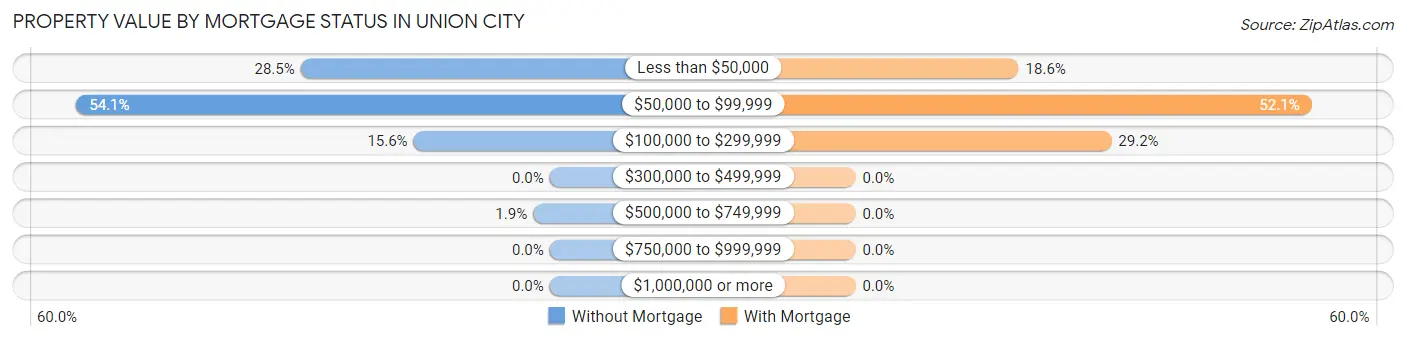
| Property Value | Without Mortgage | With Mortgage |
| Less than $50,000 | 150 (28.5%) | 88 (18.6%) |
| $50,000 to $99,999 | 285 (54.1%) | 246 (52.1%) |
| $100,000 to $299,999 | 82 (15.6%) | 138 (29.2%) |
| $300,000 to $499,999 | 0 (0.0%) | 0 (0.0%) |
| $500,000 to $749,999 | 10 (1.9%) | 0 (0.0%) |
| $750,000 to $999,999 | 0 (0.0%) | 0 (0.0%) |
| $1,000,000 or more | 0 (0.0%) | 0 (0.0%) |
| Total | 527 (100.0%) | 472 (100.0%) |
Household Income by Mortgage Status in Union City
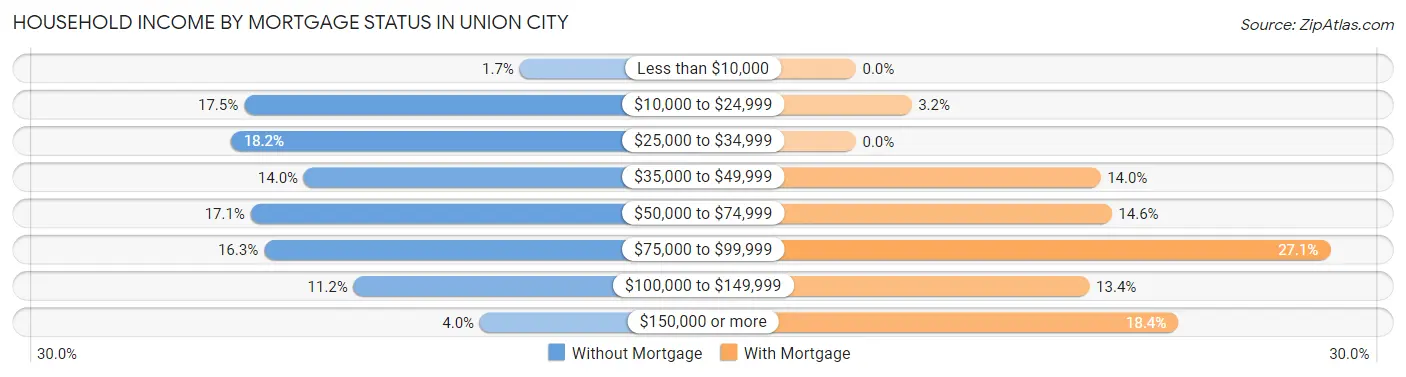
| Household Income | Without Mortgage | With Mortgage |
| Less than $10,000 | 9 (1.7%) | 0 (0.0%) |
| $10,000 to $24,999 | 92 (17.5%) | 15 (3.2%) |
| $25,000 to $34,999 | 96 (18.2%) | 0 (0.0%) |
| $35,000 to $49,999 | 74 (14.0%) | 66 (14.0%) |
| $50,000 to $74,999 | 90 (17.1%) | 69 (14.6%) |
| $75,000 to $99,999 | 86 (16.3%) | 128 (27.1%) |
| $100,000 to $149,999 | 59 (11.2%) | 63 (13.4%) |
| $150,000 or more | 21 (4.0%) | 87 (18.4%) |
| Total | 527 (100.0%) | 472 (100.0%) |
Property Value to Household Income Ratio in Union City
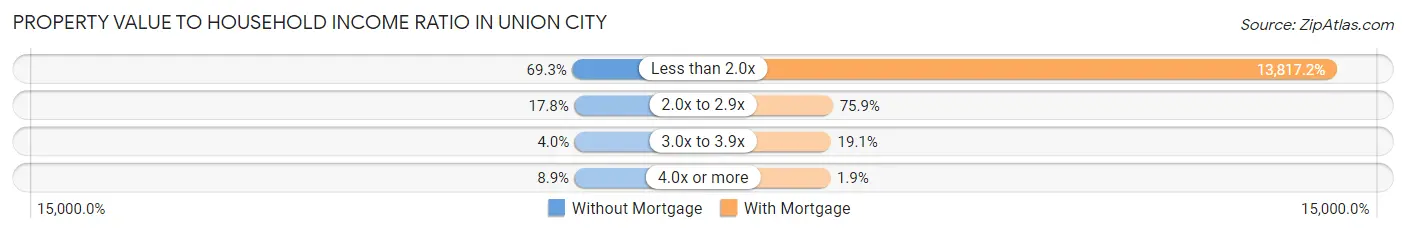
| Value-to-Income Ratio | Without Mortgage | With Mortgage |
| Less than 2.0x | 365 (69.3%) | 65,217 (13,817.2%) |
| 2.0x to 2.9x | 94 (17.8%) | 358 (75.8%) |
| 3.0x to 3.9x | 21 (4.0%) | 90 (19.1%) |
| 4.0x or more | 47 (8.9%) | 9 (1.9%) |
| Total | 527 (100.0%) | 472 (100.0%) |
Real Estate Taxes by Mortgage Status in Union City
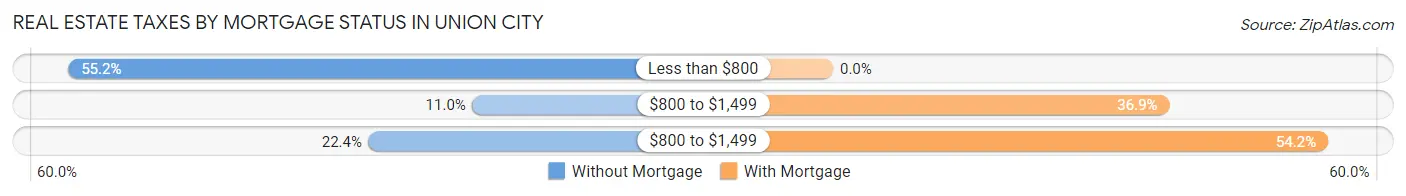
| Property Taxes | Without Mortgage | With Mortgage |
| Less than $800 | 291 (55.2%) | 0 (0.0%) |
| $800 to $1,499 | 58 (11.0%) | 174 (36.9%) |
| $800 to $1,499 | 118 (22.4%) | 256 (54.2%) |
| Total | 527 (100.0%) | 472 (100.0%) |
Health & Disability in Union City
Health Insurance Coverage by Age in Union City
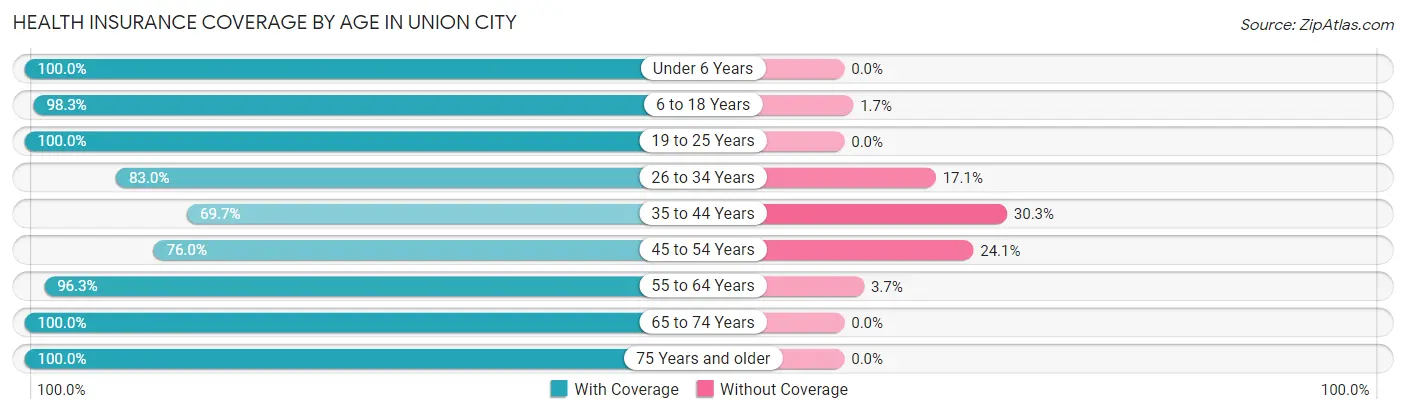
| Age Bracket | With Coverage | Without Coverage |
| Under 6 Years | 323 (100.0%) | 0 (0.0%) |
| 6 to 18 Years | 768 (98.3%) | 13 (1.7%) |
| 19 to 25 Years | 200 (100.0%) | 0 (0.0%) |
| 26 to 34 Years | 326 (83.0%) | 67 (17.1%) |
| 35 to 44 Years | 308 (69.7%) | 134 (30.3%) |
| 45 to 54 Years | 240 (75.9%) | 76 (24.0%) |
| 55 to 64 Years | 367 (96.3%) | 14 (3.7%) |
| 65 to 74 Years | 406 (100.0%) | 0 (0.0%) |
| 75 Years and older | 254 (100.0%) | 0 (0.0%) |
| Total | 3,192 (91.3%) | 304 (8.7%) |
Health Insurance Coverage by Citizenship Status in Union City
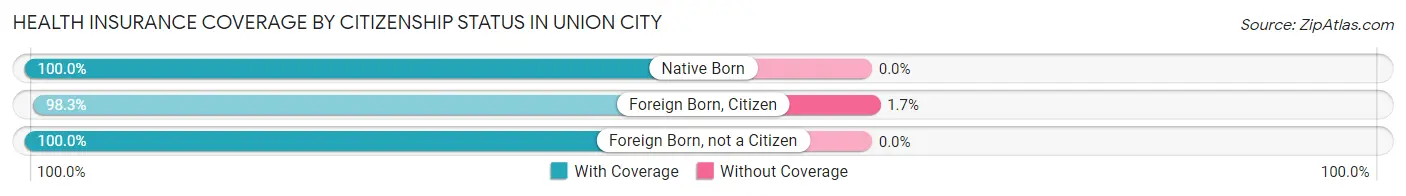
| Citizenship Status | With Coverage | Without Coverage |
| Native Born | 323 (100.0%) | 0 (0.0%) |
| Foreign Born, Citizen | 768 (98.3%) | 13 (1.7%) |
| Foreign Born, not a Citizen | 200 (100.0%) | 0 (0.0%) |
Health Insurance Coverage by Household Income in Union City
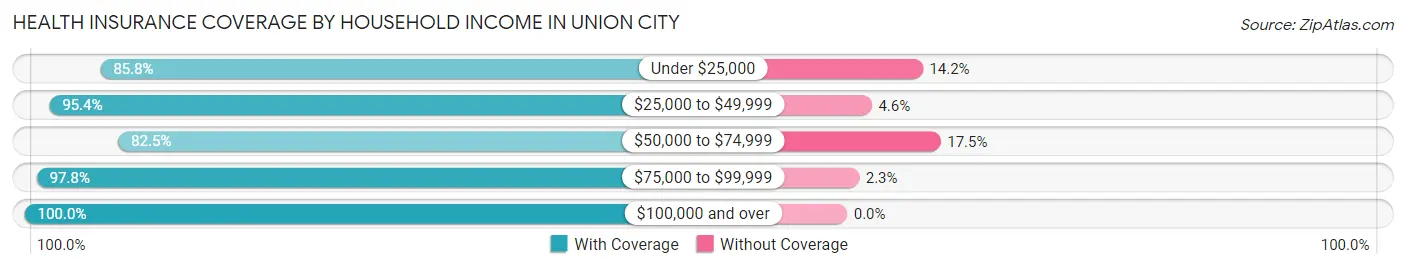
| Household Income | With Coverage | Without Coverage |
| Under $25,000 | 775 (85.8%) | 128 (14.2%) |
| $25,000 to $49,999 | 785 (95.4%) | 38 (4.6%) |
| $50,000 to $74,999 | 617 (82.5%) | 131 (17.5%) |
| $75,000 to $99,999 | 304 (97.8%) | 7 (2.2%) |
| $100,000 and over | 711 (100.0%) | 0 (0.0%) |
Public vs Private Health Insurance Coverage by Age in Union City
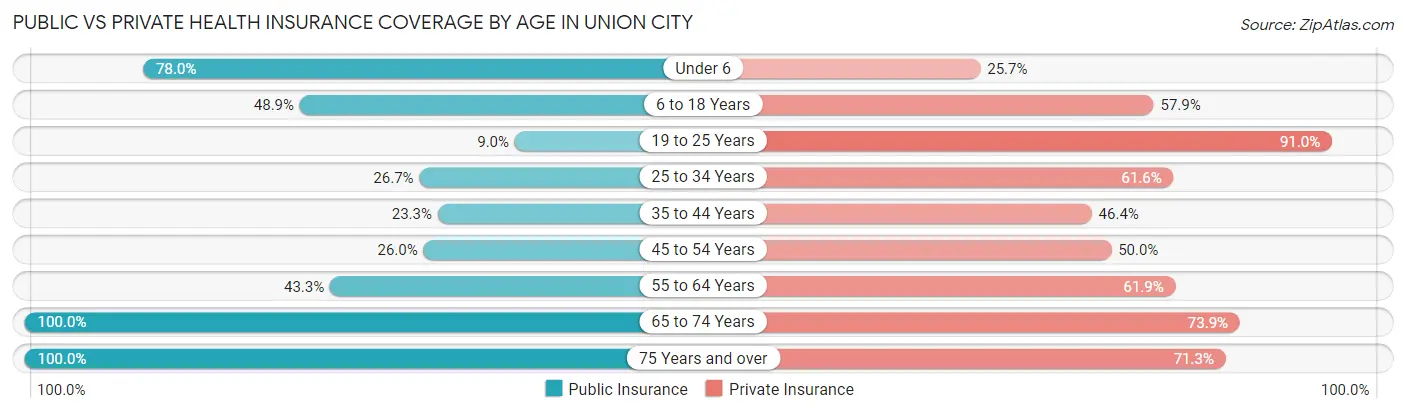
| Age Bracket | Public Insurance | Private Insurance |
| Under 6 | 252 (78.0%) | 83 (25.7%) |
| 6 to 18 Years | 382 (48.9%) | 452 (57.9%) |
| 19 to 25 Years | 18 (9.0%) | 182 (91.0%) |
| 25 to 34 Years | 105 (26.7%) | 242 (61.6%) |
| 35 to 44 Years | 103 (23.3%) | 205 (46.4%) |
| 45 to 54 Years | 82 (26.0%) | 158 (50.0%) |
| 55 to 64 Years | 165 (43.3%) | 236 (61.9%) |
| 65 to 74 Years | 406 (100.0%) | 300 (73.9%) |
| 75 Years and over | 254 (100.0%) | 181 (71.3%) |
| Total | 1,767 (50.5%) | 2,039 (58.3%) |
Disability Status by Sex by Age in Union City
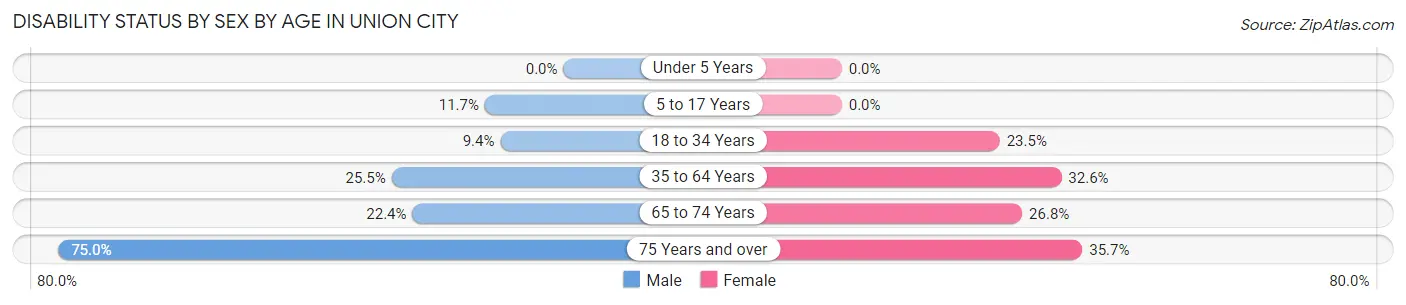
| Age Bracket | Male | Female |
| Under 5 Years | 0 (0.0%) | 0 (0.0%) |
| 5 to 17 Years | 42 (11.7%) | 0 (0.0%) |
| 18 to 34 Years | 35 (9.4%) | 72 (23.4%) |
| 35 to 64 Years | 138 (25.5%) | 195 (32.6%) |
| 65 to 74 Years | 50 (22.4%) | 49 (26.8%) |
| 75 Years and over | 96 (75.0%) | 45 (35.7%) |
Disability Class by Sex by Age in Union City
Disability Class: Hearing Difficulty
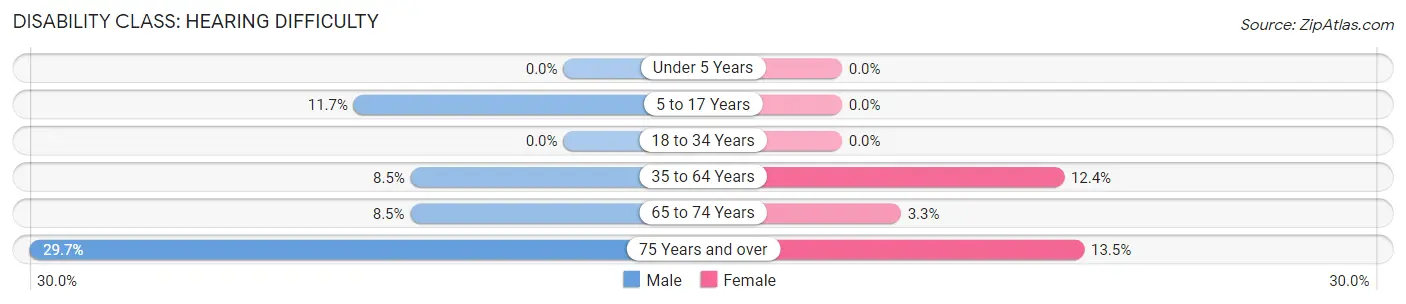
| Age Bracket | Male | Female |
| Under 5 Years | 0 (0.0%) | 0 (0.0%) |
| 5 to 17 Years | 42 (11.7%) | 0 (0.0%) |
| 18 to 34 Years | 0 (0.0%) | 0 (0.0%) |
| 35 to 64 Years | 46 (8.5%) | 74 (12.4%) |
| 65 to 74 Years | 19 (8.5%) | 6 (3.3%) |
| 75 Years and over | 38 (29.7%) | 17 (13.5%) |
Disability Class: Vision Difficulty
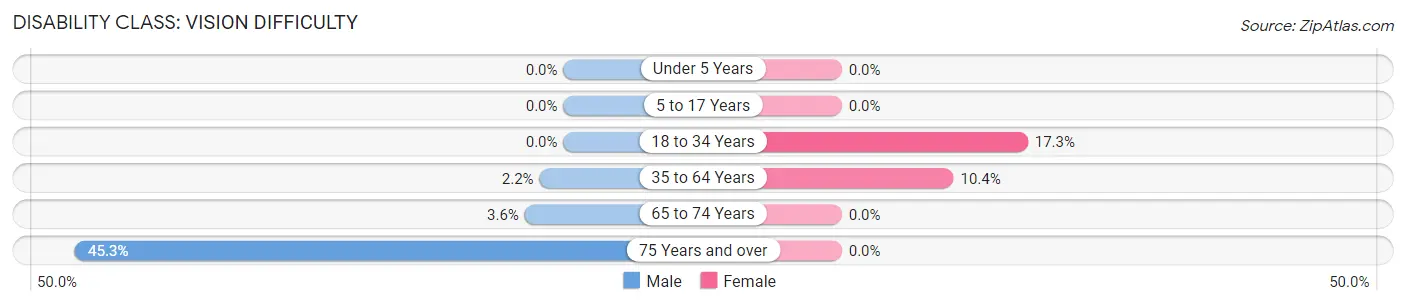
| Age Bracket | Male | Female |
| Under 5 Years | 0 (0.0%) | 0 (0.0%) |
| 5 to 17 Years | 0 (0.0%) | 0 (0.0%) |
| 18 to 34 Years | 0 (0.0%) | 53 (17.3%) |
| 35 to 64 Years | 12 (2.2%) | 62 (10.4%) |
| 65 to 74 Years | 8 (3.6%) | 0 (0.0%) |
| 75 Years and over | 58 (45.3%) | 0 (0.0%) |
Disability Class: Cognitive Difficulty
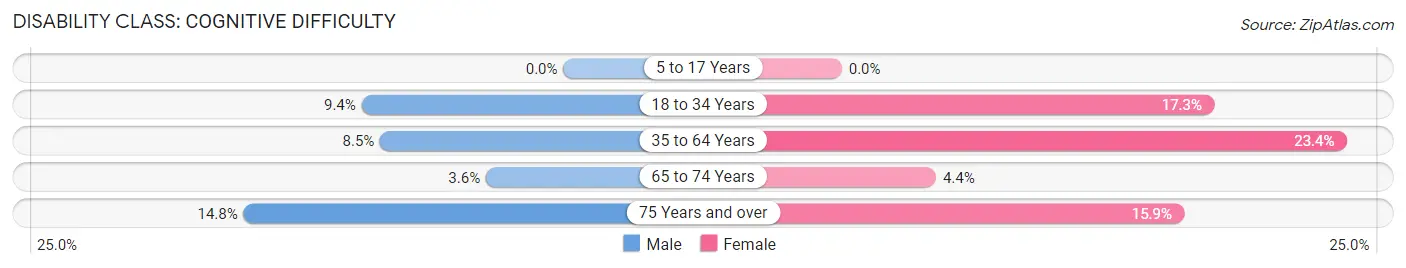
| Age Bracket | Male | Female |
| 5 to 17 Years | 0 (0.0%) | 0 (0.0%) |
| 18 to 34 Years | 35 (9.4%) | 53 (17.3%) |
| 35 to 64 Years | 46 (8.5%) | 140 (23.4%) |
| 65 to 74 Years | 8 (3.6%) | 8 (4.4%) |
| 75 Years and over | 19 (14.8%) | 20 (15.9%) |
Disability Class: Ambulatory Difficulty
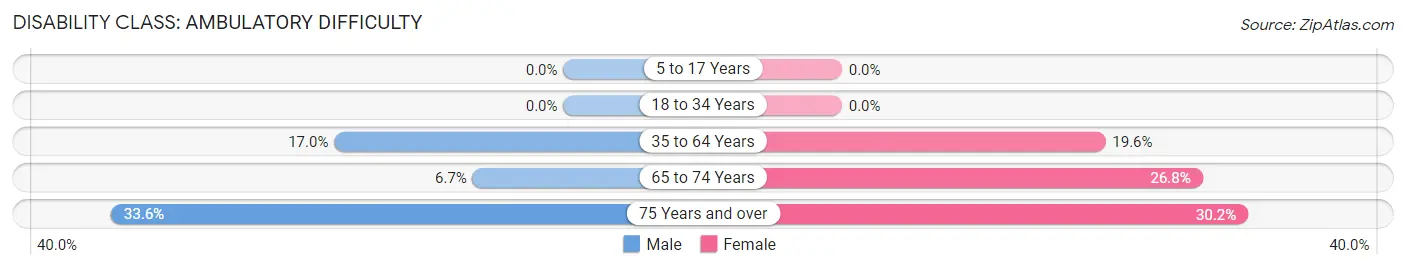
| Age Bracket | Male | Female |
| 5 to 17 Years | 0 (0.0%) | 0 (0.0%) |
| 18 to 34 Years | 0 (0.0%) | 0 (0.0%) |
| 35 to 64 Years | 92 (17.0%) | 117 (19.6%) |
| 65 to 74 Years | 15 (6.7%) | 49 (26.8%) |
| 75 Years and over | 43 (33.6%) | 38 (30.2%) |
Disability Class: Self-Care Difficulty
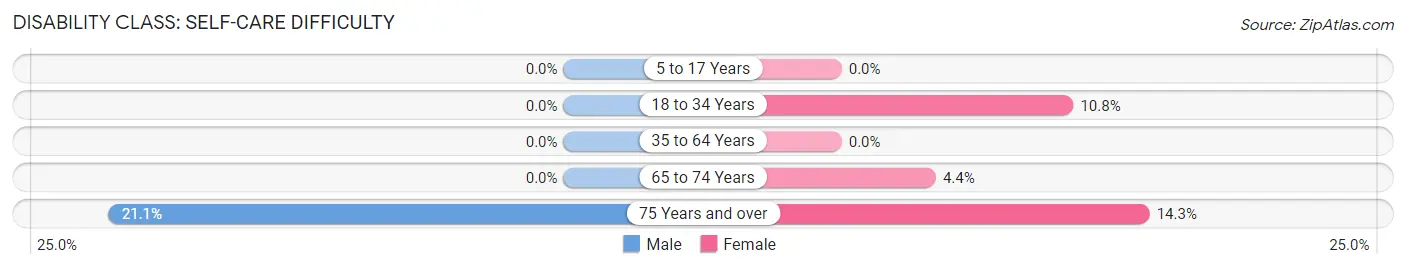
| Age Bracket | Male | Female |
| 5 to 17 Years | 0 (0.0%) | 0 (0.0%) |
| 18 to 34 Years | 0 (0.0%) | 33 (10.7%) |
| 35 to 64 Years | 0 (0.0%) | 0 (0.0%) |
| 65 to 74 Years | 0 (0.0%) | 8 (4.4%) |
| 75 Years and over | 27 (21.1%) | 18 (14.3%) |
Technology Access in Union City
Computing Device Access in Union City
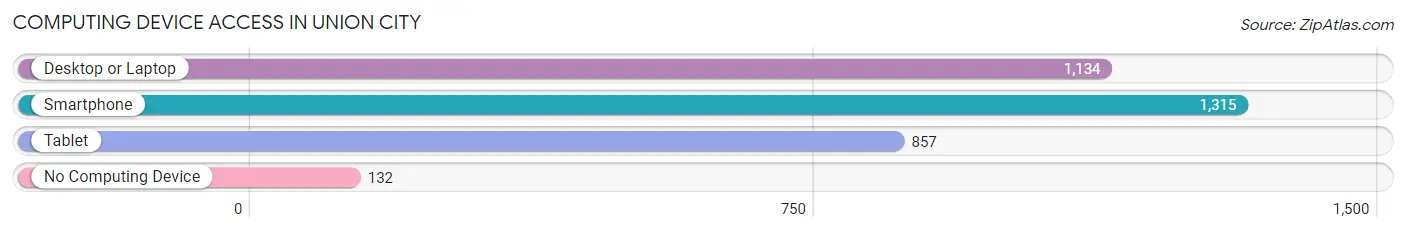
| Device Type | # Households | % Households |
| Desktop or Laptop | 1,134 | 71.6% |
| Smartphone | 1,315 | 83.1% |
| Tablet | 857 | 54.1% |
| No Computing Device | 132 | 8.3% |
| Total | 1,583 | 100.0% |
Internet Access in Union City
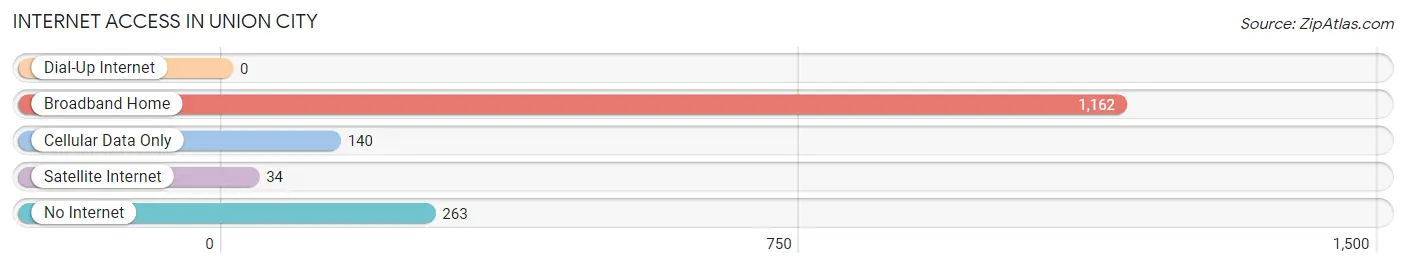
| Internet Type | # Households | % Households |
| Dial-Up Internet | 0 | 0.0% |
| Broadband Home | 1,162 | 73.4% |
| Cellular Data Only | 140 | 8.8% |
| Satellite Internet | 34 | 2.1% |
| No Internet | 263 | 16.6% |
| Total | 1,583 | 100.0% |
Union City Summary
Introduction
Union City is a small town located in Randolph County, Indiana. It is situated on the border of Ohio and Indiana, and is the county seat of Randolph County. The town has a population of around 3,000 people and is known for its historic downtown area, which is listed on the National Register of Historic Places. Union City is a small but vibrant community, with a rich history and a bright future.
History
Union City was founded in 1832 by a group of settlers from Ohio. The town was named after the Union Army, which had recently won the Battle of Tippecanoe. The town quickly grew and became a center of commerce and industry. In 1837, the first post office was established, and in 1845, the first railroad line was built.
The town continued to grow and prosper throughout the 19th century, and by the early 20th century, Union City had become a major industrial center. The town was home to several factories, including a glass factory, a paper mill, and a furniture factory. The town also had a thriving agricultural industry, with several farms and orchards in the area.
In the late 20th century, Union City began to experience a decline in its industrial base. Many of the factories closed, and the town's population began to decline. However, the town has since experienced a resurgence, and is now home to several small businesses and a vibrant downtown area.
Geography
Union City is located in Randolph County, Indiana, on the border of Ohio and Indiana. The town is situated on the banks of the Mississinewa River, and is surrounded by rolling hills and farmland. The town is located about 40 miles northeast of Indianapolis, and is about an hour's drive from Dayton, Ohio.
The town has a total area of 1.3 square miles, all of which is land. The town has a humid continental climate, with hot summers and cold winters. The average annual temperature is around 50 degrees Fahrenheit, and the average annual precipitation is around 40 inches.
Economy
Union City's economy is largely based on agriculture and manufacturing. The town is home to several small businesses, including a furniture factory, a paper mill, and a glass factory. The town also has a thriving agricultural industry, with several farms and orchards in the area.
The town is also home to several retail stores, restaurants, and other businesses. The town is also home to a branch of the Randolph County Public Library, which serves the community.
Demographics
As of the 2010 census, Union City had a population of 3,000 people. The town has a median household income of $37,000, and the median age is 38. The town is predominantly white, with about 90% of the population being white. The town also has a small Hispanic population, with about 5% of the population being Hispanic.
Conclusion
Union City is a small but vibrant town located in Randolph County, Indiana. The town has a rich history and a bright future, and is home to several small businesses and a thriving agricultural industry. The town has a population of around 3,000 people, and is predominantly white, with a small Hispanic population. Union City is a great place to live and work, and is a great example of a small town with a big heart.
Common Questions
What is Per Capita Income in Union City?
Per Capita income in Union City is $24,094.
What is the Median Family Income in Union City?
Median Family Income in Union City is $54,760.
What is the Median Household income in Union City?
Median Household Income in Union City is $36,250.
What is Income or Wage Gap in Union City?
Income or Wage Gap in Union City is 18.2%.
Women in Union City earn 81.8 cents for every dollar earned by a man.
What is Inequality or Gini Index in Union City?
Inequality or Gini Index in Union City is 0.45.
What is the Total Population of Union City?
Total Population of Union City is 3,511.
What is the Total Male Population of Union City?
Total Male Population of Union City is 1,819.
What is the Total Female Population of Union City?
Total Female Population of Union City is 1,692.
What is the Ratio of Males per 100 Females in Union City?
There are 107.51 Males per 100 Females in Union City.
What is the Ratio of Females per 100 Males in Union City?
There are 93.02 Females per 100 Males in Union City.
What is the Median Population Age in Union City?
Median Population Age in Union City is 37.8 Years.
What is the Average Family Size in Union City
Average Family Size in Union City is 3.2 People.
What is the Average Household Size in Union City
Average Household Size in Union City is 2.2 People.
How Large is the Labor Force in Union City?
There are 1,437 People in the Labor Forcein in Union City.
What is the Percentage of People in the Labor Force in Union City?
56.9% of People are in the Labor Force in Union City.
What is the Unemployment Rate in Union City?
Unemployment Rate in Union City is 10.0%.