South Whitley, IN Map & Demographics
South Whitley Map
South Whitley Overview
$29,212
PER CAPITA INCOME
$66,786
AVG FAMILY INCOME
$55,000
AVG HOUSEHOLD INCOME
31.0%
WAGE / INCOME GAP [ % ]
69.0¢/ $1
WAGE / INCOME GAP [ $ ]
$7,917
FAMILY INCOME DEFICIT
0.36
INEQUALITY / GINI INDEX
1,273
TOTAL POPULATION
667
MALE POPULATION
606
FEMALE POPULATION
110.07
MALES / 100 FEMALES
90.85
FEMALES / 100 MALES
40.8
MEDIAN AGE
2.8
AVG FAMILY SIZE
2.1
AVG HOUSEHOLD SIZE
685
LABOR FORCE [ PEOPLE ]
66.2%
PERCENT IN LABOR FORCE
7.6%
UNEMPLOYMENT RATE
South Whitley Zip Codes
South Whitley Area Codes
Income in South Whitley
Income Overview in South Whitley
Per Capita Income in South Whitley is $29,212, while median incomes of families and households are $66,786 and $55,000 respectively.
| Characteristic | Number | Measure |
| Per Capita Income | 1,273 | $29,212 |
| Median Family Income | 326 | $66,786 |
| Mean Family Income | 326 | $72,475 |
| Median Household Income | 590 | $55,000 |
| Mean Household Income | 590 | $64,803 |
| Income Deficit | 326 | $7,917 |
| Wage / Income Gap (%) | 1,273 | 31.01% |
| Wage / Income Gap ($) | 1,273 | 68.99¢ per $1 |
| Gini / Inequality Index | 1,273 | 0.36 |
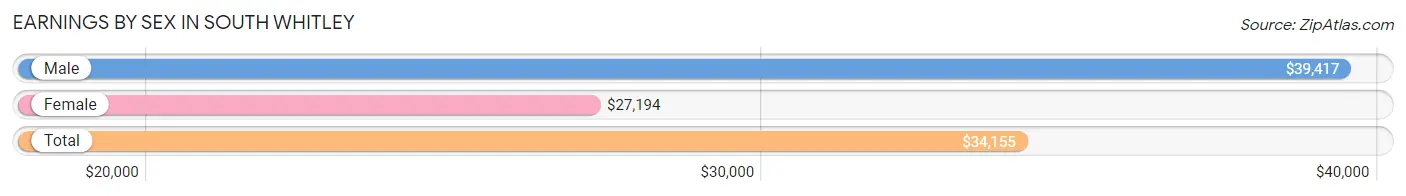
Earnings by Sex in South Whitley
Average Earnings in South Whitley are $34,155, $39,417 for men and $27,194 for women, a difference of 31.0%.
| Sex | Number | Average Earnings |
| Male | 419 (56.7%) | $39,417 |
| Female | 320 (43.3%) | $27,194 |
| Total | 739 (100.0%) | $34,155 |
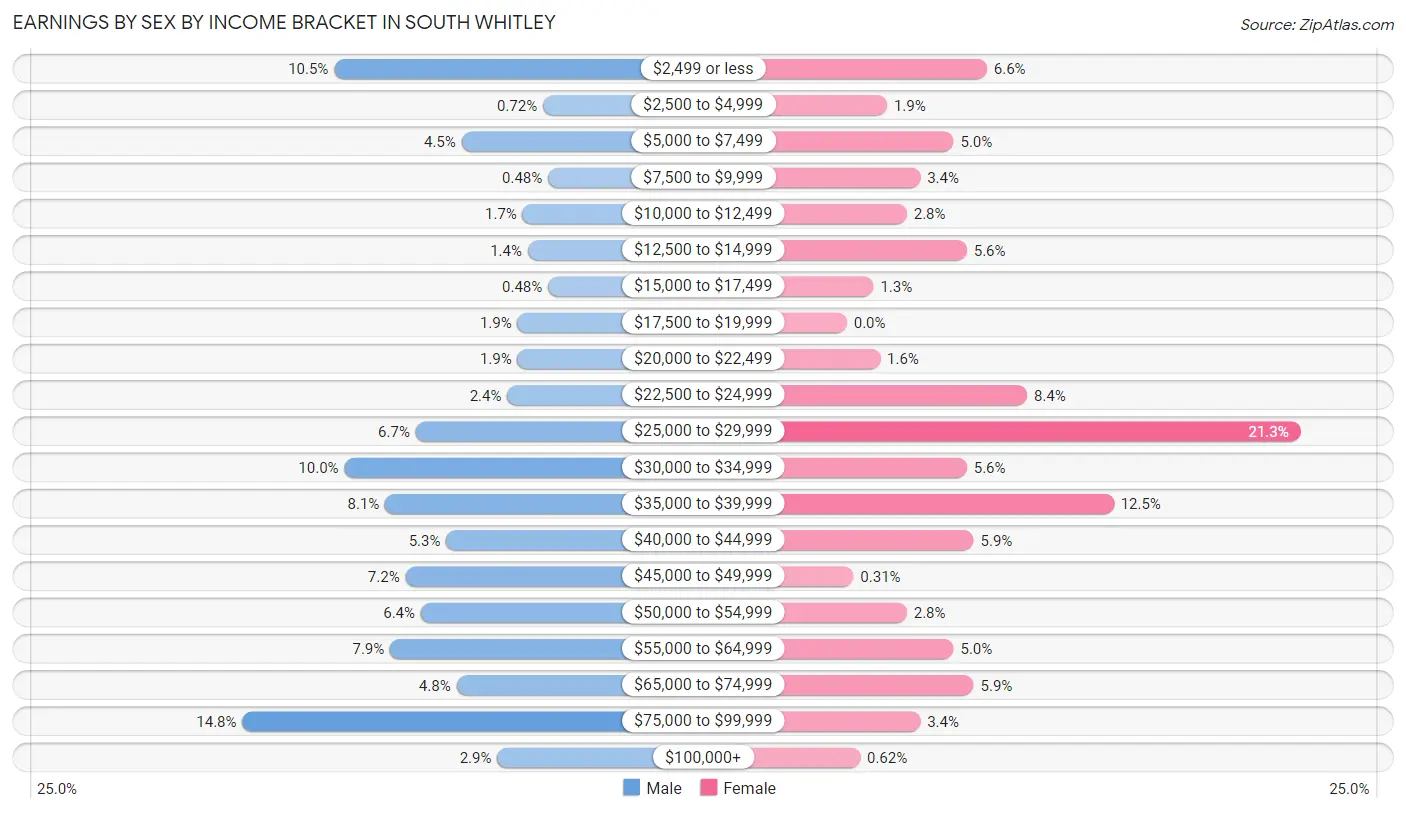
Earnings by Sex by Income Bracket in South Whitley
The most common earnings brackets in South Whitley are $75,000 to $99,999 for men (62 | 14.8%) and $25,000 to $29,999 for women (68 | 21.2%).
| Income | Male | Female |
| $2,499 or less | 44 (10.5%) | 21 (6.6%) |
| $2,500 to $4,999 | 3 (0.7%) | 6 (1.9%) |
| $5,000 to $7,499 | 19 (4.5%) | 16 (5.0%) |
| $7,500 to $9,999 | 2 (0.5%) | 11 (3.4%) |
| $10,000 to $12,499 | 7 (1.7%) | 9 (2.8%) |
| $12,500 to $14,999 | 6 (1.4%) | 18 (5.6%) |
| $15,000 to $17,499 | 2 (0.5%) | 4 (1.3%) |
| $17,500 to $19,999 | 8 (1.9%) | 0 (0.0%) |
| $20,000 to $22,499 | 8 (1.9%) | 5 (1.6%) |
| $22,500 to $24,999 | 10 (2.4%) | 27 (8.4%) |
| $25,000 to $29,999 | 28 (6.7%) | 68 (21.2%) |
| $30,000 to $34,999 | 42 (10.0%) | 18 (5.6%) |
| $35,000 to $39,999 | 34 (8.1%) | 40 (12.5%) |
| $40,000 to $44,999 | 22 (5.2%) | 19 (5.9%) |
| $45,000 to $49,999 | 30 (7.2%) | 1 (0.3%) |
| $50,000 to $54,999 | 27 (6.4%) | 9 (2.8%) |
| $55,000 to $64,999 | 33 (7.9%) | 16 (5.0%) |
| $65,000 to $74,999 | 20 (4.8%) | 19 (5.9%) |
| $75,000 to $99,999 | 62 (14.8%) | 11 (3.4%) |
| $100,000+ | 12 (2.9%) | 2 (0.6%) |
| Total | 419 (100.0%) | 320 (100.0%) |
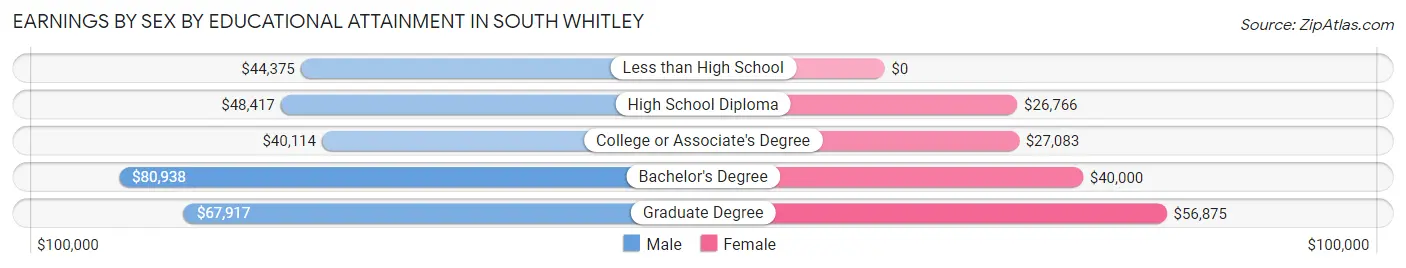
Earnings by Sex by Educational Attainment in South Whitley
Average earnings in South Whitley are $47,083 for men and $27,168 for women, a difference of 42.3%. Men with an educational attainment of bachelor's degree enjoy the highest average annual earnings of $80,938, while those with college or associate's degree education earn the least with $40,114. Women with an educational attainment of graduate degree earn the most with the average annual earnings of $56,875, while those with high school diploma education have the smallest earnings of $26,766.
| Educational Attainment | Male Income | Female Income |
| Less than High School | $44,375 | $0 |
| High School Diploma | $48,417 | $26,766 |
| College or Associate's Degree | $40,114 | $27,083 |
| Bachelor's Degree | $80,938 | $40,000 |
| Graduate Degree | $67,917 | $56,875 |
| Total | $47,083 | $27,168 |
Family Income in South Whitley
Family Income Brackets in South Whitley
According to the South Whitley family income data, there are 71 families falling into the $75,000 to $99,999 income range, which is the most common income bracket and makes up 21.8% of all families. Conversely, the less than $10,000 income bracket is the least frequent group with only 3 families (0.9%) belonging to this category.
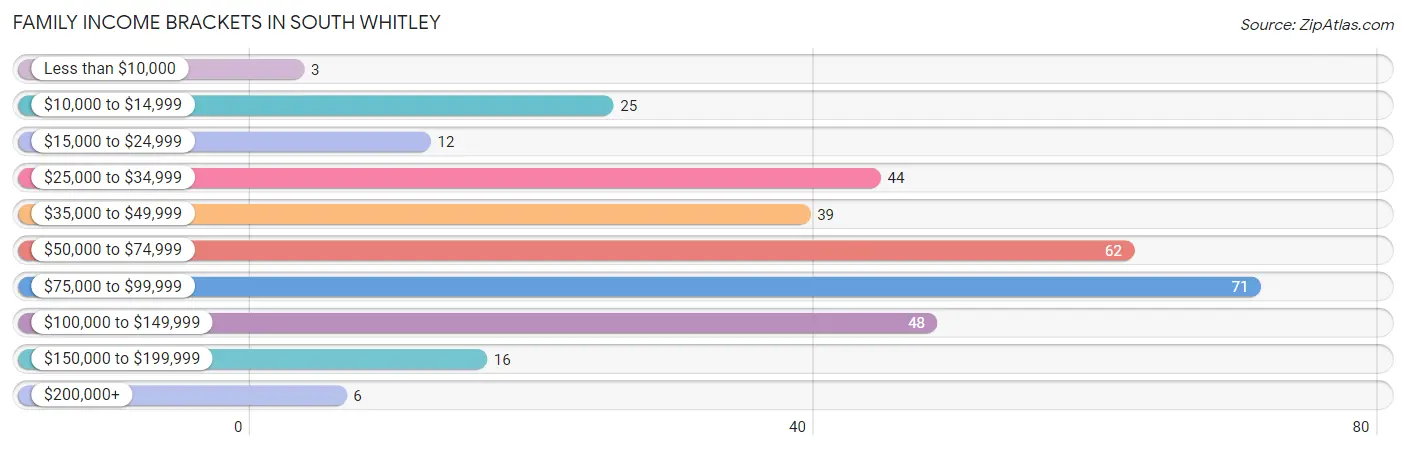
| Income Bracket | # Families | % Families |
| Less than $10,000 | 3 | 0.9% |
| $10,000 to $14,999 | 25 | 7.7% |
| $15,000 to $24,999 | 12 | 3.7% |
| $25,000 to $34,999 | 44 | 13.5% |
| $35,000 to $49,999 | 39 | 12.0% |
| $50,000 to $74,999 | 62 | 19.0% |
| $75,000 to $99,999 | 71 | 21.8% |
| $100,000 to $149,999 | 48 | 14.7% |
| $150,000 to $199,999 | 16 | 4.9% |
| $200,000+ | 6 | 1.8% |
Family Income by Famaliy Size in South Whitley
4-person families (51 | 15.6%) account for the highest median family income in South Whitley with $69,531 per family, while 2-person families (160 | 49.1%) have the highest median income of $33,125 per family member.
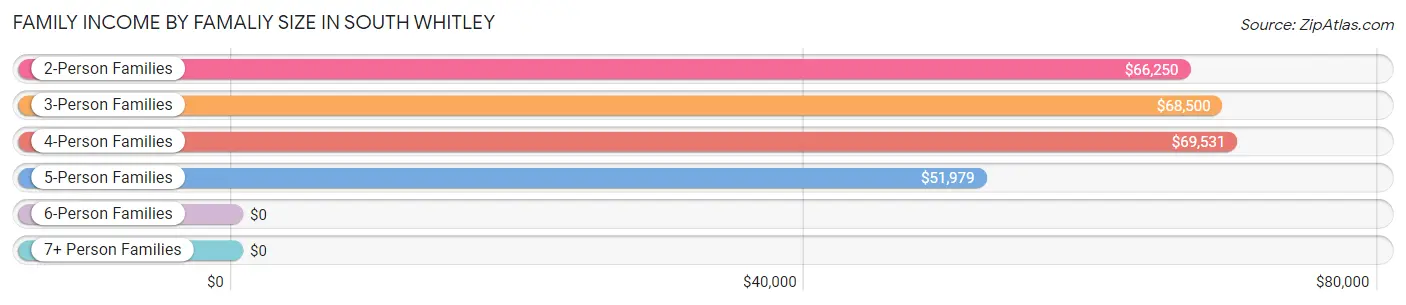
| Income Bracket | # Families | Median Income |
| 2-Person Families | 160 (49.1%) | $66,250 |
| 3-Person Families | 82 (25.2%) | $68,500 |
| 4-Person Families | 51 (15.6%) | $69,531 |
| 5-Person Families | 33 (10.1%) | $51,979 |
| 6-Person Families | 0 (0.0%) | $0 |
| 7+ Person Families | 0 (0.0%) | $0 |
| Total | 326 (100.0%) | $66,786 |
Family Income by Number of Earners in South Whitley
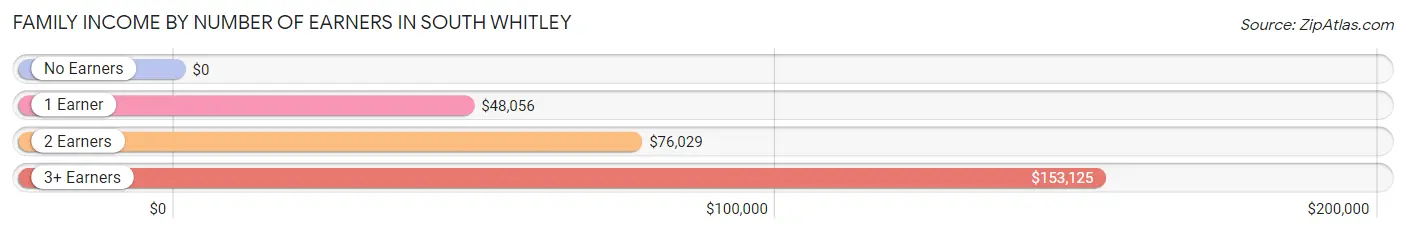
| Number of Earners | # Families | Median Income |
| No Earners | 37 (11.4%) | $0 |
| 1 Earner | 104 (31.9%) | $48,056 |
| 2 Earners | 152 (46.6%) | $76,029 |
| 3+ Earners | 33 (10.1%) | $153,125 |
| Total | 326 (100.0%) | $66,786 |
Household Income in South Whitley
Household Income Brackets in South Whitley
With 126 households falling in the category, the $75,000 to $99,999 income range is the most frequent in South Whitley, accounting for 21.4% of all households. In contrast, only 8 households (1.4%) fall into the less than $10,000 income bracket, making it the least populous group.
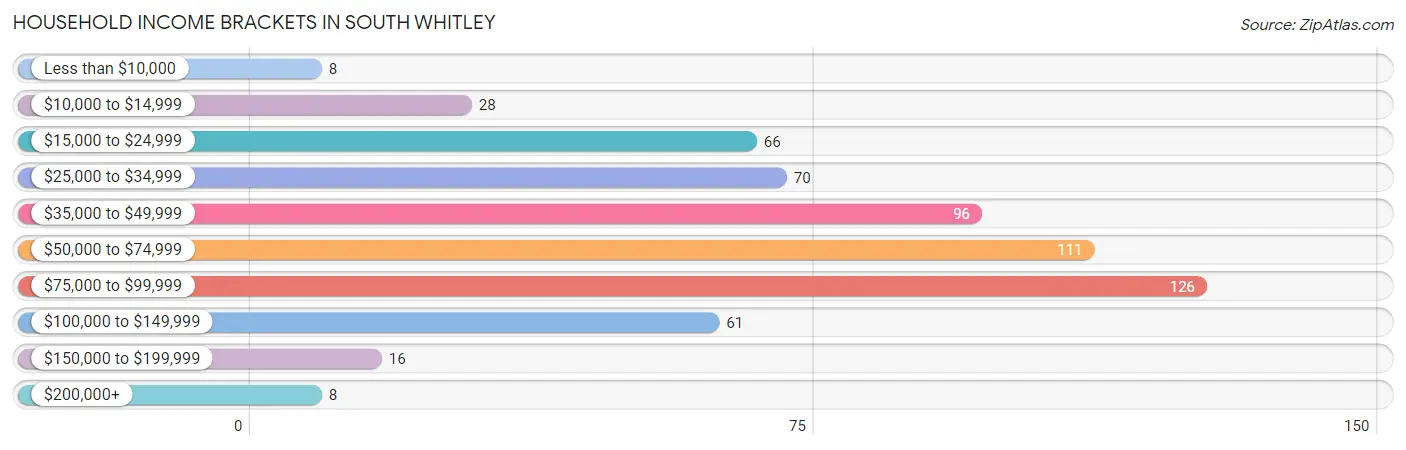
| Income Bracket | # Households | % Households |
| Less than $10,000 | 8 | 1.4% |
| $10,000 to $14,999 | 28 | 4.7% |
| $15,000 to $24,999 | 66 | 11.2% |
| $25,000 to $34,999 | 70 | 11.9% |
| $35,000 to $49,999 | 96 | 16.3% |
| $50,000 to $74,999 | 111 | 18.8% |
| $75,000 to $99,999 | 126 | 21.4% |
| $100,000 to $149,999 | 61 | 10.3% |
| $150,000 to $199,999 | 16 | 2.7% |
| $200,000+ | 8 | 1.4% |
Household Income by Householder Age in South Whitley
The median household income in South Whitley is $55,000, with the highest median household income of $75,625 found in the 25 to 44 years age bracket for the primary householder. A total of 186 households (31.5%) fall into this category. Meanwhile, the 45 to 64 years age bracket for the primary householder has the lowest median household income of $48,403, with 213 households (36.1%) in this group.
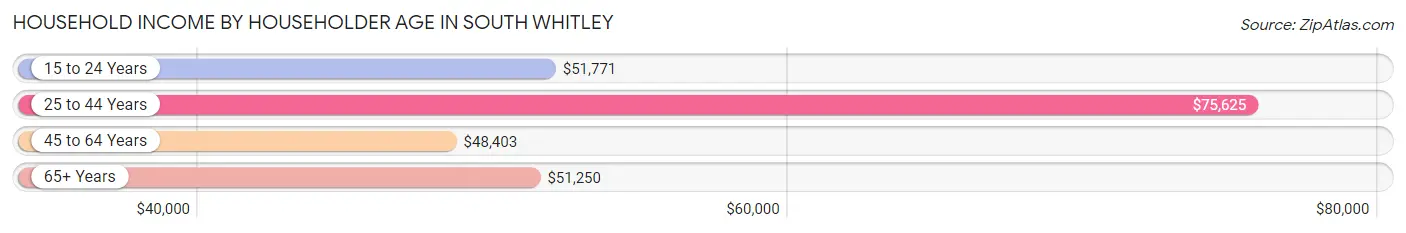
| Income Bracket | # Households | Median Income |
| 15 to 24 Years | 27 (4.6%) | $51,771 |
| 25 to 44 Years | 186 (31.5%) | $75,625 |
| 45 to 64 Years | 213 (36.1%) | $48,403 |
| 65+ Years | 164 (27.8%) | $51,250 |
| Total | 590 (100.0%) | $55,000 |
Poverty in South Whitley
Income Below Poverty by Sex and Age in South Whitley
With 16.0% poverty level for males and 16.9% for females among the residents of South Whitley, under 5 year old males and 5 year old females are the most vulnerable to poverty, with 37 males (63.8%) and 12 females (52.2%) in their respective age groups living below the poverty level.
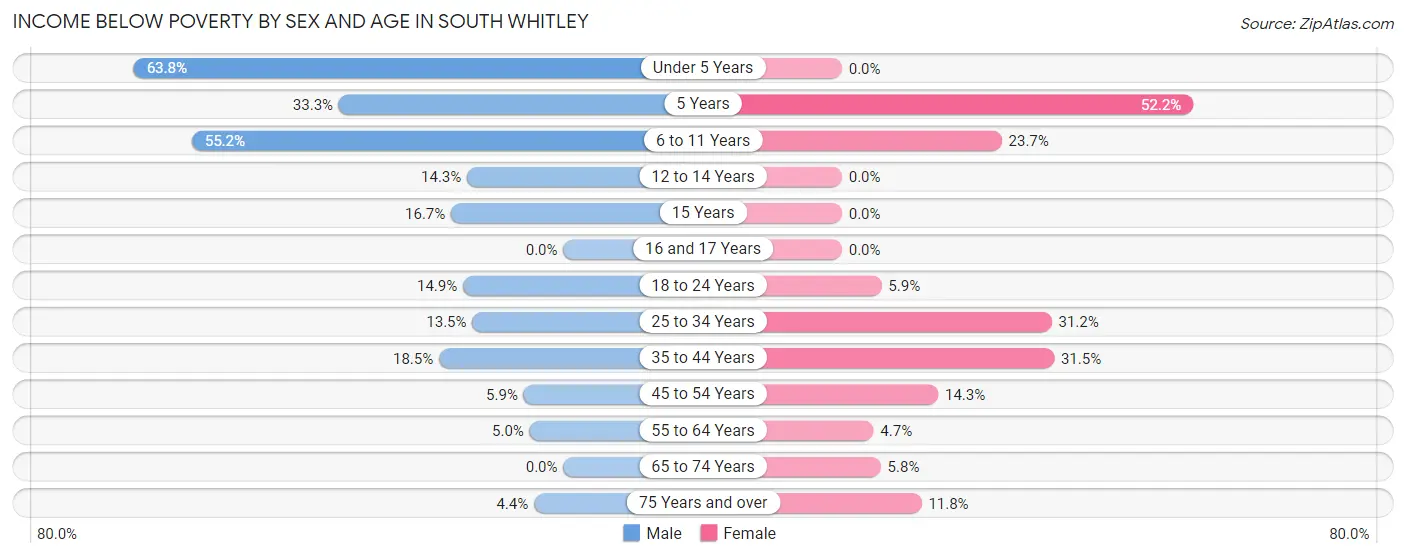
| Age Bracket | Male | Female |
| Under 5 Years | 37 (63.8%) | 0 (0.0%) |
| 5 Years | 3 (33.3%) | 12 (52.2%) |
| 6 to 11 Years | 16 (55.2%) | 14 (23.7%) |
| 12 to 14 Years | 2 (14.3%) | 0 (0.0%) |
| 15 Years | 2 (16.7%) | 0 (0.0%) |
| 16 and 17 Years | 0 (0.0%) | 0 (0.0%) |
| 18 to 24 Years | 7 (14.9%) | 2 (5.9%) |
| 25 to 34 Years | 15 (13.5%) | 19 (31.1%) |
| 35 to 44 Years | 12 (18.5%) | 23 (31.5%) |
| 45 to 54 Years | 5 (5.9%) | 15 (14.3%) |
| 55 to 64 Years | 6 (5.0%) | 3 (4.7%) |
| 65 to 74 Years | 0 (0.0%) | 3 (5.8%) |
| 75 Years and over | 2 (4.3%) | 11 (11.8%) |
| Total | 107 (16.0%) | 102 (16.9%) |
Income Above Poverty by Sex and Age in South Whitley
According to the poverty statistics in South Whitley, males aged 16 and 17 years and females aged under 5 years are the age groups that are most secure financially, with 100.0% of males and 100.0% of females in these age groups living above the poverty line.
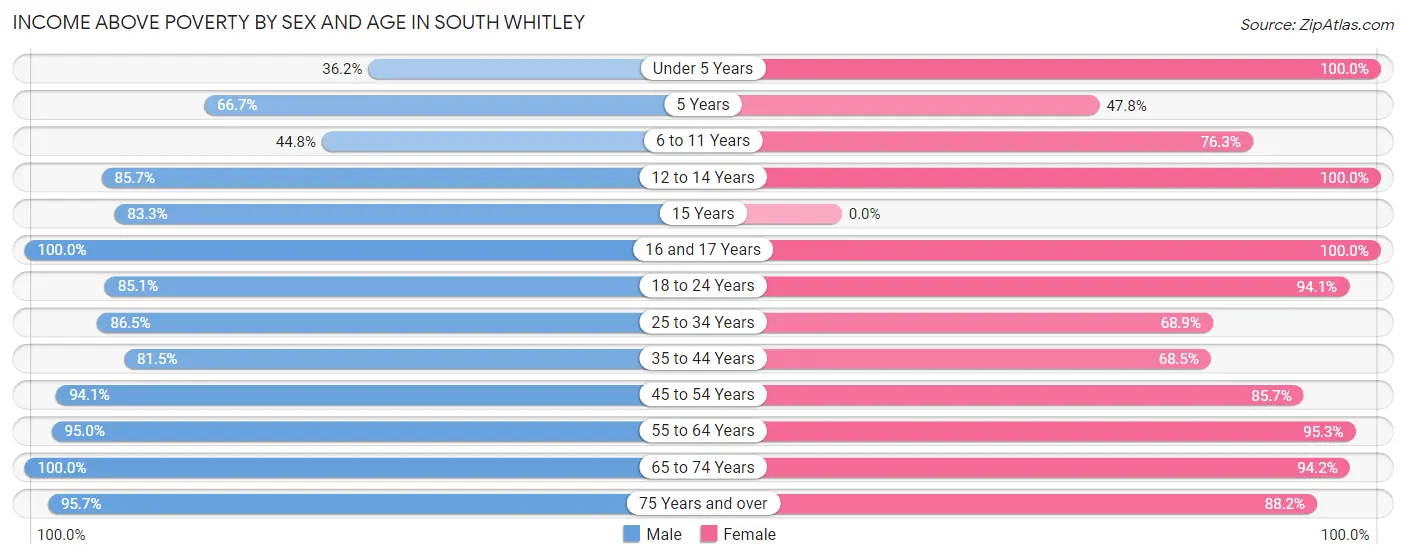
| Age Bracket | Male | Female |
| Under 5 Years | 21 (36.2%) | 17 (100.0%) |
| 5 Years | 6 (66.7%) | 11 (47.8%) |
| 6 to 11 Years | 13 (44.8%) | 45 (76.3%) |
| 12 to 14 Years | 12 (85.7%) | 14 (100.0%) |
| 15 Years | 10 (83.3%) | 0 (0.0%) |
| 16 and 17 Years | 38 (100.0%) | 8 (100.0%) |
| 18 to 24 Years | 40 (85.1%) | 32 (94.1%) |
| 25 to 34 Years | 96 (86.5%) | 42 (68.9%) |
| 35 to 44 Years | 53 (81.5%) | 50 (68.5%) |
| 45 to 54 Years | 80 (94.1%) | 90 (85.7%) |
| 55 to 64 Years | 114 (95.0%) | 61 (95.3%) |
| 65 to 74 Years | 33 (100.0%) | 49 (94.2%) |
| 75 Years and over | 44 (95.7%) | 82 (88.2%) |
| Total | 560 (84.0%) | 501 (83.1%) |
Income Below Poverty Among Married-Couple Families in South Whitley
The poverty statistics for married-couple families in South Whitley show that 5.3% or 11 of the total 206 families live below the poverty line. Families with 1 or 2 children have the highest poverty rate of 15.4%, comprising of 8 families. On the other hand, families with 3 or 4 children have the lowest poverty rate of 0.0%, which includes 0 families.
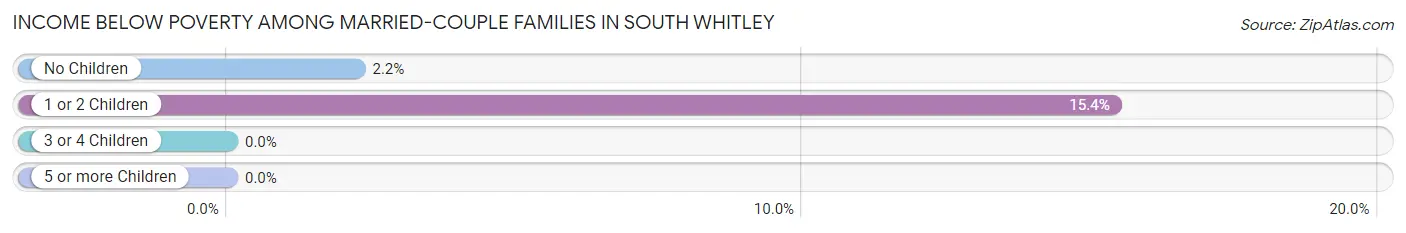
| Children | Above Poverty | Below Poverty |
| No Children | 132 (97.8%) | 3 (2.2%) |
| 1 or 2 Children | 44 (84.6%) | 8 (15.4%) |
| 3 or 4 Children | 19 (100.0%) | 0 (0.0%) |
| 5 or more Children | 0 (0.0%) | 0 (0.0%) |
| Total | 195 (94.7%) | 11 (5.3%) |
Income Below Poverty Among Single-Parent Households in South Whitley
According to the poverty data in South Whitley, 54.2% or 13 single-father households and 25.0% or 24 single-mother households are living below the poverty line. Among single-father households, those with 3 or 4 children have the highest poverty rate, with 4 households (100.0%) experiencing poverty. Likewise, among single-mother households, those with 3 or 4 children have the highest poverty rate, with 3 households (100.0%) falling below the poverty line.
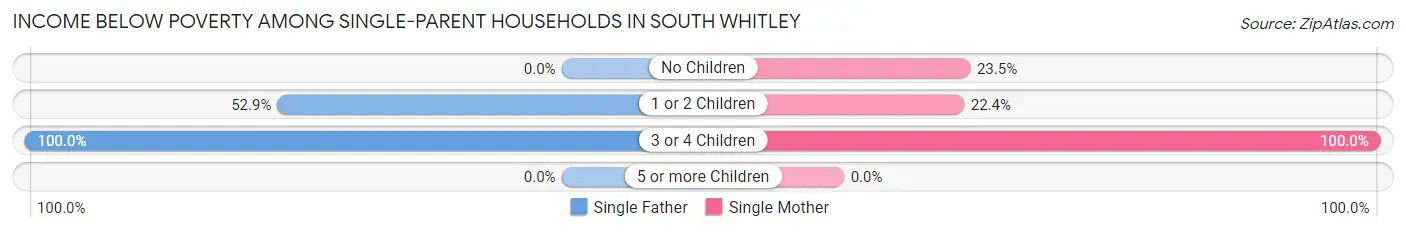
| Children | Single Father | Single Mother |
| No Children | 0 (0.0%) | 4 (23.5%) |
| 1 or 2 Children | 9 (52.9%) | 17 (22.4%) |
| 3 or 4 Children | 4 (100.0%) | 3 (100.0%) |
| 5 or more Children | 0 (0.0%) | 0 (0.0%) |
| Total | 13 (54.2%) | 24 (25.0%) |
Income Below Poverty Among Married-Couple vs Single-Parent Households in South Whitley
The poverty data for South Whitley shows that 11 of the married-couple family households (5.3%) and 37 of the single-parent households (30.8%) are living below the poverty level. Within the married-couple family households, those with 1 or 2 children have the highest poverty rate, with 8 households (15.4%) falling below the poverty line. Among the single-parent households, those with 3 or 4 children have the highest poverty rate, with 7 household (100.0%) living below poverty.
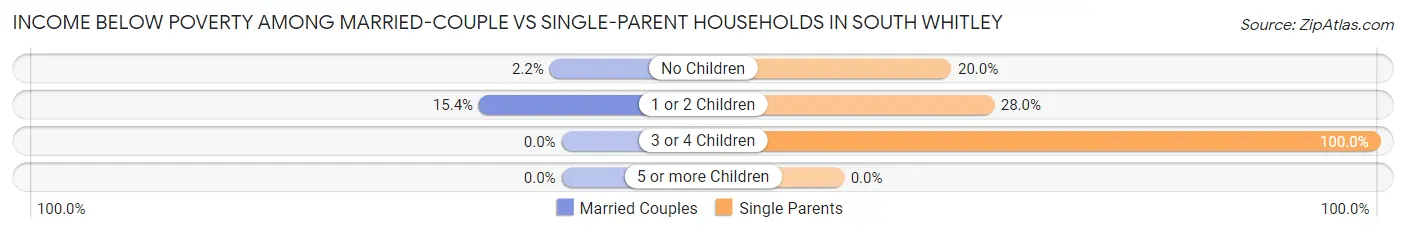
| Children | Married-Couple Families | Single-Parent Households |
| No Children | 3 (2.2%) | 4 (20.0%) |
| 1 or 2 Children | 8 (15.4%) | 26 (28.0%) |
| 3 or 4 Children | 0 (0.0%) | 7 (100.0%) |
| 5 or more Children | 0 (0.0%) | 0 (0.0%) |
| Total | 11 (5.3%) | 37 (30.8%) |
Race in South Whitley
The most populous races in South Whitley are White / Caucasian (1,221 | 95.9%), Asian (21 | 1.7%), and Two or more Races (20 | 1.6%).
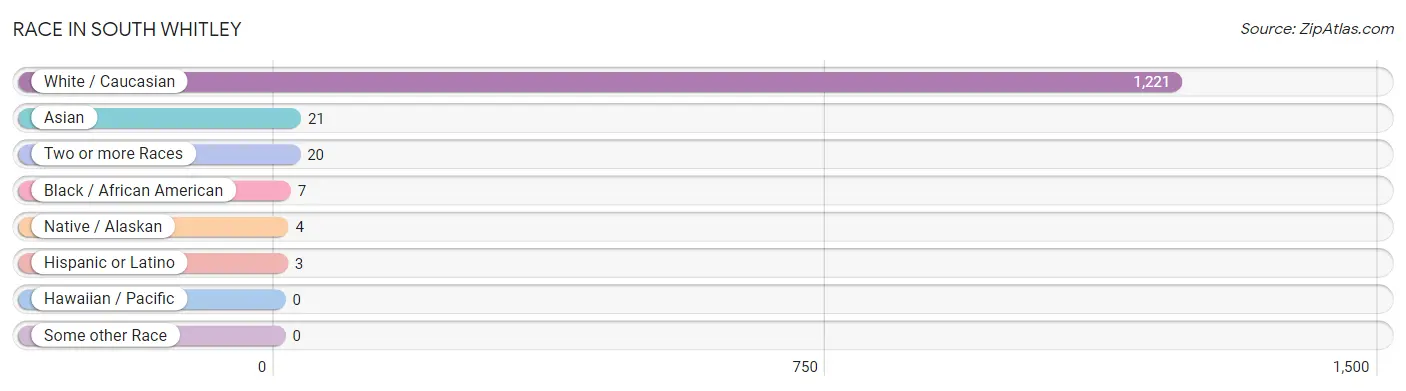
| Race | # Population | % Population |
| Asian | 21 | 1.7% |
| Black / African American | 7 | 0.5% |
| Hawaiian / Pacific | 0 | 0.0% |
| Hispanic or Latino | 3 | 0.2% |
| Native / Alaskan | 4 | 0.3% |
| White / Caucasian | 1,221 | 95.9% |
| Two or more Races | 20 | 1.6% |
| Some other Race | 0 | 0.0% |
| Total | 1,273 | 100.0% |
Ancestry in South Whitley
The most populous ancestries reported in South Whitley are German (300 | 23.6%), Irish (162 | 12.7%), English (159 | 12.5%), American (117 | 9.2%), and Italian (70 | 5.5%), together accounting for 63.5% of all South Whitley residents.
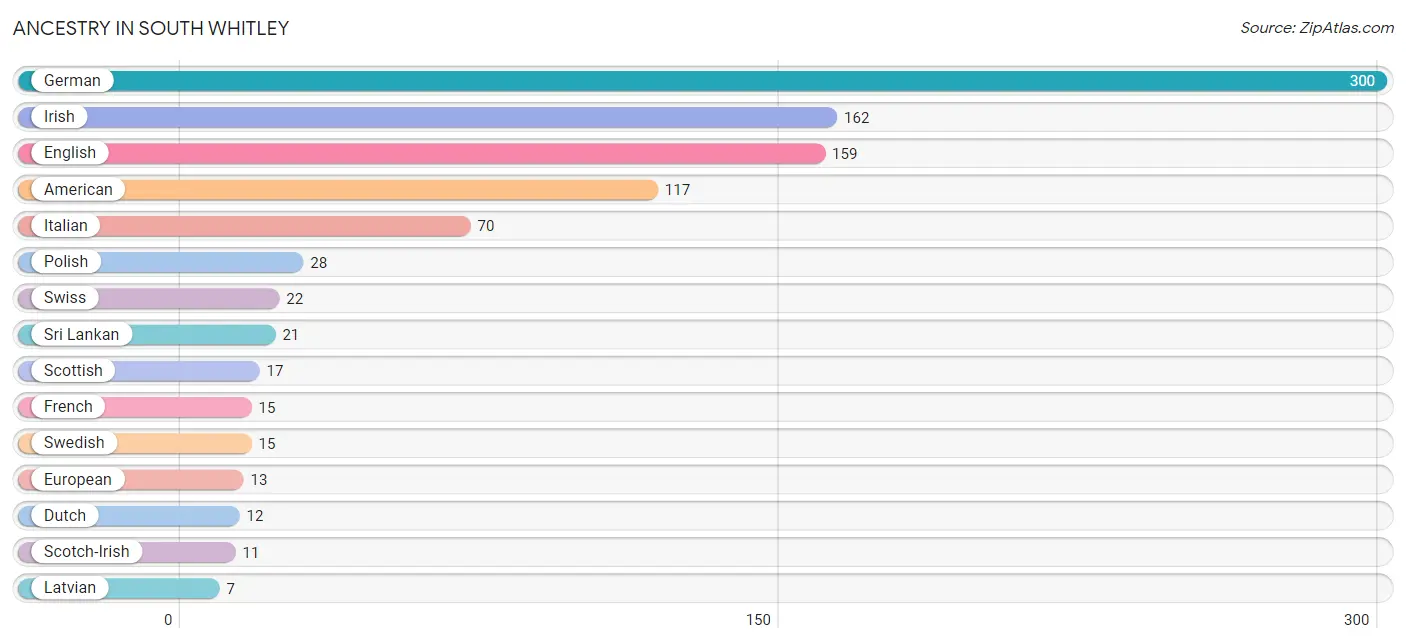
| Ancestry | # Population | % Population |
| American | 117 | 9.2% |
| Blackfeet | 1 | 0.1% |
| Dutch | 12 | 0.9% |
| English | 159 | 12.5% |
| European | 13 | 1.0% |
| French | 15 | 1.2% |
| French Canadian | 1 | 0.1% |
| German | 300 | 23.6% |
| Greek | 3 | 0.2% |
| Irish | 162 | 12.7% |
| Italian | 70 | 5.5% |
| Latvian | 7 | 0.5% |
| Mexican | 3 | 0.2% |
| Norwegian | 6 | 0.5% |
| Polish | 28 | 2.2% |
| Scandinavian | 3 | 0.2% |
| Scotch-Irish | 11 | 0.9% |
| Scottish | 17 | 1.3% |
| Slovak | 3 | 0.2% |
| Sri Lankan | 21 | 1.7% |
| Swedish | 15 | 1.2% |
| Swiss | 22 | 1.7% | View All 22 Rows |
Immigrants in South Whitley
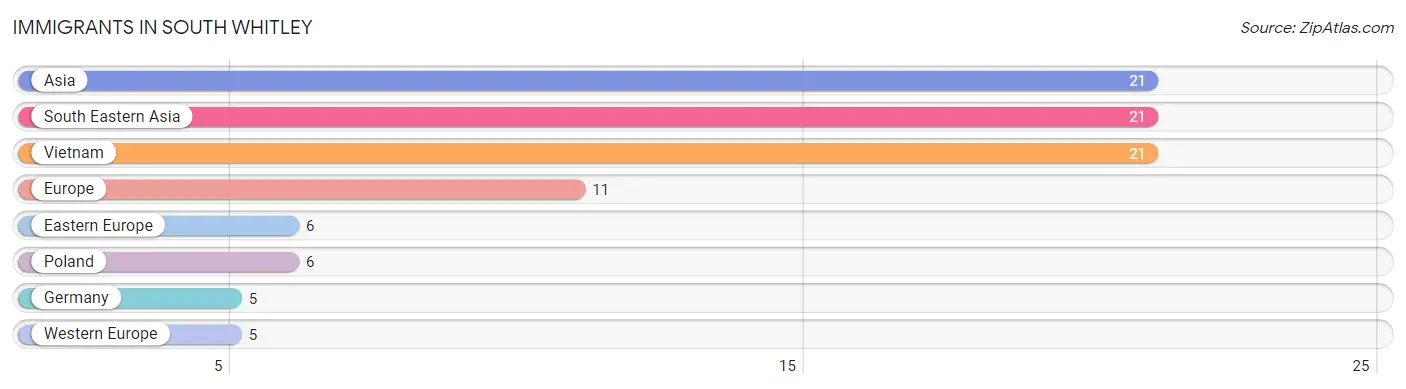
The most numerous immigrant groups reported in South Whitley came from Asia (21 | 1.7%), South Eastern Asia (21 | 1.7%), Vietnam (21 | 1.7%), Europe (11 | 0.9%), and Eastern Europe (6 | 0.5%), together accounting for 6.3% of all South Whitley residents.
| Immigration Origin | # Population | % Population |
| Asia | 21 | 1.7% |
| Eastern Europe | 6 | 0.5% |
| Europe | 11 | 0.9% |
| Germany | 5 | 0.4% |
| Poland | 6 | 0.5% |
| South Eastern Asia | 21 | 1.7% |
| Vietnam | 21 | 1.7% |
| Western Europe | 5 | 0.4% | View All 8 Rows |
Sex and Age in South Whitley
Sex and Age in South Whitley
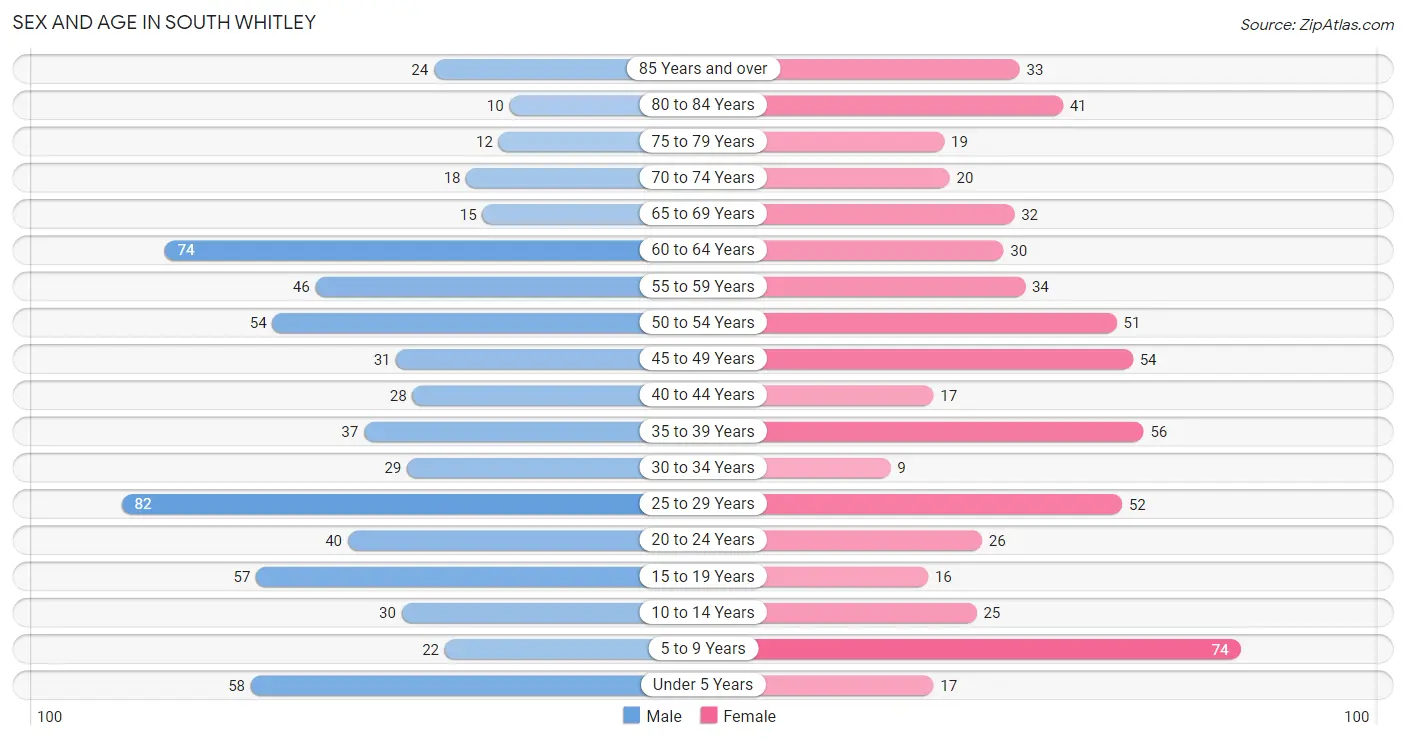
The most populous age groups in South Whitley are 25 to 29 Years (82 | 12.3%) for men and 5 to 9 Years (74 | 12.2%) for women.
| Age Bracket | Male | Female |
| Under 5 Years | 58 (8.7%) | 17 (2.8%) |
| 5 to 9 Years | 22 (3.3%) | 74 (12.2%) |
| 10 to 14 Years | 30 (4.5%) | 25 (4.1%) |
| 15 to 19 Years | 57 (8.6%) | 16 (2.6%) |
| 20 to 24 Years | 40 (6.0%) | 26 (4.3%) |
| 25 to 29 Years | 82 (12.3%) | 52 (8.6%) |
| 30 to 34 Years | 29 (4.3%) | 9 (1.5%) |
| 35 to 39 Years | 37 (5.6%) | 56 (9.2%) |
| 40 to 44 Years | 28 (4.2%) | 17 (2.8%) |
| 45 to 49 Years | 31 (4.6%) | 54 (8.9%) |
| 50 to 54 Years | 54 (8.1%) | 51 (8.4%) |
| 55 to 59 Years | 46 (6.9%) | 34 (5.6%) |
| 60 to 64 Years | 74 (11.1%) | 30 (5.0%) |
| 65 to 69 Years | 15 (2.2%) | 32 (5.3%) |
| 70 to 74 Years | 18 (2.7%) | 20 (3.3%) |
| 75 to 79 Years | 12 (1.8%) | 19 (3.1%) |
| 80 to 84 Years | 10 (1.5%) | 41 (6.8%) |
| 85 Years and over | 24 (3.6%) | 33 (5.4%) |
| Total | 667 (100.0%) | 606 (100.0%) |
Families and Households in South Whitley
Median Family Size in South Whitley
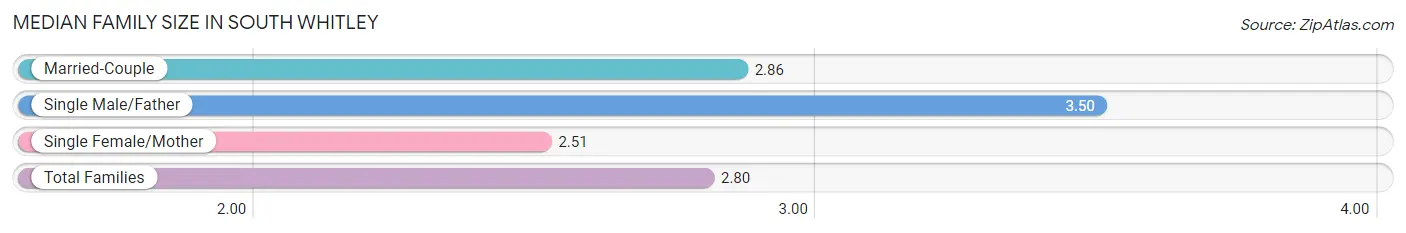
The median family size in South Whitley is 2.80 persons per family, with single male/father families (24 | 7.4%) accounting for the largest median family size of 3.5 persons per family. On the other hand, single female/mother families (96 | 29.4%) represent the smallest median family size with 2.51 persons per family.
| Family Type | # Families | Family Size |
| Married-Couple | 206 (63.2%) | 2.86 |
| Single Male/Father | 24 (7.4%) | 3.50 |
| Single Female/Mother | 96 (29.4%) | 2.51 |
| Total Families | 326 (100.0%) | 2.80 |
Median Household Size in South Whitley
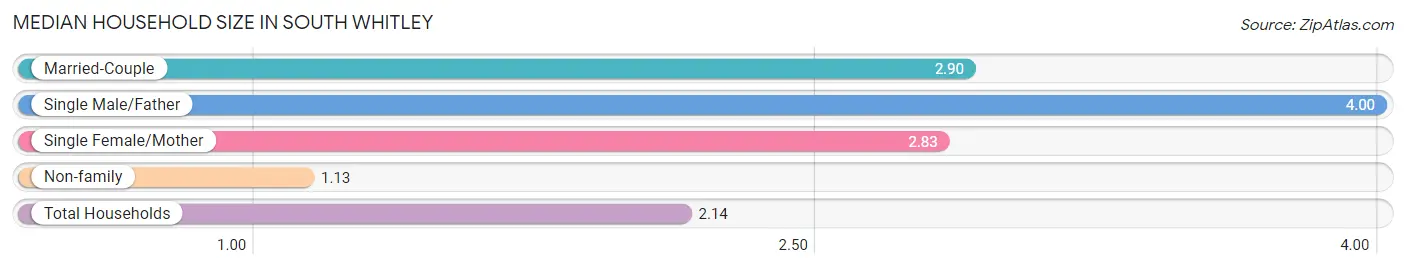
The median household size in South Whitley is 2.14 persons per household, with single male/father households (24 | 4.1%) accounting for the largest median household size of 4 persons per household. non-family households (264 | 44.8%) represent the smallest median household size with 1.13 persons per household.
| Household Type | # Households | Household Size |
| Married-Couple | 206 (34.9%) | 2.90 |
| Single Male/Father | 24 (4.1%) | 4.00 |
| Single Female/Mother | 96 (16.3%) | 2.83 |
| Non-family | 264 (44.8%) | 1.13 |
| Total Households | 590 (100.0%) | 2.14 |
Household Size by Marriage Status in South Whitley
Out of a total of 590 households in South Whitley, 326 (55.2%) are family households, while 264 (44.8%) are nonfamily households. The most numerous type of family households are 2-person households, comprising 126, and the most common type of nonfamily households are 1-person households, comprising 226.
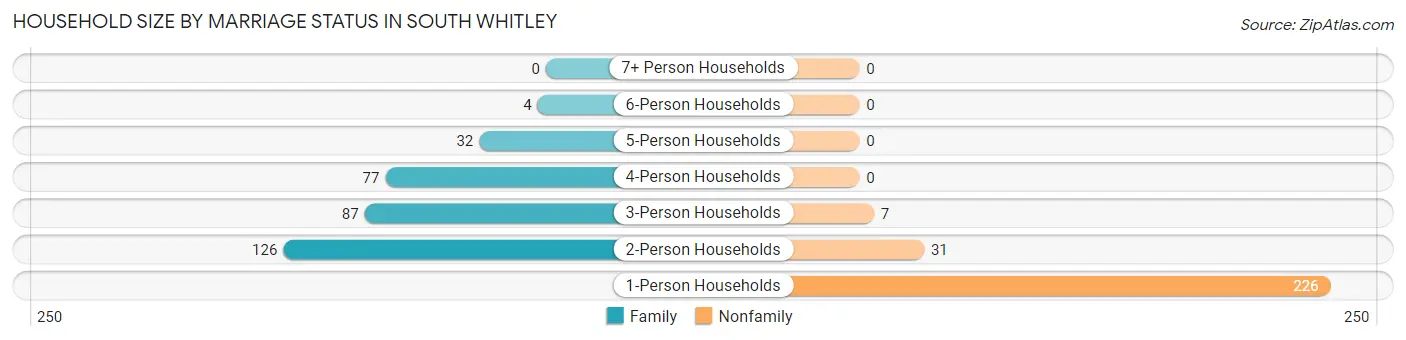
| Household Size | Family Households | Nonfamily Households |
| 1-Person Households | - | 226 (38.3%) |
| 2-Person Households | 126 (21.4%) | 31 (5.2%) |
| 3-Person Households | 87 (14.7%) | 7 (1.2%) |
| 4-Person Households | 77 (13.1%) | 0 (0.0%) |
| 5-Person Households | 32 (5.4%) | 0 (0.0%) |
| 6-Person Households | 4 (0.7%) | 0 (0.0%) |
| 7+ Person Households | 0 (0.0%) | 0 (0.0%) |
| Total | 326 (55.2%) | 264 (44.8%) |
Female Fertility in South Whitley
Fertility by Age in South Whitley
| Age Bracket | Women with Births | Births / 1,000 Women |
| 15 to 19 years | 0 (0.0%) | 0.0 |
| 20 to 34 years | 0 (0.0%) | 0.0 |
| 35 to 50 years | 0 (0.0%) | 0.0 |
| Total | 0 (0.0%) | 0.0 |
Fertility by Age by Marriage Status in South Whitley
| Age Bracket | Married | Unmarried |
| 15 to 19 years | 0 (0.0%) | 0 (0.0%) |
| 20 to 34 years | 0 (0.0%) | 0 (0.0%) |
| 35 to 50 years | 0 (0.0%) | 0 (0.0%) |
| Total | 0 (0.0%) | 0 (0.0%) |
Fertility by Education in South Whitley
| Educational Attainment | Women with Births | Births / 1,000 Women |
| Less than High School | 0 (0.0%) | 0.0 |
| High School Diploma | 0 (0.0%) | 0.0 |
| College or Associate's Degree | 0 (0.0%) | 0.0 |
| Bachelor's Degree | 0 (0.0%) | 0.0 |
| Graduate Degree | 0 (0.0%) | 0.0 |
| Total | 0 (0.0%) | 0.0 |
Fertility by Education by Marriage Status in South Whitley
| Educational Attainment | Married | Unmarried |
| Less than High School | 0 (0.0%) | 0 (0.0%) |
| High School Diploma | 0 (0.0%) | 0 (0.0%) |
| College or Associate's Degree | 0 (0.0%) | 0 (0.0%) |
| Bachelor's Degree | 0 (0.0%) | 0 (0.0%) |
| Graduate Degree | 0 (0.0%) | 0 (0.0%) |
| Total | 0 (0.0%) | 0 (0.0%) |
Employment Characteristics in South Whitley
Employment by Class of Employer in South Whitley
Among the 628 employed individuals in South Whitley, private company employees (522 | 83.1%), local government employees (37 | 5.9%), and not-for-profit organizations (29 | 4.6%) make up the most common classes of employment.
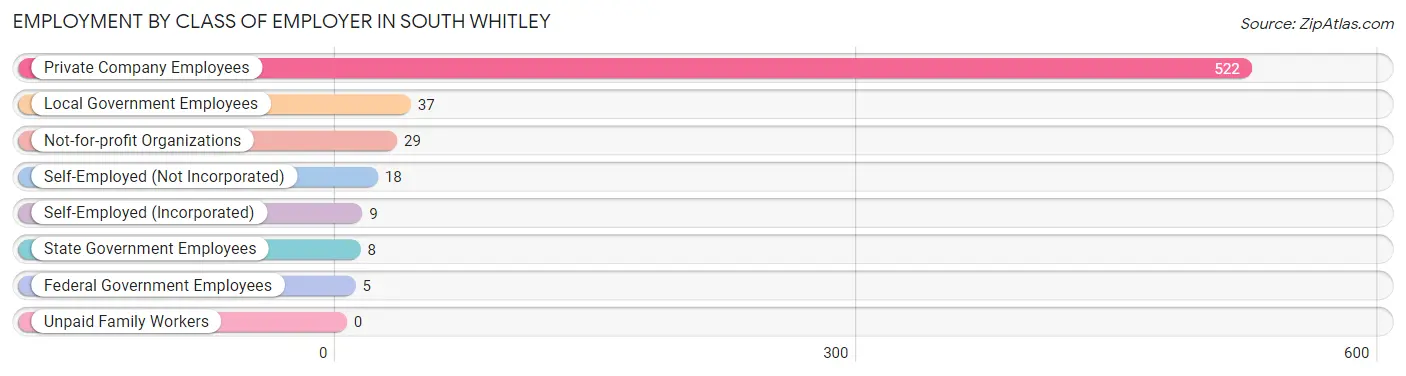
| Employer Class | # Employees | % Employees |
| Private Company Employees | 522 | 83.1% |
| Self-Employed (Incorporated) | 9 | 1.4% |
| Self-Employed (Not Incorporated) | 18 | 2.9% |
| Not-for-profit Organizations | 29 | 4.6% |
| Local Government Employees | 37 | 5.9% |
| State Government Employees | 8 | 1.3% |
| Federal Government Employees | 5 | 0.8% |
| Unpaid Family Workers | 0 | 0.0% |
| Total | 628 | 100.0% |
Employment Status by Age in South Whitley
According to the labor force statistics for South Whitley, out of the total population over 16 years of age (1,035), 66.2% or 685 individuals are in the labor force, with 7.6% or 52 of them unemployed. The age group with the highest labor force participation rate is 30 to 34 years, with 97.4% or 37 individuals in the labor force. Within the labor force, the 16 to 19 years age range has the highest percentage of unemployed individuals, with 73.9% or 34 of them being unemployed.
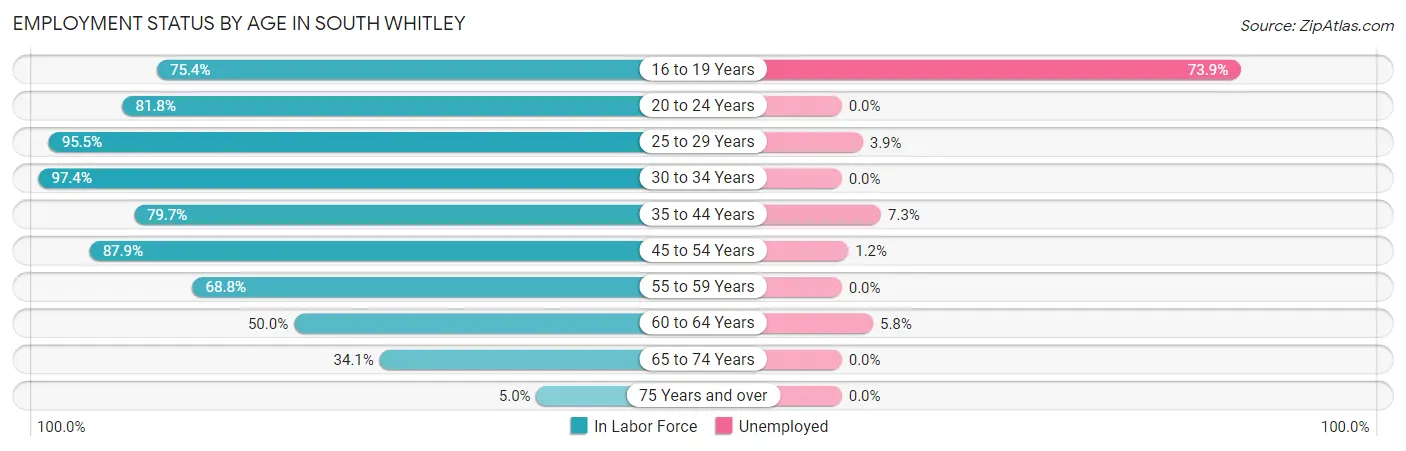
| Age Bracket | In Labor Force | Unemployed |
| 16 to 19 Years | 46 (75.4%) | 34 (73.9%) |
| 20 to 24 Years | 54 (81.8%) | 0 (0.0%) |
| 25 to 29 Years | 128 (95.5%) | 5 (3.9%) |
| 30 to 34 Years | 37 (97.4%) | 0 (0.0%) |
| 35 to 44 Years | 110 (79.7%) | 8 (7.3%) |
| 45 to 54 Years | 167 (87.9%) | 2 (1.2%) |
| 55 to 59 Years | 55 (68.8%) | 0 (0.0%) |
| 60 to 64 Years | 52 (50.0%) | 3 (5.8%) |
| 65 to 74 Years | 29 (34.1%) | 0 (0.0%) |
| 75 Years and over | 7 (5.0%) | 0 (0.0%) |
| Total | 685 (66.2%) | 52 (7.6%) |
Employment Status by Educational Attainment in South Whitley
According to labor force statistics for South Whitley, 80.3% of individuals (549) out of the total population between 25 and 64 years of age (684) are in the labor force, with 3.3% or 18 of them being unemployed. The group with the highest labor force participation rate are those with the educational attainment of bachelor's degree or higher, with 86.1% or 68 individuals in the labor force. Within the labor force, individuals with high school diploma education have the highest percentage of unemployment, with 5.6% or 17 of them being unemployed.
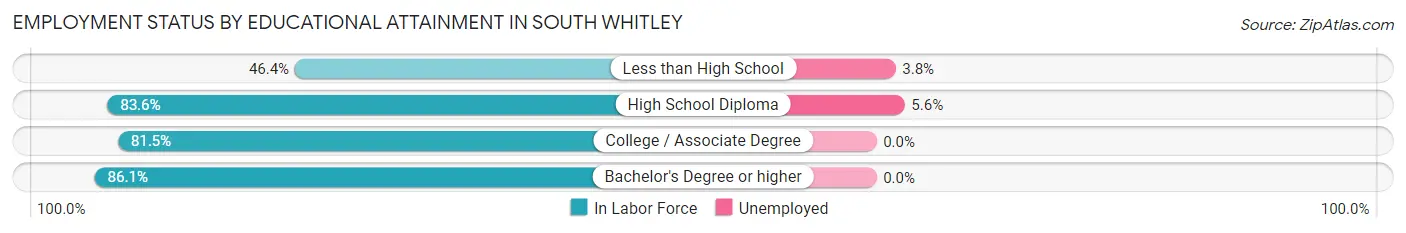
| Educational Attainment | In Labor Force | Unemployed |
| Less than High School | 26 (46.4%) | 2 (3.8%) |
| High School Diploma | 301 (83.6%) | 20 (5.6%) |
| College / Associate Degree | 154 (81.5%) | 0 (0.0%) |
| Bachelor's Degree or higher | 68 (86.1%) | 0 (0.0%) |
| Total | 549 (80.3%) | 23 (3.3%) |
Employment Occupations by Sex in South Whitley
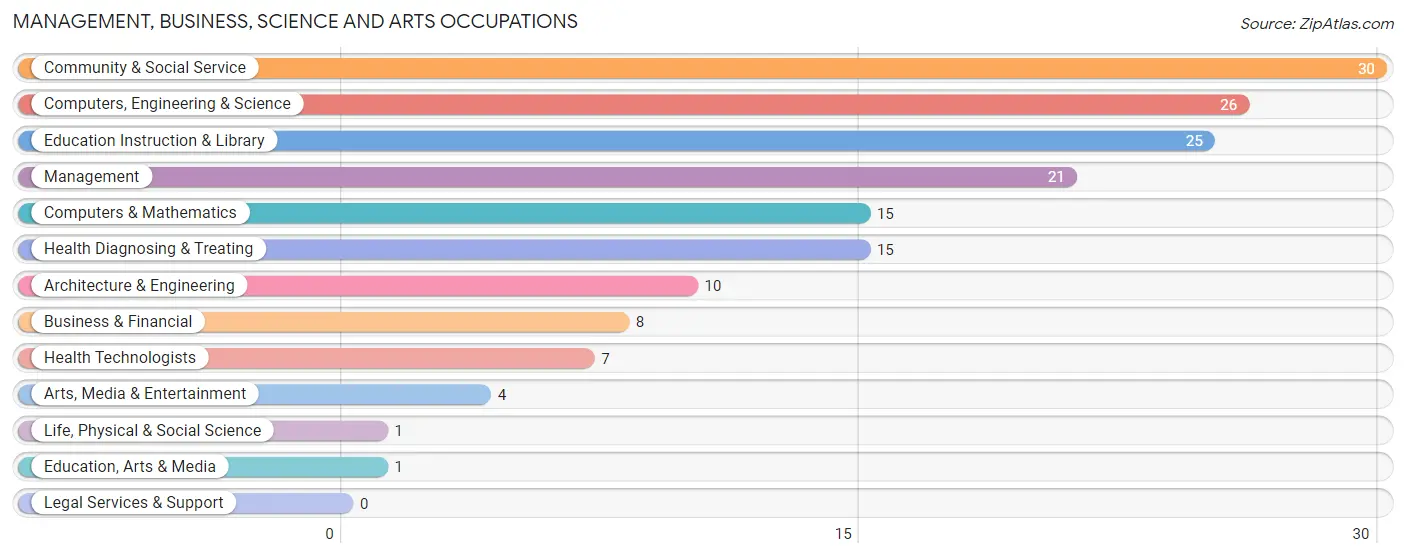
Management, Business, Science and Arts Occupations
The most common Management, Business, Science and Arts occupations in South Whitley are Community & Social Service (30 | 4.7%), Computers, Engineering & Science (26 | 4.1%), Education Instruction & Library (25 | 4.0%), Management (21 | 3.3%), and Computers & Mathematics (15 | 2.4%).
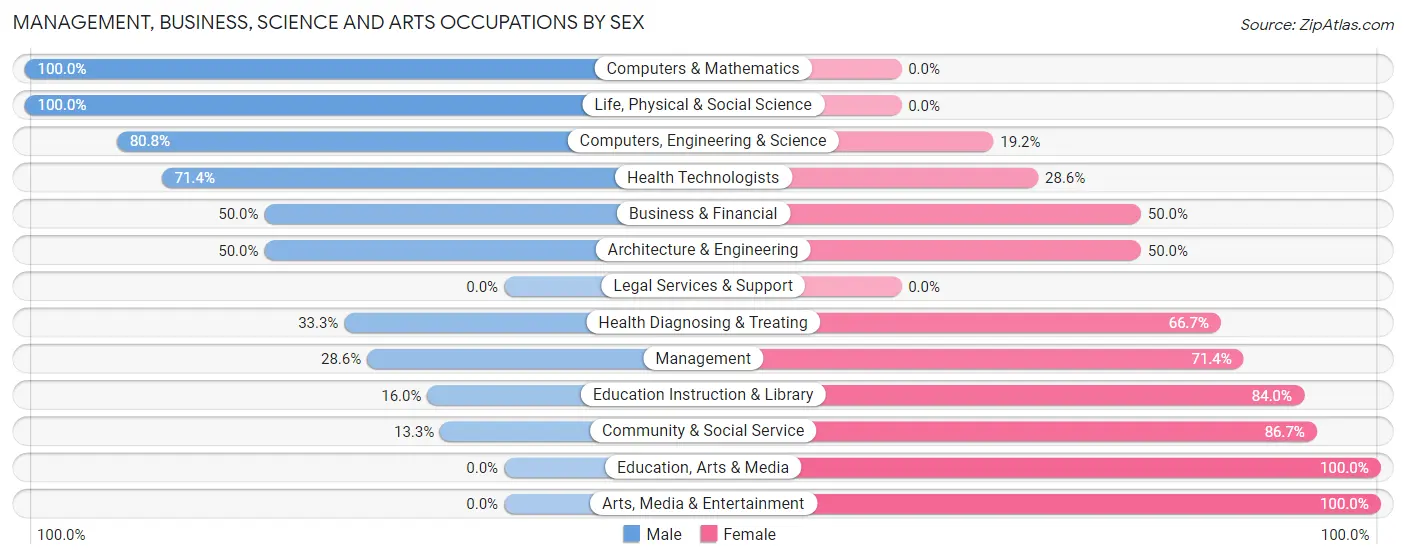
Management, Business, Science and Arts Occupations by Sex
Within the Management, Business, Science and Arts occupations in South Whitley, the most male-oriented occupations are Computers & Mathematics (100.0%), Life, Physical & Social Science (100.0%), and Computers, Engineering & Science (80.8%), while the most female-oriented occupations are Education, Arts & Media (100.0%), Arts, Media & Entertainment (100.0%), and Community & Social Service (86.7%).
| Occupation | Male | Female |
| Management | 6 (28.6%) | 15 (71.4%) |
| Business & Financial | 4 (50.0%) | 4 (50.0%) |
| Computers, Engineering & Science | 21 (80.8%) | 5 (19.2%) |
| Computers & Mathematics | 15 (100.0%) | 0 (0.0%) |
| Architecture & Engineering | 5 (50.0%) | 5 (50.0%) |
| Life, Physical & Social Science | 1 (100.0%) | 0 (0.0%) |
| Community & Social Service | 4 (13.3%) | 26 (86.7%) |
| Education, Arts & Media | 0 (0.0%) | 1 (100.0%) |
| Legal Services & Support | 0 (0.0%) | 0 (0.0%) |
| Education Instruction & Library | 4 (16.0%) | 21 (84.0%) |
| Arts, Media & Entertainment | 0 (0.0%) | 4 (100.0%) |
| Health Diagnosing & Treating | 5 (33.3%) | 10 (66.7%) |
| Health Technologists | 5 (71.4%) | 2 (28.6%) |
| Total (Category) | 40 (40.0%) | 60 (60.0%) |
| Total (Overall) | 353 (55.8%) | 280 (44.2%) |
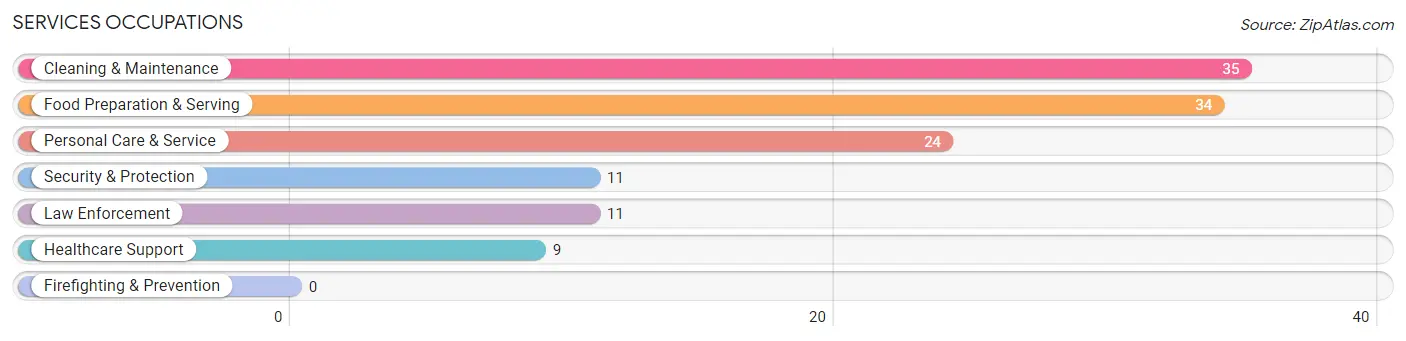
Services Occupations
The most common Services occupations in South Whitley are Cleaning & Maintenance (35 | 5.5%), Food Preparation & Serving (34 | 5.4%), Personal Care & Service (24 | 3.8%), Security & Protection (11 | 1.7%), and Law Enforcement (11 | 1.7%).
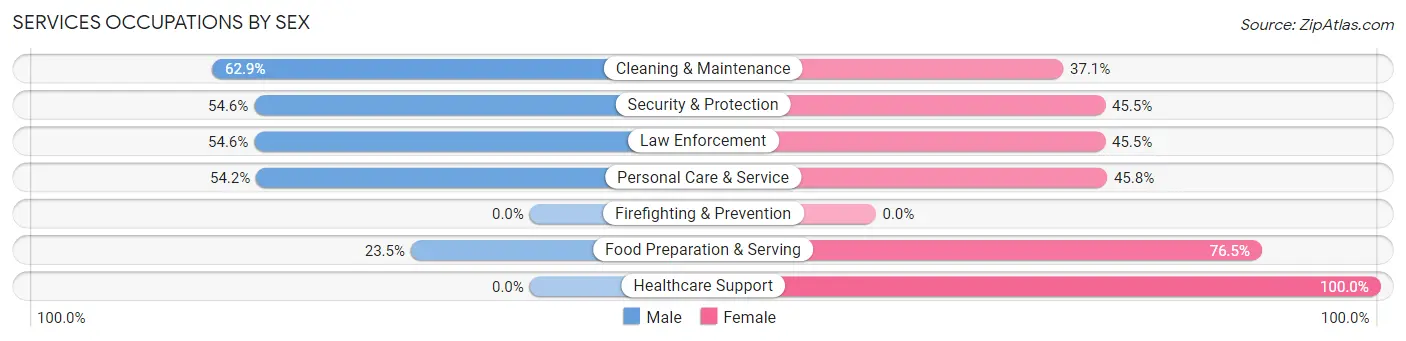
Services Occupations by Sex
Within the Services occupations in South Whitley, the most male-oriented occupations are Cleaning & Maintenance (62.9%), Security & Protection (54.5%), and Law Enforcement (54.5%), while the most female-oriented occupations are Healthcare Support (100.0%), Food Preparation & Serving (76.5%), and Personal Care & Service (45.8%).
| Occupation | Male | Female |
| Healthcare Support | 0 (0.0%) | 9 (100.0%) |
| Security & Protection | 6 (54.5%) | 5 (45.5%) |
| Firefighting & Prevention | 0 (0.0%) | 0 (0.0%) |
| Law Enforcement | 6 (54.5%) | 5 (45.5%) |
| Food Preparation & Serving | 8 (23.5%) | 26 (76.5%) |
| Cleaning & Maintenance | 22 (62.9%) | 13 (37.1%) |
| Personal Care & Service | 13 (54.2%) | 11 (45.8%) |
| Total (Category) | 49 (43.4%) | 64 (56.6%) |
| Total (Overall) | 353 (55.8%) | 280 (44.2%) |
Sales and Office Occupations
The most common Sales and Office occupations in South Whitley are Office & Administration (41 | 6.5%), and Sales & Related (38 | 6.0%).
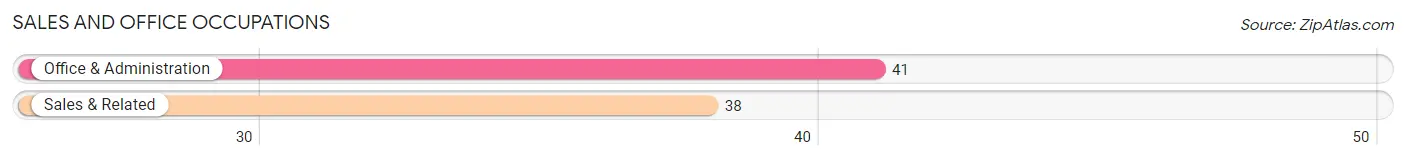
Sales and Office Occupations by Sex
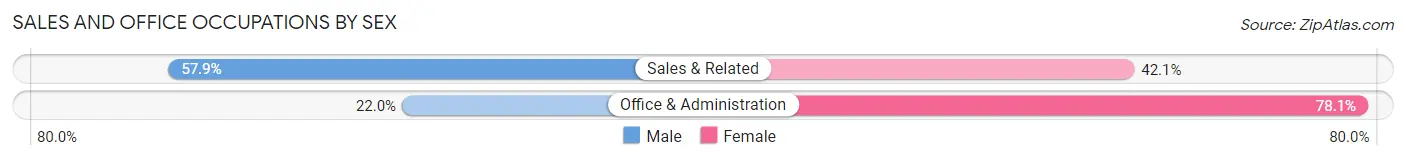
| Occupation | Male | Female |
| Sales & Related | 22 (57.9%) | 16 (42.1%) |
| Office & Administration | 9 (22.0%) | 32 (78.0%) |
| Total (Category) | 31 (39.2%) | 48 (60.8%) |
| Total (Overall) | 353 (55.8%) | 280 (44.2%) |
Natural Resources, Construction and Maintenance Occupations
The most common Natural Resources, Construction and Maintenance occupations in South Whitley are Installation, Maintenance & Repair (33 | 5.2%), Construction & Extraction (30 | 4.7%), and Farming, Fishing & Forestry (2 | 0.3%).
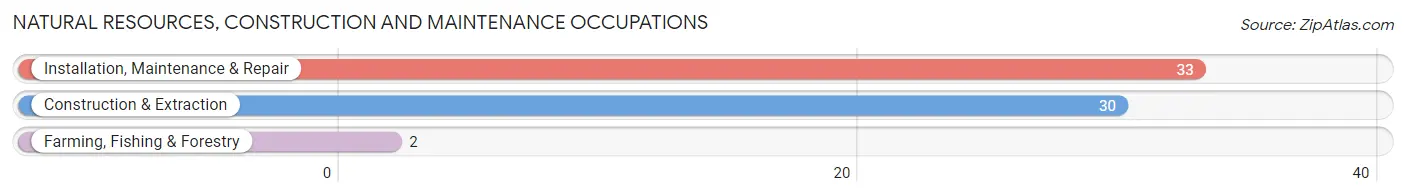
Natural Resources, Construction and Maintenance Occupations by Sex
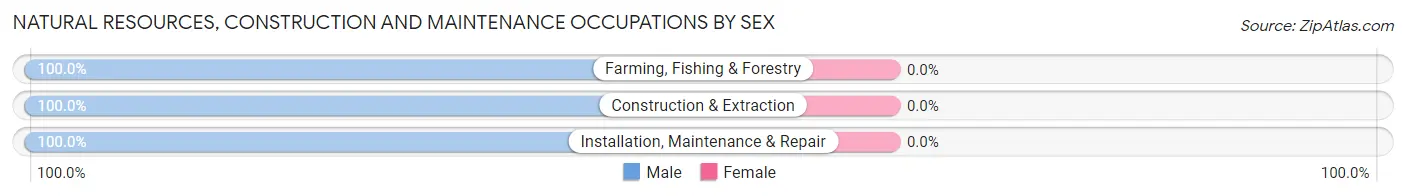
| Occupation | Male | Female |
| Farming, Fishing & Forestry | 2 (100.0%) | 0 (0.0%) |
| Construction & Extraction | 30 (100.0%) | 0 (0.0%) |
| Installation, Maintenance & Repair | 33 (100.0%) | 0 (0.0%) |
| Total (Category) | 65 (100.0%) | 0 (0.0%) |
| Total (Overall) | 353 (55.8%) | 280 (44.2%) |
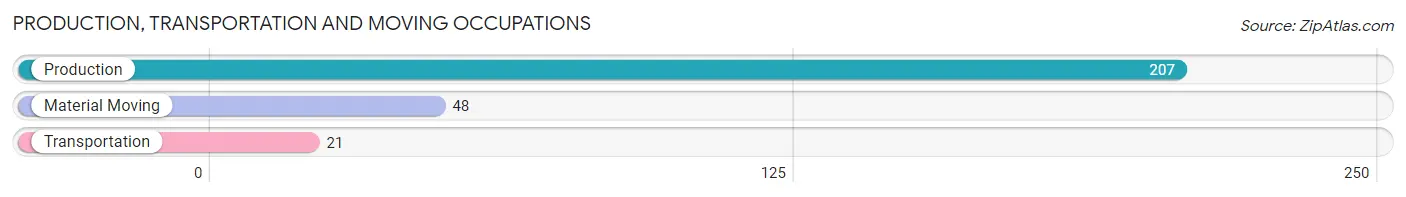
Production, Transportation and Moving Occupations
The most common Production, Transportation and Moving occupations in South Whitley are Production (207 | 32.7%), Material Moving (48 | 7.6%), and Transportation (21 | 3.3%).
Production, Transportation and Moving Occupations by Sex
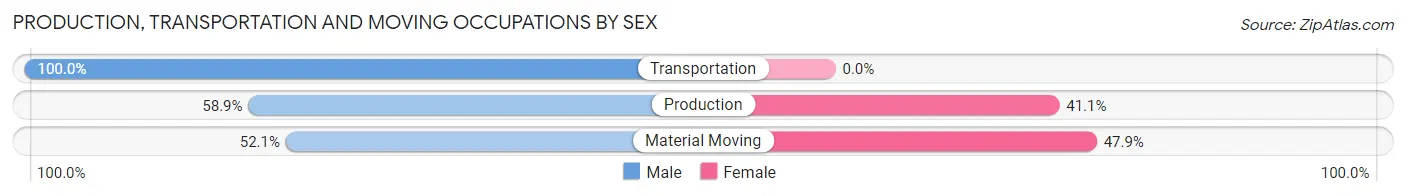
| Occupation | Male | Female |
| Production | 122 (58.9%) | 85 (41.1%) |
| Transportation | 21 (100.0%) | 0 (0.0%) |
| Material Moving | 25 (52.1%) | 23 (47.9%) |
| Total (Category) | 168 (60.9%) | 108 (39.1%) |
| Total (Overall) | 353 (55.8%) | 280 (44.2%) |
Employment Industries by Sex in South Whitley
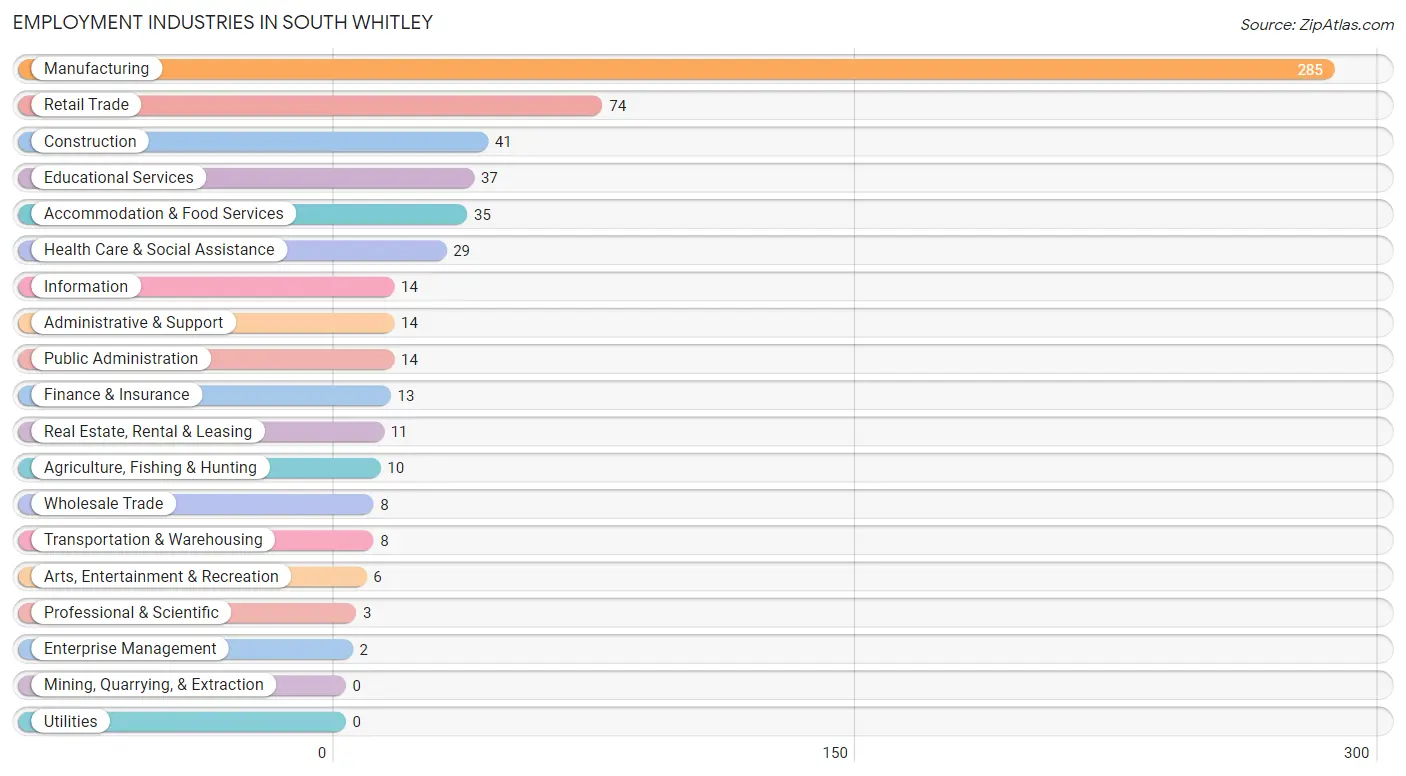
Employment Industries in South Whitley
The major employment industries in South Whitley include Manufacturing (285 | 45.0%), Retail Trade (74 | 11.7%), Construction (41 | 6.5%), Educational Services (37 | 5.9%), and Accommodation & Food Services (35 | 5.5%).
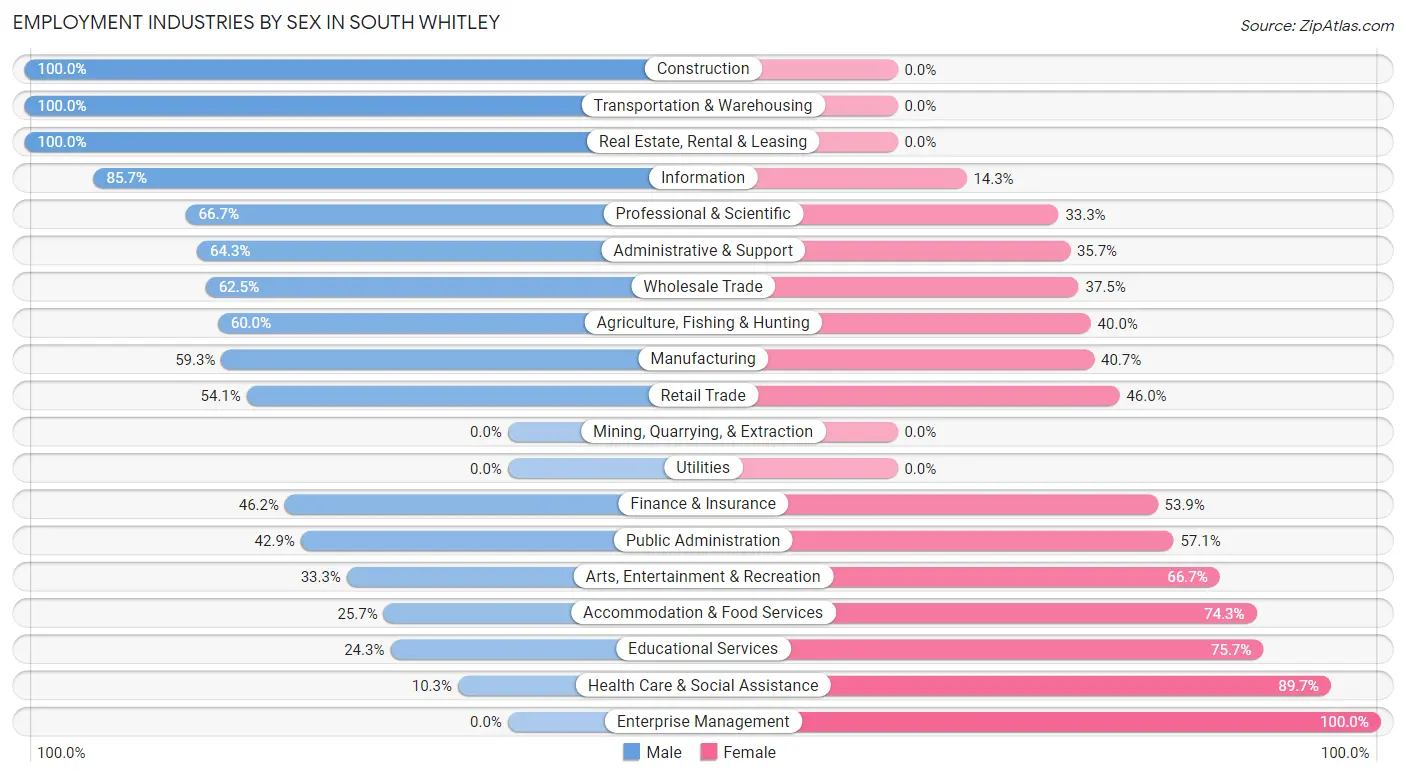
Employment Industries by Sex in South Whitley
The South Whitley industries that see more men than women are Construction (100.0%), Transportation & Warehousing (100.0%), and Real Estate, Rental & Leasing (100.0%), whereas the industries that tend to have a higher number of women are Enterprise Management (100.0%), Health Care & Social Assistance (89.7%), and Educational Services (75.7%).
| Industry | Male | Female |
| Agriculture, Fishing & Hunting | 6 (60.0%) | 4 (40.0%) |
| Mining, Quarrying, & Extraction | 0 (0.0%) | 0 (0.0%) |
| Construction | 41 (100.0%) | 0 (0.0%) |
| Manufacturing | 169 (59.3%) | 116 (40.7%) |
| Wholesale Trade | 5 (62.5%) | 3 (37.5%) |
| Retail Trade | 40 (54.0%) | 34 (46.0%) |
| Transportation & Warehousing | 8 (100.0%) | 0 (0.0%) |
| Utilities | 0 (0.0%) | 0 (0.0%) |
| Information | 12 (85.7%) | 2 (14.3%) |
| Finance & Insurance | 6 (46.2%) | 7 (53.8%) |
| Real Estate, Rental & Leasing | 11 (100.0%) | 0 (0.0%) |
| Professional & Scientific | 2 (66.7%) | 1 (33.3%) |
| Enterprise Management | 0 (0.0%) | 2 (100.0%) |
| Administrative & Support | 9 (64.3%) | 5 (35.7%) |
| Educational Services | 9 (24.3%) | 28 (75.7%) |
| Health Care & Social Assistance | 3 (10.3%) | 26 (89.7%) |
| Arts, Entertainment & Recreation | 2 (33.3%) | 4 (66.7%) |
| Accommodation & Food Services | 9 (25.7%) | 26 (74.3%) |
| Public Administration | 6 (42.9%) | 8 (57.1%) |
| Total | 353 (55.8%) | 280 (44.2%) |
Education in South Whitley
School Enrollment in South Whitley
The most common levels of schooling among the 267 students in South Whitley are high school (81 | 30.3%), elementary school (49 | 18.3%), and college / undergraduate (46 | 17.2%).
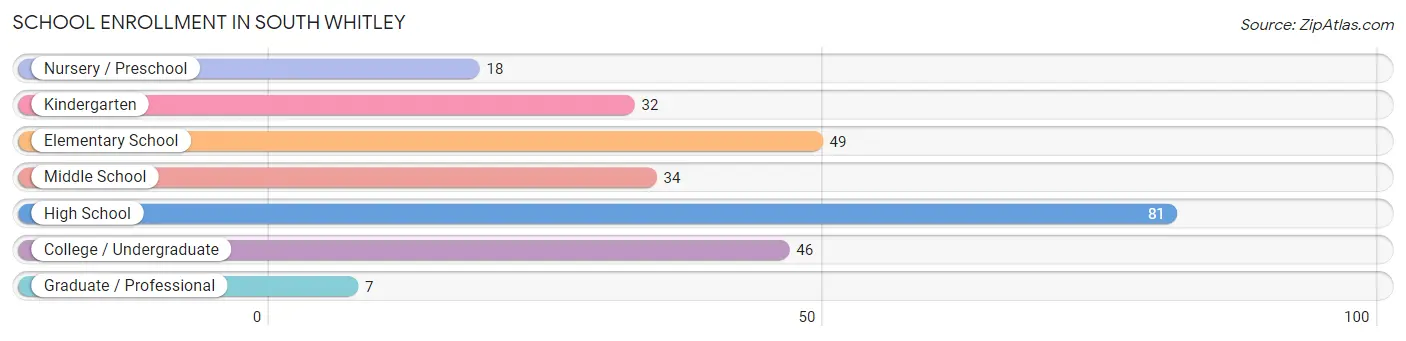
| School Level | # Students | % Students |
| Nursery / Preschool | 18 | 6.7% |
| Kindergarten | 32 | 12.0% |
| Elementary School | 49 | 18.3% |
| Middle School | 34 | 12.7% |
| High School | 81 | 30.3% |
| College / Undergraduate | 46 | 17.2% |
| Graduate / Professional | 7 | 2.6% |
| Total | 267 | 100.0% |
School Enrollment by Age by Funding Source in South Whitley
Out of a total of 267 students who are enrolled in schools in South Whitley, 26 (9.7%) attend a private institution, while the remaining 241 (90.3%) are enrolled in public schools. The age group of 35 years and over has the highest likelihood of being enrolled in private schools, with 5 (35.7% in the age bracket) enrolled. Conversely, the age group of 3 to 4 year olds has the lowest likelihood of being enrolled in a private school, with 3 (100.0% in the age bracket) attending a public institution.
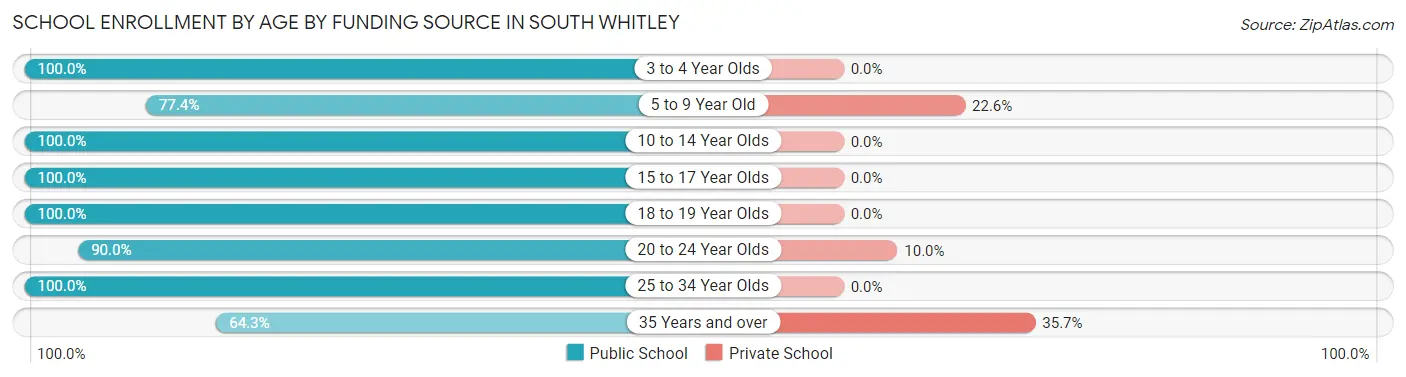
| Age Bracket | Public School | Private School |
| 3 to 4 Year Olds | 3 (100.0%) | 0 (0.0%) |
| 5 to 9 Year Old | 65 (77.4%) | 19 (22.6%) |
| 10 to 14 Year Olds | 55 (100.0%) | 0 (0.0%) |
| 15 to 17 Year Olds | 58 (100.0%) | 0 (0.0%) |
| 18 to 19 Year Olds | 11 (100.0%) | 0 (0.0%) |
| 20 to 24 Year Olds | 18 (90.0%) | 2 (10.0%) |
| 25 to 34 Year Olds | 22 (100.0%) | 0 (0.0%) |
| 35 Years and over | 9 (64.3%) | 5 (35.7%) |
| Total | 241 (90.3%) | 26 (9.7%) |
Educational Attainment by Field of Study in South Whitley
Education (35 | 31.5%), science & technology (20 | 18.0%), business (19 | 17.1%), social sciences (9 | 8.1%), and arts & humanities (8 | 7.2%) are the most common fields of study among 111 individuals in South Whitley who have obtained a bachelor's degree or higher.
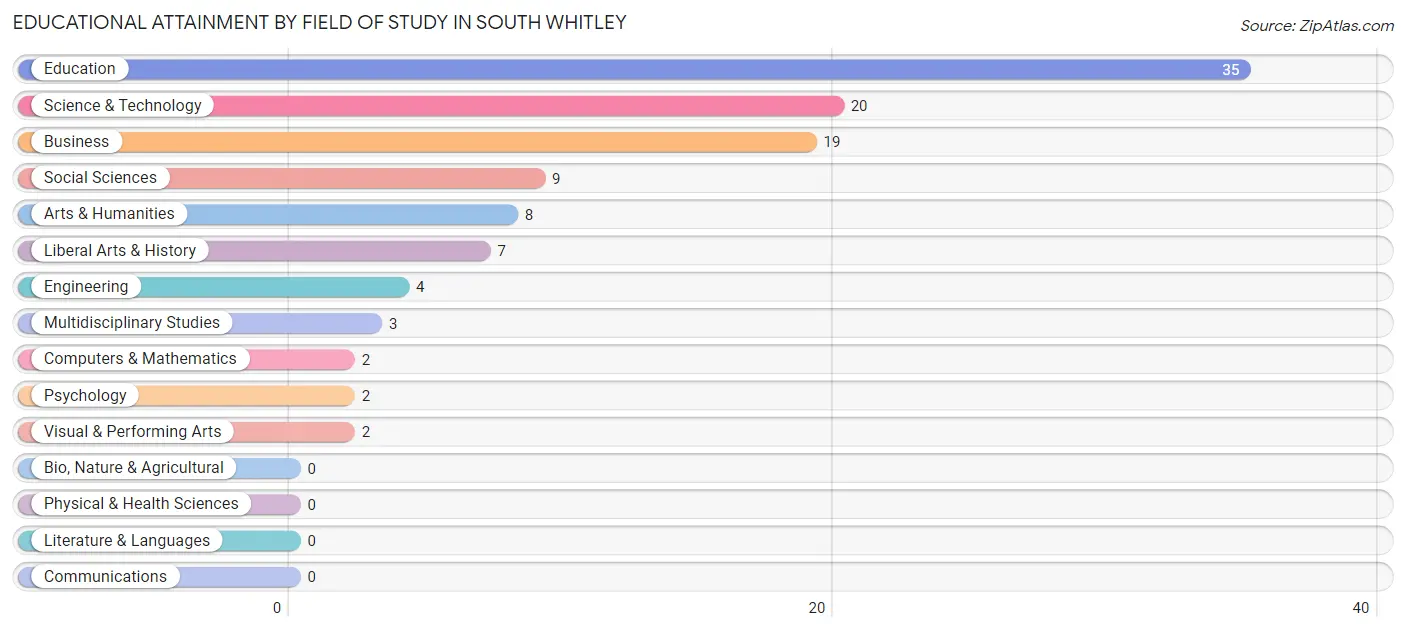
| Field of Study | # Graduates | % Graduates |
| Computers & Mathematics | 2 | 1.8% |
| Bio, Nature & Agricultural | 0 | 0.0% |
| Physical & Health Sciences | 0 | 0.0% |
| Psychology | 2 | 1.8% |
| Social Sciences | 9 | 8.1% |
| Engineering | 4 | 3.6% |
| Multidisciplinary Studies | 3 | 2.7% |
| Science & Technology | 20 | 18.0% |
| Business | 19 | 17.1% |
| Education | 35 | 31.5% |
| Literature & Languages | 0 | 0.0% |
| Liberal Arts & History | 7 | 6.3% |
| Visual & Performing Arts | 2 | 1.8% |
| Communications | 0 | 0.0% |
| Arts & Humanities | 8 | 7.2% |
| Total | 111 | 100.0% |
Transportation & Commute in South Whitley
Vehicle Availability by Sex in South Whitley
The most prevalent vehicle ownership categories in South Whitley are males with 2 vehicles (174, accounting for 49.9%) and females with 2 vehicles (154, making up 62.4%).
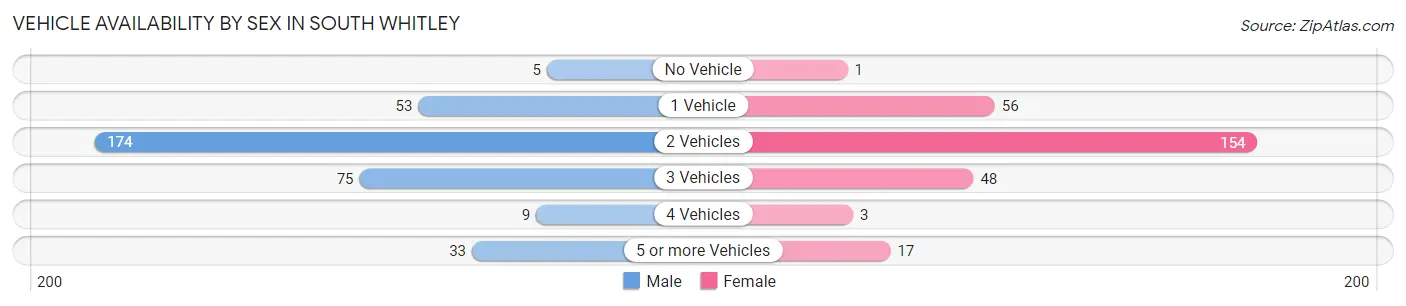
| Vehicles Available | Male | Female |
| No Vehicle | 5 (1.4%) | 1 (0.4%) |
| 1 Vehicle | 53 (15.2%) | 56 (20.1%) |
| 2 Vehicles | 174 (49.9%) | 154 (55.2%) |
| 3 Vehicles | 75 (21.5%) | 48 (17.2%) |
| 4 Vehicles | 9 (2.6%) | 3 (1.1%) |
| 5 or more Vehicles | 33 (9.5%) | 17 (6.1%) |
| Total | 349 (100.0%) | 279 (100.0%) |
Commute Time in South Whitley
The most frequently occuring commute durations in South Whitley are 20 to 24 minutes (143 commuters, 23.1%), 30 to 34 minutes (95 commuters, 15.3%), and 15 to 19 minutes (77 commuters, 12.4%).
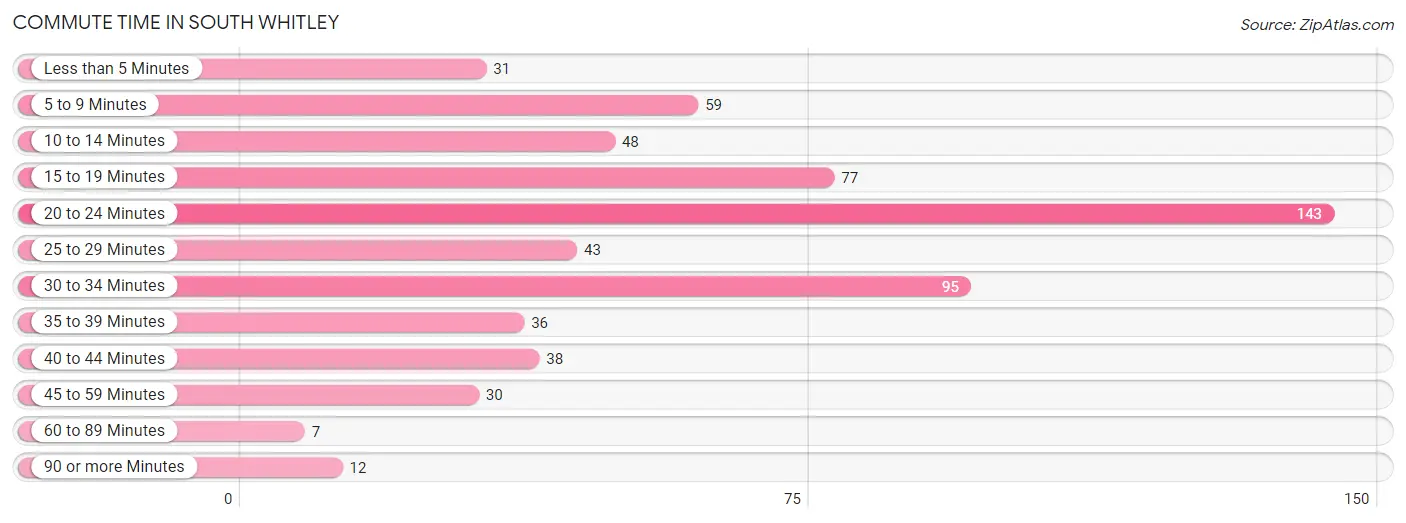
| Commute Time | # Commuters | % Commuters |
| Less than 5 Minutes | 31 | 5.0% |
| 5 to 9 Minutes | 59 | 9.5% |
| 10 to 14 Minutes | 48 | 7.7% |
| 15 to 19 Minutes | 77 | 12.4% |
| 20 to 24 Minutes | 143 | 23.1% |
| 25 to 29 Minutes | 43 | 7.0% |
| 30 to 34 Minutes | 95 | 15.3% |
| 35 to 39 Minutes | 36 | 5.8% |
| 40 to 44 Minutes | 38 | 6.1% |
| 45 to 59 Minutes | 30 | 4.9% |
| 60 to 89 Minutes | 7 | 1.1% |
| 90 or more Minutes | 12 | 1.9% |
Commute Time by Sex in South Whitley
The most common commute times in South Whitley are 20 to 24 minutes (77 commuters, 22.3%) for males and 30 to 34 minutes (72 commuters, 26.4%) for females.
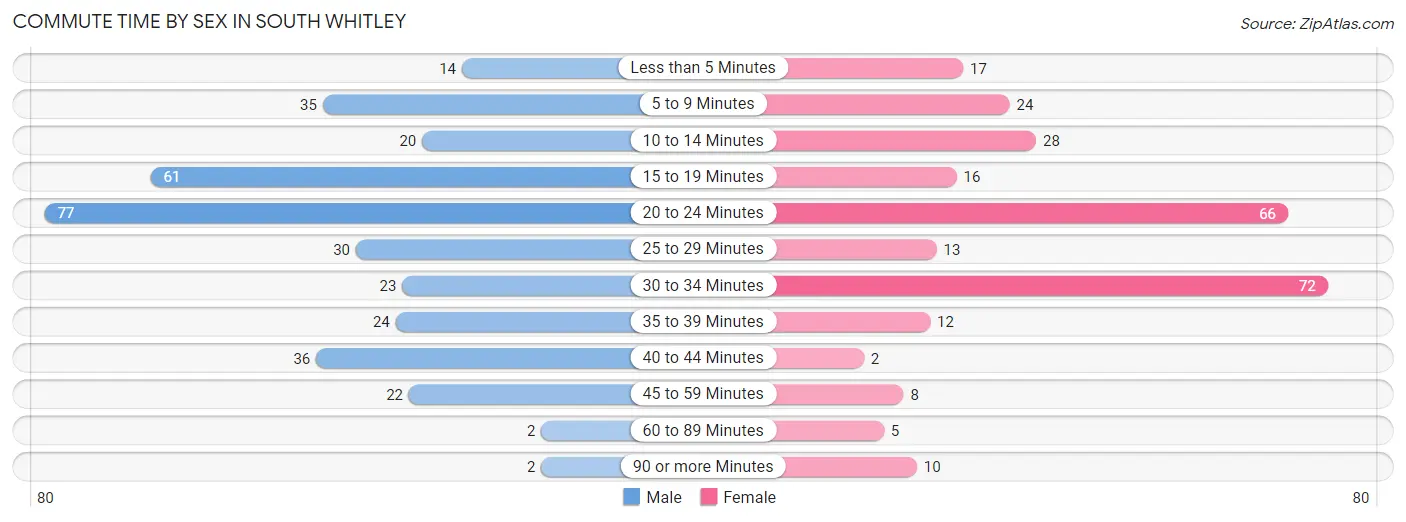
| Commute Time | Male | Female |
| Less than 5 Minutes | 14 (4.1%) | 17 (6.2%) |
| 5 to 9 Minutes | 35 (10.1%) | 24 (8.8%) |
| 10 to 14 Minutes | 20 (5.8%) | 28 (10.3%) |
| 15 to 19 Minutes | 61 (17.6%) | 16 (5.9%) |
| 20 to 24 Minutes | 77 (22.3%) | 66 (24.2%) |
| 25 to 29 Minutes | 30 (8.7%) | 13 (4.8%) |
| 30 to 34 Minutes | 23 (6.7%) | 72 (26.4%) |
| 35 to 39 Minutes | 24 (6.9%) | 12 (4.4%) |
| 40 to 44 Minutes | 36 (10.4%) | 2 (0.7%) |
| 45 to 59 Minutes | 22 (6.4%) | 8 (2.9%) |
| 60 to 89 Minutes | 2 (0.6%) | 5 (1.8%) |
| 90 or more Minutes | 2 (0.6%) | 10 (3.7%) |
Time of Departure to Work by Sex in South Whitley
The most frequent times of departure to work in South Whitley are 4:00 PM to 11:59 PM (67, 19.4%) for males and 12:00 PM to 3:59 PM (44, 16.1%) for females.
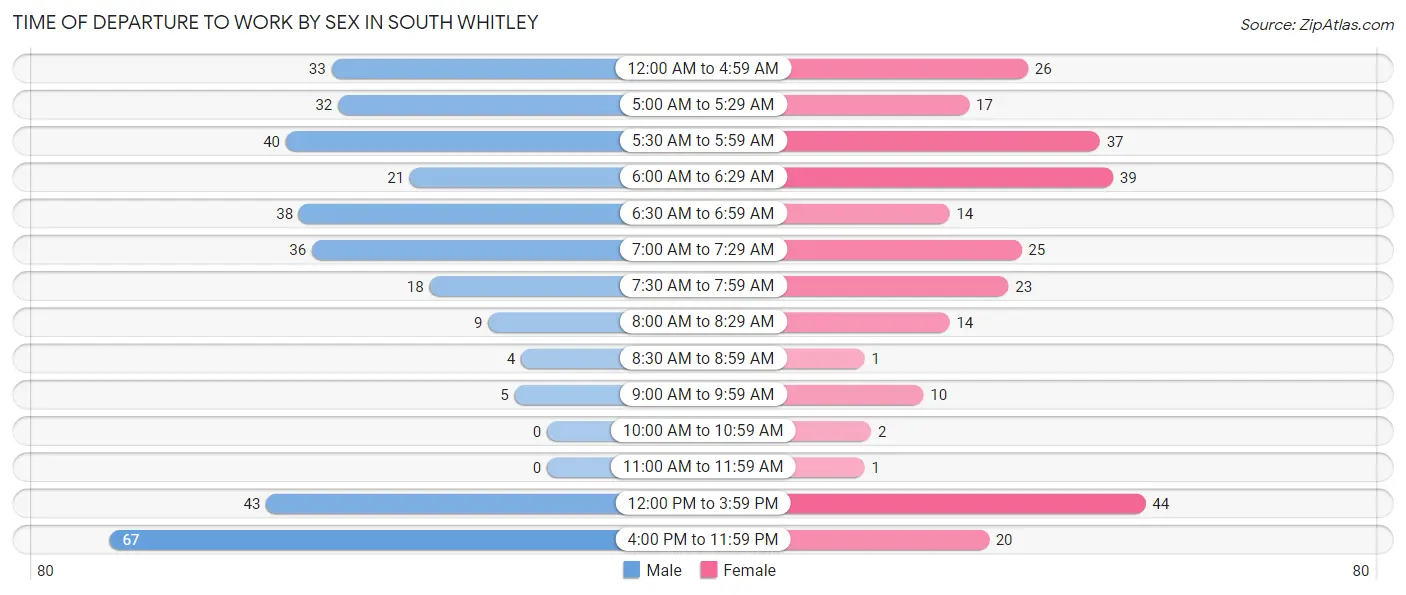
| Time of Departure | Male | Female |
| 12:00 AM to 4:59 AM | 33 (9.5%) | 26 (9.5%) |
| 5:00 AM to 5:29 AM | 32 (9.2%) | 17 (6.2%) |
| 5:30 AM to 5:59 AM | 40 (11.6%) | 37 (13.6%) |
| 6:00 AM to 6:29 AM | 21 (6.1%) | 39 (14.3%) |
| 6:30 AM to 6:59 AM | 38 (11.0%) | 14 (5.1%) |
| 7:00 AM to 7:29 AM | 36 (10.4%) | 25 (9.2%) |
| 7:30 AM to 7:59 AM | 18 (5.2%) | 23 (8.4%) |
| 8:00 AM to 8:29 AM | 9 (2.6%) | 14 (5.1%) |
| 8:30 AM to 8:59 AM | 4 (1.2%) | 1 (0.4%) |
| 9:00 AM to 9:59 AM | 5 (1.5%) | 10 (3.7%) |
| 10:00 AM to 10:59 AM | 0 (0.0%) | 2 (0.7%) |
| 11:00 AM to 11:59 AM | 0 (0.0%) | 1 (0.4%) |
| 12:00 PM to 3:59 PM | 43 (12.4%) | 44 (16.1%) |
| 4:00 PM to 11:59 PM | 67 (19.4%) | 20 (7.3%) |
| Total | 346 (100.0%) | 273 (100.0%) |
Housing Occupancy in South Whitley
Occupancy by Ownership in South Whitley
Of the total 590 dwellings in South Whitley, owner-occupied units account for 478 (81.0%), while renter-occupied units make up 112 (19.0%).
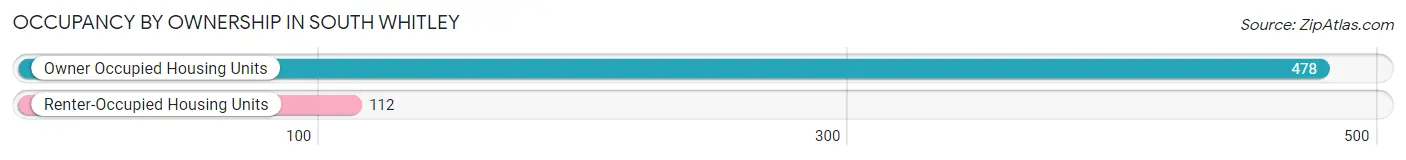
| Occupancy | # Housing Units | % Housing Units |
| Owner Occupied Housing Units | 478 | 81.0% |
| Renter-Occupied Housing Units | 112 | 19.0% |
| Total Occupied Housing Units | 590 | 100.0% |
Occupancy by Household Size in South Whitley
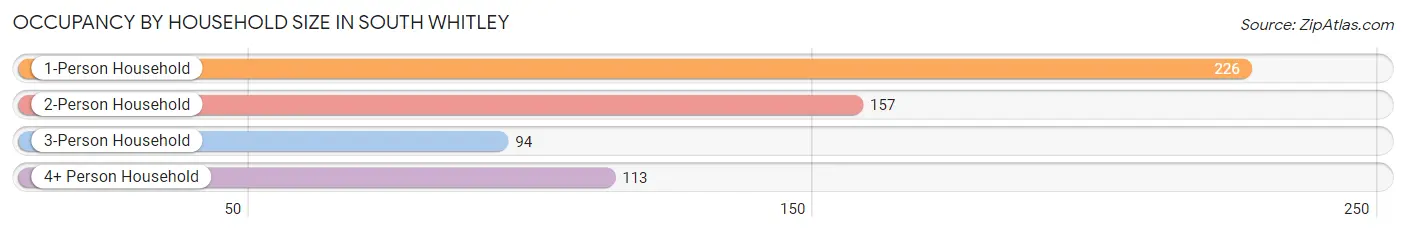
| Household Size | # Housing Units | % Housing Units |
| 1-Person Household | 226 | 38.3% |
| 2-Person Household | 157 | 26.6% |
| 3-Person Household | 94 | 15.9% |
| 4+ Person Household | 113 | 19.2% |
| Total Housing Units | 590 | 100.0% |
Occupancy by Ownership by Household Size in South Whitley
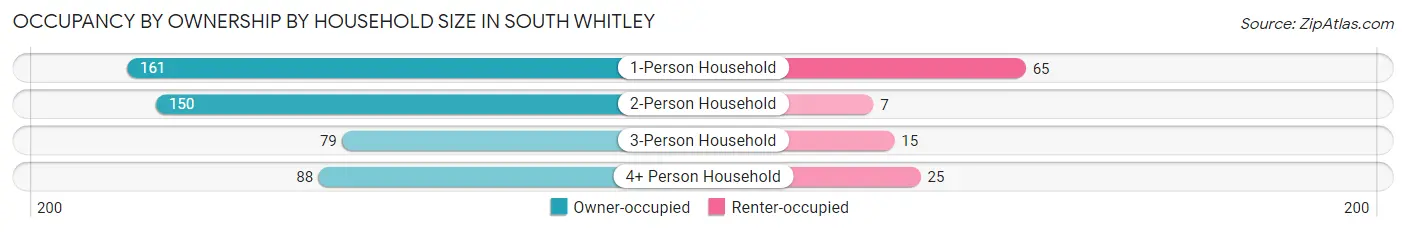
| Household Size | Owner-occupied | Renter-occupied |
| 1-Person Household | 161 (71.2%) | 65 (28.8%) |
| 2-Person Household | 150 (95.5%) | 7 (4.5%) |
| 3-Person Household | 79 (84.0%) | 15 (16.0%) |
| 4+ Person Household | 88 (77.9%) | 25 (22.1%) |
| Total Housing Units | 478 (81.0%) | 112 (19.0%) |
Occupancy by Educational Attainment in South Whitley
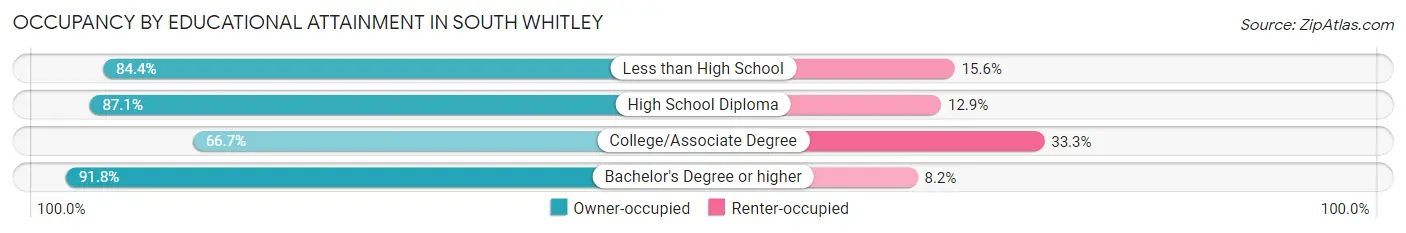
| Household Size | Owner-occupied | Renter-occupied |
| Less than High School | 65 (84.4%) | 12 (15.6%) |
| High School Diploma | 237 (87.1%) | 35 (12.9%) |
| College/Associate Degree | 120 (66.7%) | 60 (33.3%) |
| Bachelor's Degree or higher | 56 (91.8%) | 5 (8.2%) |
Occupancy by Age of Householder in South Whitley
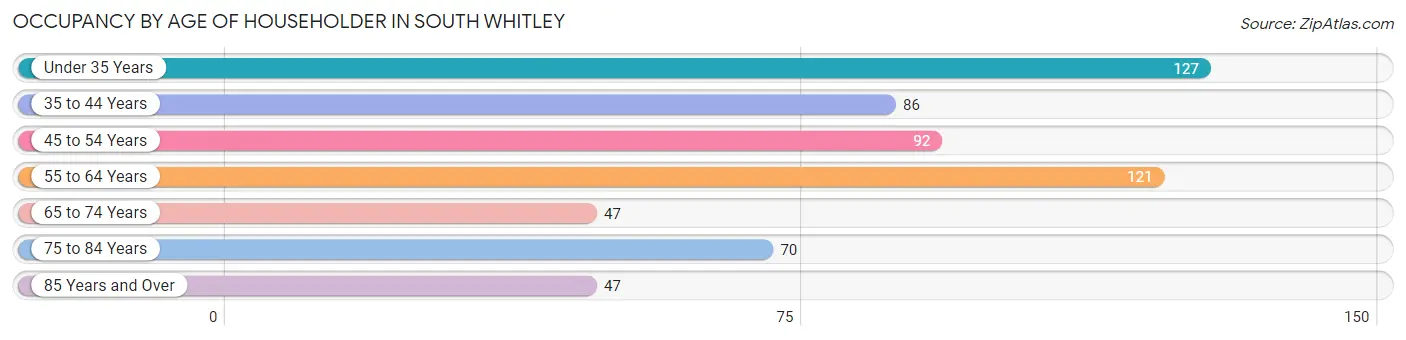
| Age Bracket | # Households | % Households |
| Under 35 Years | 127 | 21.5% |
| 35 to 44 Years | 86 | 14.6% |
| 45 to 54 Years | 92 | 15.6% |
| 55 to 64 Years | 121 | 20.5% |
| 65 to 74 Years | 47 | 8.0% |
| 75 to 84 Years | 70 | 11.9% |
| 85 Years and Over | 47 | 8.0% |
| Total | 590 | 100.0% |
Housing Finances in South Whitley
Median Income by Occupancy in South Whitley
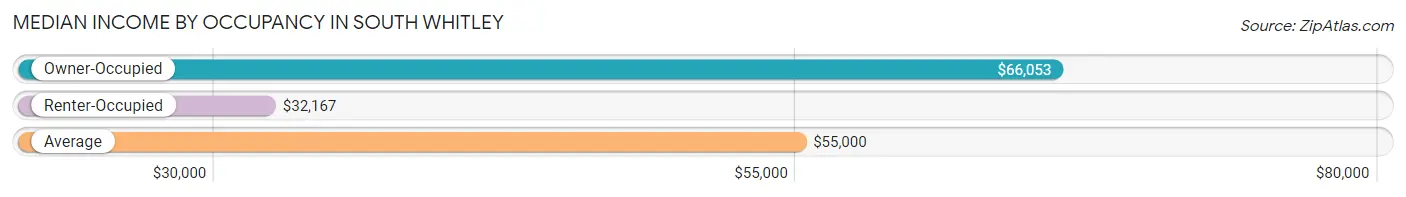
| Occupancy Type | # Households | Median Income |
| Owner-Occupied | 478 (81.0%) | $66,053 |
| Renter-Occupied | 112 (19.0%) | $32,167 |
| Average | 590 (100.0%) | $55,000 |
Occupancy by Householder Income Bracket in South Whitley
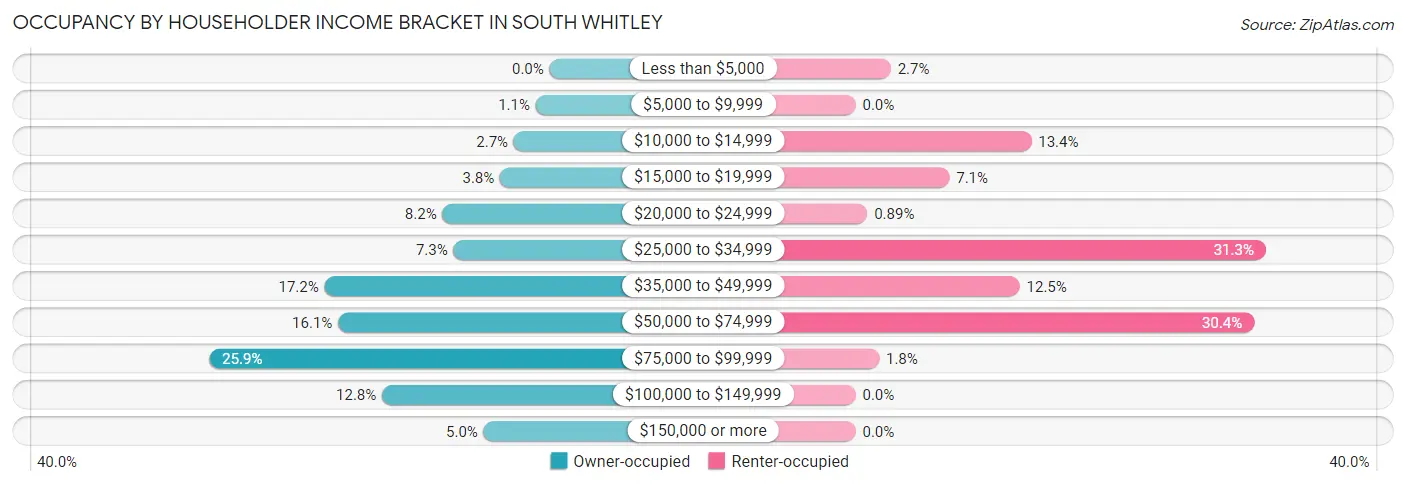
| Income Bracket | Owner-occupied | Renter-occupied |
| Less than $5,000 | 0 (0.0%) | 3 (2.7%) |
| $5,000 to $9,999 | 5 (1.1%) | 0 (0.0%) |
| $10,000 to $14,999 | 13 (2.7%) | 15 (13.4%) |
| $15,000 to $19,999 | 18 (3.8%) | 8 (7.1%) |
| $20,000 to $24,999 | 39 (8.2%) | 1 (0.9%) |
| $25,000 to $34,999 | 35 (7.3%) | 35 (31.2%) |
| $35,000 to $49,999 | 82 (17.2%) | 14 (12.5%) |
| $50,000 to $74,999 | 77 (16.1%) | 34 (30.4%) |
| $75,000 to $99,999 | 124 (25.9%) | 2 (1.8%) |
| $100,000 to $149,999 | 61 (12.8%) | 0 (0.0%) |
| $150,000 or more | 24 (5.0%) | 0 (0.0%) |
| Total | 478 (100.0%) | 112 (100.0%) |
Monthly Housing Cost Tiers in South Whitley
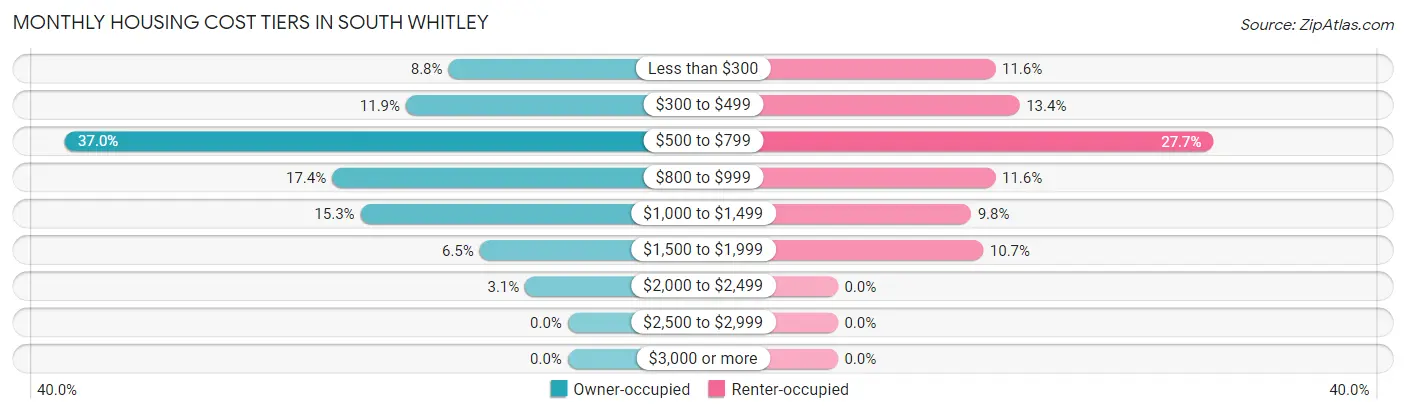
| Monthly Cost | Owner-occupied | Renter-occupied |
| Less than $300 | 42 (8.8%) | 13 (11.6%) |
| $300 to $499 | 57 (11.9%) | 15 (13.4%) |
| $500 to $799 | 177 (37.0%) | 31 (27.7%) |
| $800 to $999 | 83 (17.4%) | 13 (11.6%) |
| $1,000 to $1,499 | 73 (15.3%) | 11 (9.8%) |
| $1,500 to $1,999 | 31 (6.5%) | 12 (10.7%) |
| $2,000 to $2,499 | 15 (3.1%) | 0 (0.0%) |
| $2,500 to $2,999 | 0 (0.0%) | 0 (0.0%) |
| $3,000 or more | 0 (0.0%) | 0 (0.0%) |
| Total | 478 (100.0%) | 112 (100.0%) |
Physical Housing Characteristics in South Whitley
Housing Structures in South Whitley
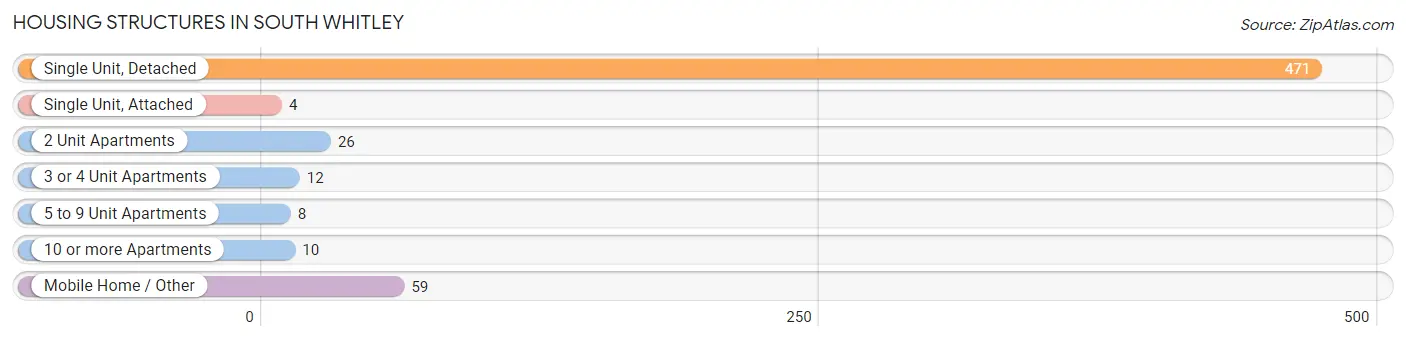
| Structure Type | # Housing Units | % Housing Units |
| Single Unit, Detached | 471 | 79.8% |
| Single Unit, Attached | 4 | 0.7% |
| 2 Unit Apartments | 26 | 4.4% |
| 3 or 4 Unit Apartments | 12 | 2.0% |
| 5 to 9 Unit Apartments | 8 | 1.4% |
| 10 or more Apartments | 10 | 1.7% |
| Mobile Home / Other | 59 | 10.0% |
| Total | 590 | 100.0% |
Housing Structures by Occupancy in South Whitley
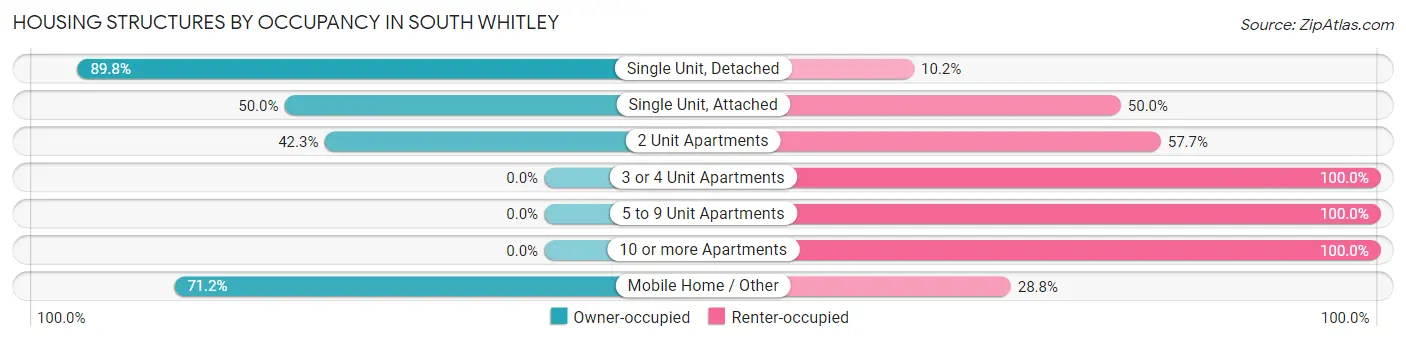
| Structure Type | Owner-occupied | Renter-occupied |
| Single Unit, Detached | 423 (89.8%) | 48 (10.2%) |
| Single Unit, Attached | 2 (50.0%) | 2 (50.0%) |
| 2 Unit Apartments | 11 (42.3%) | 15 (57.7%) |
| 3 or 4 Unit Apartments | 0 (0.0%) | 12 (100.0%) |
| 5 to 9 Unit Apartments | 0 (0.0%) | 8 (100.0%) |
| 10 or more Apartments | 0 (0.0%) | 10 (100.0%) |
| Mobile Home / Other | 42 (71.2%) | 17 (28.8%) |
| Total | 478 (81.0%) | 112 (19.0%) |
Housing Structures by Number of Rooms in South Whitley
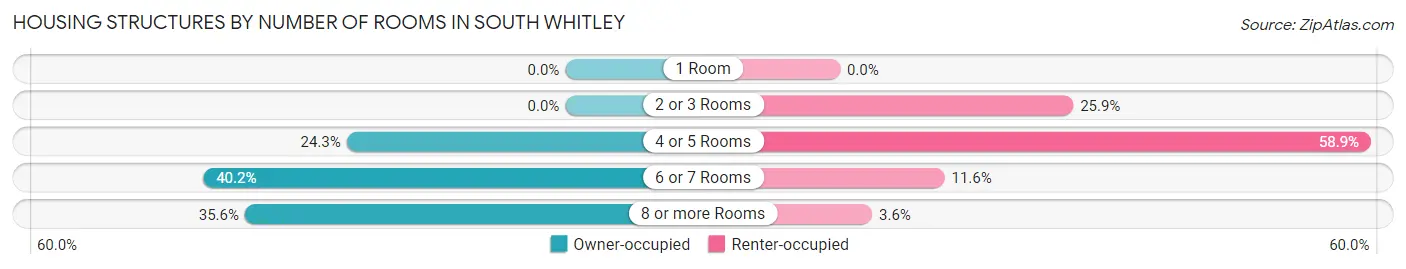
| Number of Rooms | Owner-occupied | Renter-occupied |
| 1 Room | 0 (0.0%) | 0 (0.0%) |
| 2 or 3 Rooms | 0 (0.0%) | 29 (25.9%) |
| 4 or 5 Rooms | 116 (24.3%) | 66 (58.9%) |
| 6 or 7 Rooms | 192 (40.2%) | 13 (11.6%) |
| 8 or more Rooms | 170 (35.6%) | 4 (3.6%) |
| Total | 478 (100.0%) | 112 (100.0%) |
Housing Structure by Heating Type in South Whitley
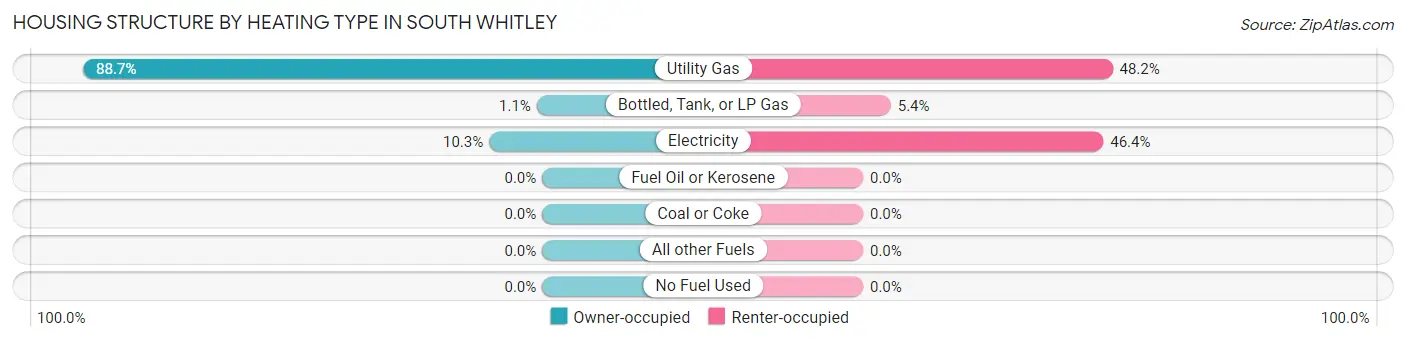
| Heating Type | Owner-occupied | Renter-occupied |
| Utility Gas | 424 (88.7%) | 54 (48.2%) |
| Bottled, Tank, or LP Gas | 5 (1.1%) | 6 (5.4%) |
| Electricity | 49 (10.2%) | 52 (46.4%) |
| Fuel Oil or Kerosene | 0 (0.0%) | 0 (0.0%) |
| Coal or Coke | 0 (0.0%) | 0 (0.0%) |
| All other Fuels | 0 (0.0%) | 0 (0.0%) |
| No Fuel Used | 0 (0.0%) | 0 (0.0%) |
| Total | 478 (100.0%) | 112 (100.0%) |
Household Vehicle Usage in South Whitley
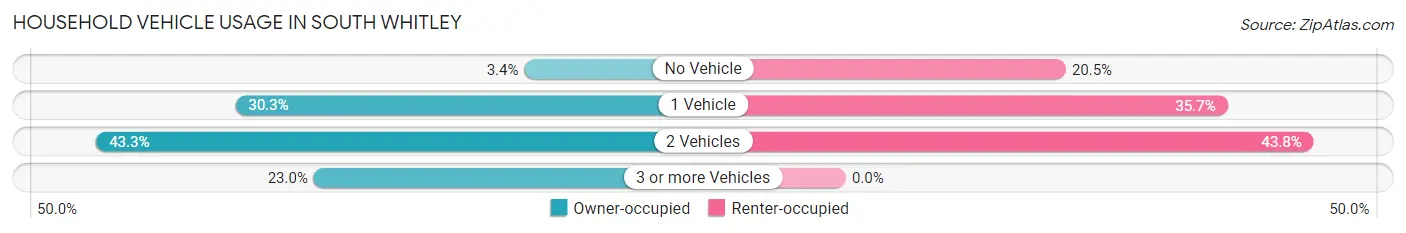
| Vehicles per Household | Owner-occupied | Renter-occupied |
| No Vehicle | 16 (3.4%) | 23 (20.5%) |
| 1 Vehicle | 145 (30.3%) | 40 (35.7%) |
| 2 Vehicles | 207 (43.3%) | 49 (43.8%) |
| 3 or more Vehicles | 110 (23.0%) | 0 (0.0%) |
| Total | 478 (100.0%) | 112 (100.0%) |
Real Estate & Mortgages in South Whitley
Real Estate and Mortgage Overview in South Whitley
| Characteristic | Without Mortgage | With Mortgage |
| Housing Units | 154 | 324 |
| Median Property Value | $122,900 | $115,000 |
| Median Household Income | $47,500 | $21 |
| Monthly Housing Costs | $442 | $0 |
| Real Estate Taxes | $822 | $25 |
Property Value by Mortgage Status in South Whitley
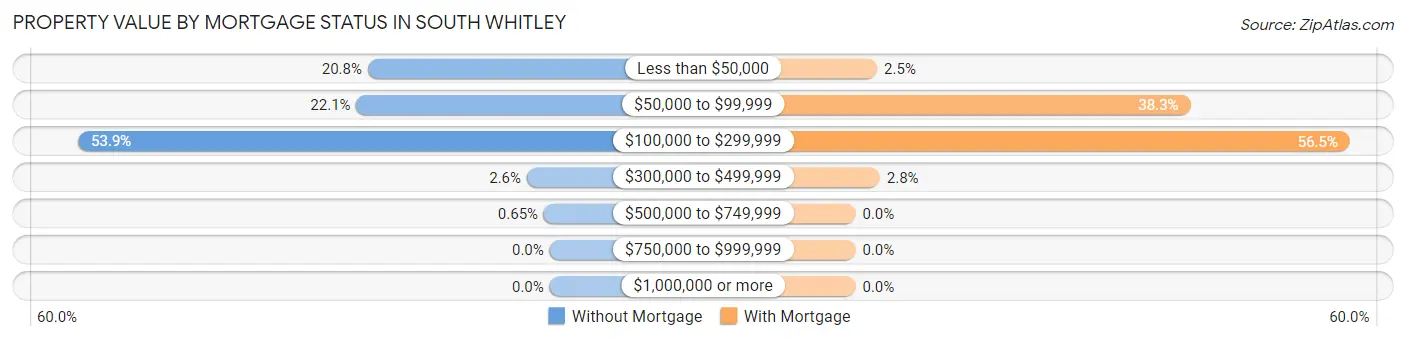
| Property Value | Without Mortgage | With Mortgage |
| Less than $50,000 | 32 (20.8%) | 8 (2.5%) |
| $50,000 to $99,999 | 34 (22.1%) | 124 (38.3%) |
| $100,000 to $299,999 | 83 (53.9%) | 183 (56.5%) |
| $300,000 to $499,999 | 4 (2.6%) | 9 (2.8%) |
| $500,000 to $749,999 | 1 (0.6%) | 0 (0.0%) |
| $750,000 to $999,999 | 0 (0.0%) | 0 (0.0%) |
| $1,000,000 or more | 0 (0.0%) | 0 (0.0%) |
| Total | 154 (100.0%) | 324 (100.0%) |
Household Income by Mortgage Status in South Whitley
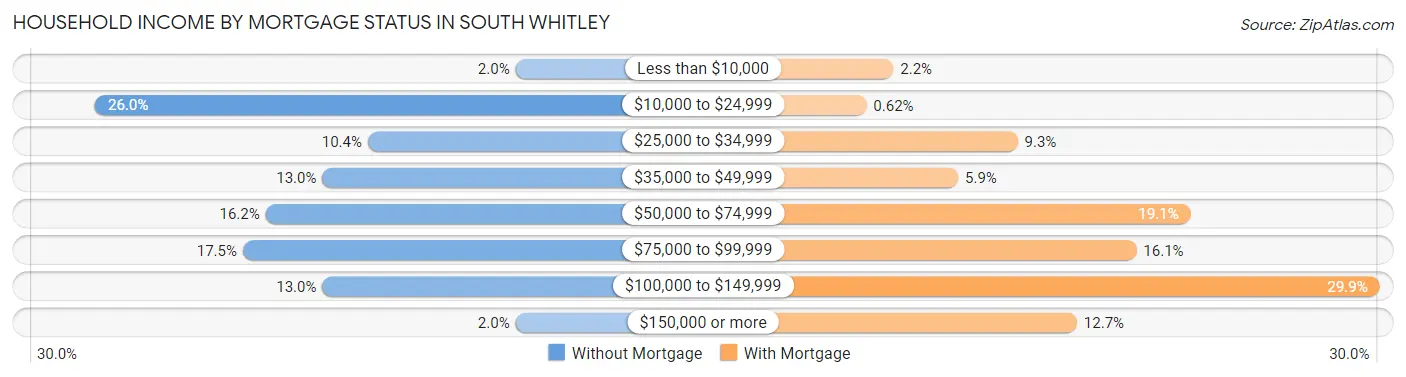
| Household Income | Without Mortgage | With Mortgage |
| Less than $10,000 | 3 (1.9%) | 7 (2.2%) |
| $10,000 to $24,999 | 40 (26.0%) | 2 (0.6%) |
| $25,000 to $34,999 | 16 (10.4%) | 30 (9.3%) |
| $35,000 to $49,999 | 20 (13.0%) | 19 (5.9%) |
| $50,000 to $74,999 | 25 (16.2%) | 62 (19.1%) |
| $75,000 to $99,999 | 27 (17.5%) | 52 (16.1%) |
| $100,000 to $149,999 | 20 (13.0%) | 97 (29.9%) |
| $150,000 or more | 3 (1.9%) | 41 (12.7%) |
| Total | 154 (100.0%) | 324 (100.0%) |
Property Value to Household Income Ratio in South Whitley
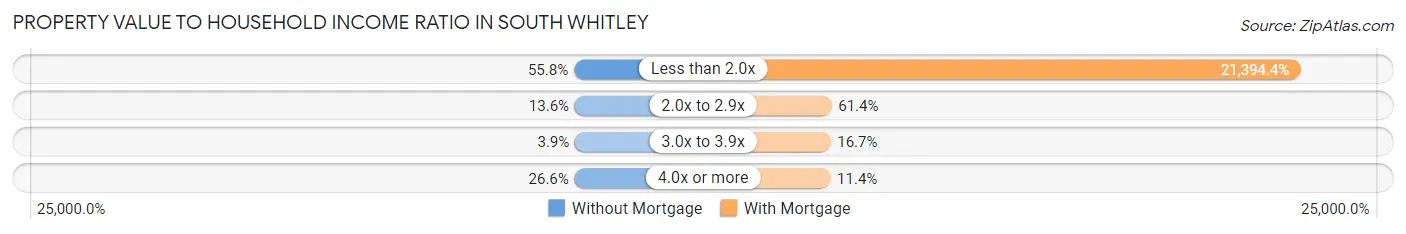
| Value-to-Income Ratio | Without Mortgage | With Mortgage |
| Less than 2.0x | 86 (55.8%) | 69,318 (21,394.4%) |
| 2.0x to 2.9x | 21 (13.6%) | 199 (61.4%) |
| 3.0x to 3.9x | 6 (3.9%) | 54 (16.7%) |
| 4.0x or more | 41 (26.6%) | 37 (11.4%) |
| Total | 154 (100.0%) | 324 (100.0%) |
Real Estate Taxes by Mortgage Status in South Whitley
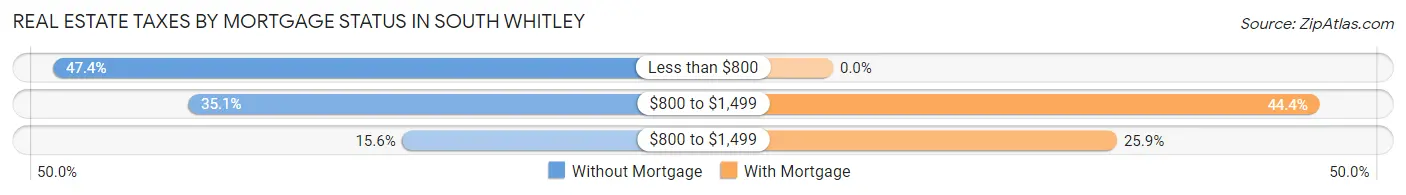
| Property Taxes | Without Mortgage | With Mortgage |
| Less than $800 | 73 (47.4%) | 0 (0.0%) |
| $800 to $1,499 | 54 (35.1%) | 144 (44.4%) |
| $800 to $1,499 | 24 (15.6%) | 84 (25.9%) |
| Total | 154 (100.0%) | 324 (100.0%) |
Health & Disability in South Whitley
Health Insurance Coverage by Age in South Whitley
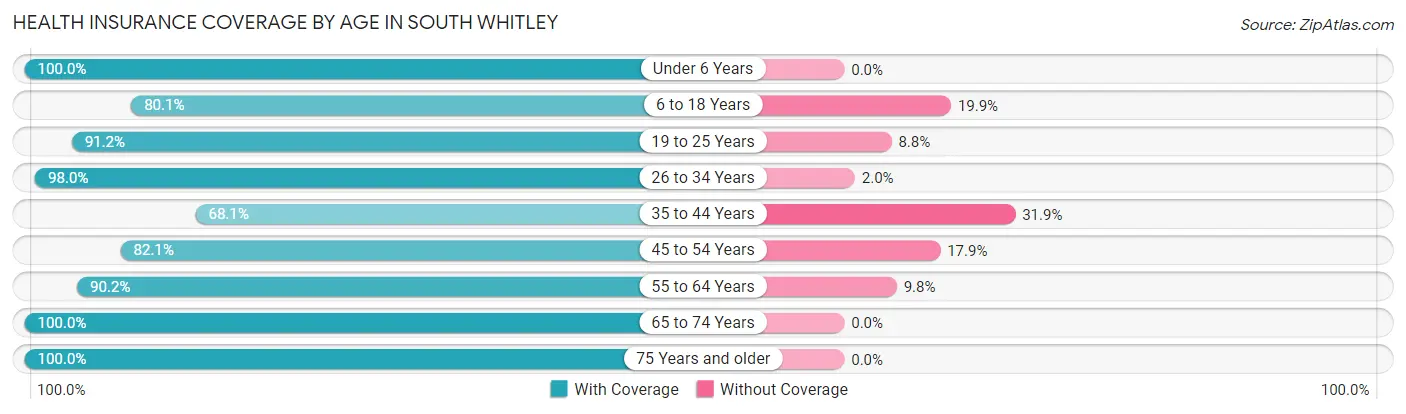
| Age Bracket | With Coverage | Without Coverage |
| Under 6 Years | 107 (100.0%) | 0 (0.0%) |
| 6 to 18 Years | 149 (80.1%) | 37 (19.9%) |
| 19 to 25 Years | 83 (91.2%) | 8 (8.8%) |
| 26 to 34 Years | 150 (98.0%) | 3 (2.0%) |
| 35 to 44 Years | 94 (68.1%) | 44 (31.9%) |
| 45 to 54 Years | 156 (82.1%) | 34 (17.9%) |
| 55 to 64 Years | 166 (90.2%) | 18 (9.8%) |
| 65 to 74 Years | 85 (100.0%) | 0 (0.0%) |
| 75 Years and older | 139 (100.0%) | 0 (0.0%) |
| Total | 1,129 (88.7%) | 144 (11.3%) |
Health Insurance Coverage by Citizenship Status in South Whitley
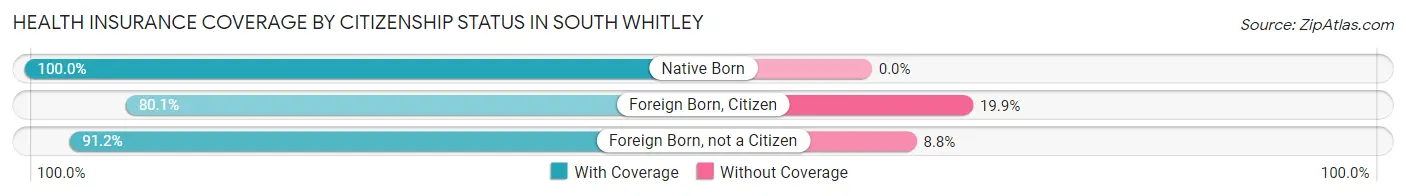
| Citizenship Status | With Coverage | Without Coverage |
| Native Born | 107 (100.0%) | 0 (0.0%) |
| Foreign Born, Citizen | 149 (80.1%) | 37 (19.9%) |
| Foreign Born, not a Citizen | 83 (91.2%) | 8 (8.8%) |
Health Insurance Coverage by Household Income in South Whitley
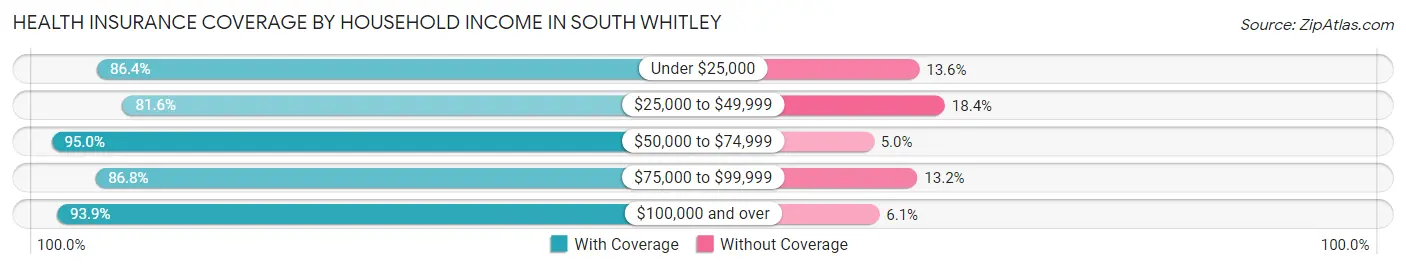
| Household Income | With Coverage | Without Coverage |
| Under $25,000 | 140 (86.4%) | 22 (13.6%) |
| $25,000 to $49,999 | 262 (81.6%) | 59 (18.4%) |
| $50,000 to $74,999 | 264 (95.0%) | 14 (5.0%) |
| $75,000 to $99,999 | 223 (86.8%) | 34 (13.2%) |
| $100,000 and over | 231 (93.9%) | 15 (6.1%) |
Public vs Private Health Insurance Coverage by Age in South Whitley
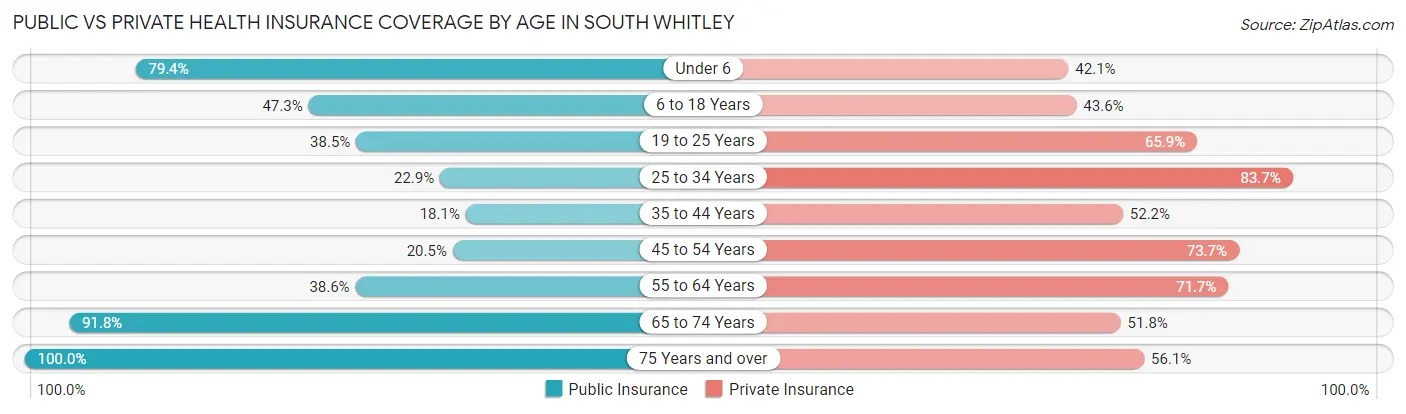
| Age Bracket | Public Insurance | Private Insurance |
| Under 6 | 85 (79.4%) | 45 (42.1%) |
| 6 to 18 Years | 88 (47.3%) | 81 (43.5%) |
| 19 to 25 Years | 35 (38.5%) | 60 (65.9%) |
| 25 to 34 Years | 35 (22.9%) | 128 (83.7%) |
| 35 to 44 Years | 25 (18.1%) | 72 (52.2%) |
| 45 to 54 Years | 39 (20.5%) | 140 (73.7%) |
| 55 to 64 Years | 71 (38.6%) | 132 (71.7%) |
| 65 to 74 Years | 78 (91.8%) | 44 (51.8%) |
| 75 Years and over | 139 (100.0%) | 78 (56.1%) |
| Total | 595 (46.7%) | 780 (61.3%) |
Disability Status by Sex by Age in South Whitley
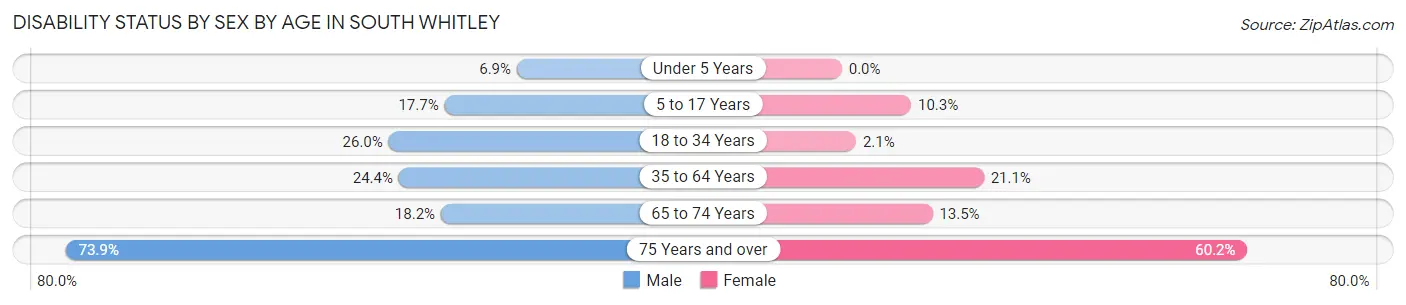
| Age Bracket | Male | Female |
| Under 5 Years | 4 (6.9%) | 0 (0.0%) |
| 5 to 17 Years | 18 (17.6%) | 11 (10.3%) |
| 18 to 34 Years | 41 (26.0%) | 2 (2.1%) |
| 35 to 64 Years | 66 (24.4%) | 51 (21.1%) |
| 65 to 74 Years | 6 (18.2%) | 7 (13.5%) |
| 75 Years and over | 34 (73.9%) | 56 (60.2%) |
Disability Class by Sex by Age in South Whitley
Disability Class: Hearing Difficulty
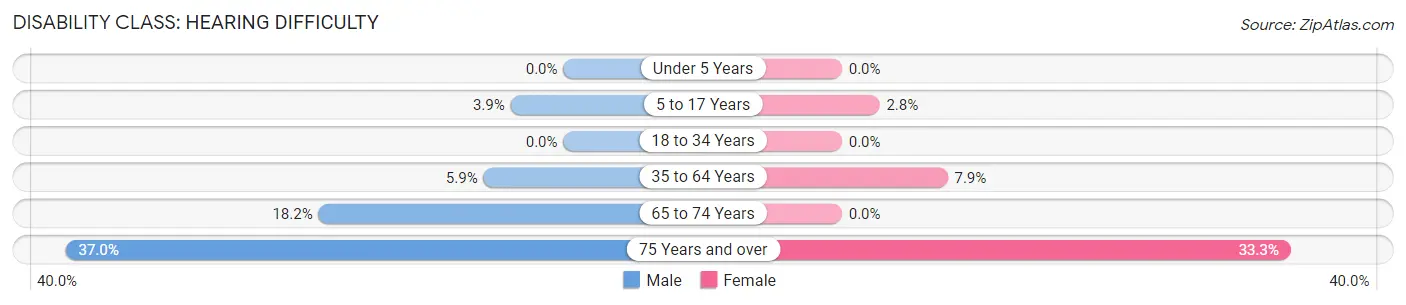
| Age Bracket | Male | Female |
| Under 5 Years | 0 (0.0%) | 0 (0.0%) |
| 5 to 17 Years | 4 (3.9%) | 3 (2.8%) |
| 18 to 34 Years | 0 (0.0%) | 0 (0.0%) |
| 35 to 64 Years | 16 (5.9%) | 19 (7.9%) |
| 65 to 74 Years | 6 (18.2%) | 0 (0.0%) |
| 75 Years and over | 17 (37.0%) | 31 (33.3%) |
Disability Class: Vision Difficulty
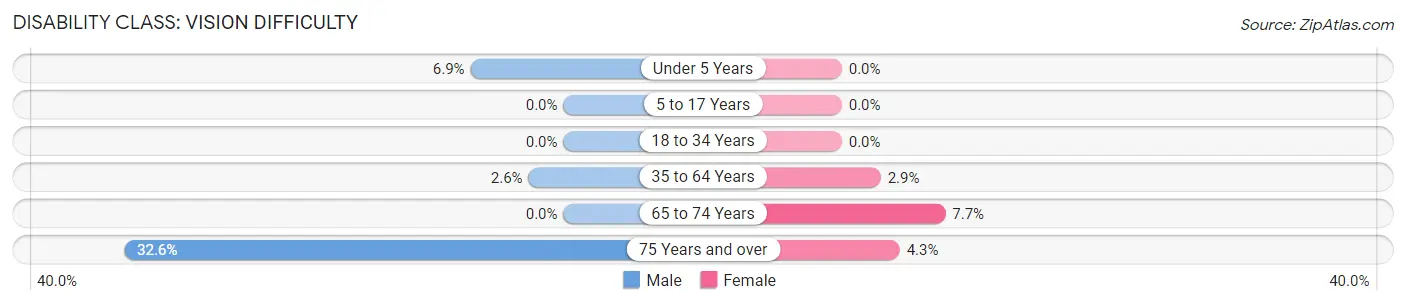
| Age Bracket | Male | Female |
| Under 5 Years | 4 (6.9%) | 0 (0.0%) |
| 5 to 17 Years | 0 (0.0%) | 0 (0.0%) |
| 18 to 34 Years | 0 (0.0%) | 0 (0.0%) |
| 35 to 64 Years | 7 (2.6%) | 7 (2.9%) |
| 65 to 74 Years | 0 (0.0%) | 4 (7.7%) |
| 75 Years and over | 15 (32.6%) | 4 (4.3%) |
Disability Class: Cognitive Difficulty
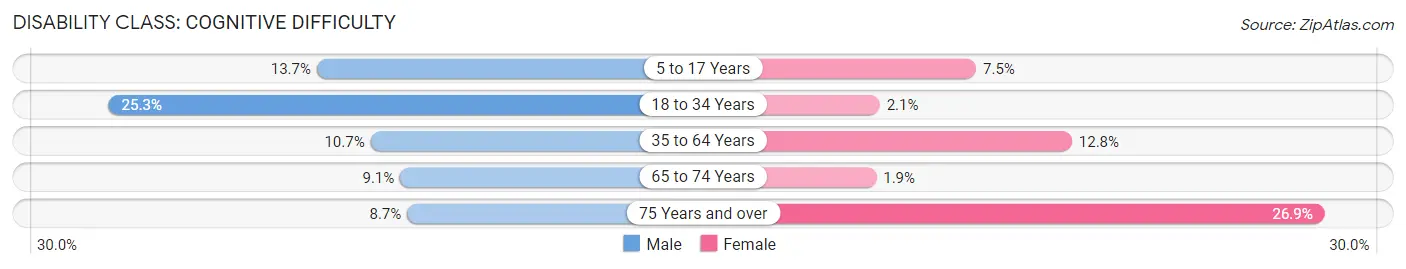
| Age Bracket | Male | Female |
| 5 to 17 Years | 14 (13.7%) | 8 (7.5%) |
| 18 to 34 Years | 40 (25.3%) | 2 (2.1%) |
| 35 to 64 Years | 29 (10.7%) | 31 (12.8%) |
| 65 to 74 Years | 3 (9.1%) | 1 (1.9%) |
| 75 Years and over | 4 (8.7%) | 25 (26.9%) |
Disability Class: Ambulatory Difficulty
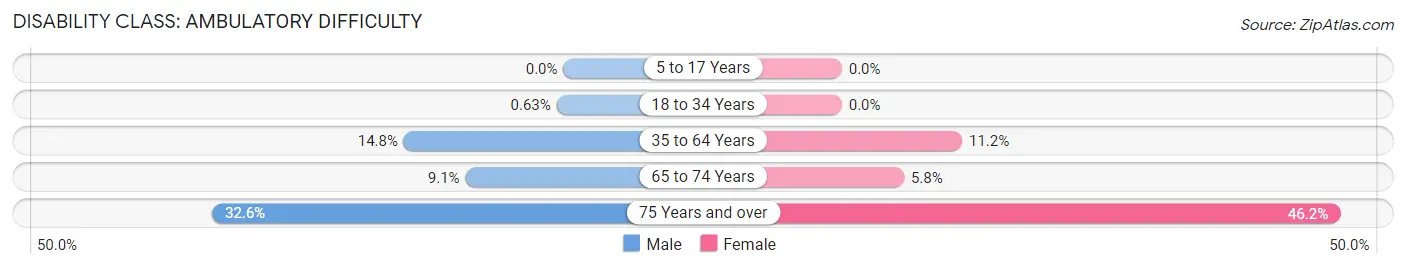
| Age Bracket | Male | Female |
| 5 to 17 Years | 0 (0.0%) | 0 (0.0%) |
| 18 to 34 Years | 1 (0.6%) | 0 (0.0%) |
| 35 to 64 Years | 40 (14.8%) | 27 (11.2%) |
| 65 to 74 Years | 3 (9.1%) | 3 (5.8%) |
| 75 Years and over | 15 (32.6%) | 43 (46.2%) |
Disability Class: Self-Care Difficulty
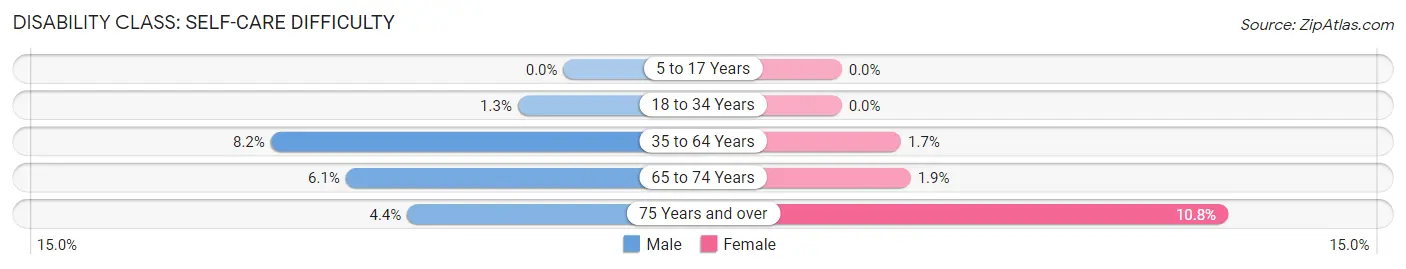
| Age Bracket | Male | Female |
| 5 to 17 Years | 0 (0.0%) | 0 (0.0%) |
| 18 to 34 Years | 2 (1.3%) | 0 (0.0%) |
| 35 to 64 Years | 22 (8.2%) | 4 (1.7%) |
| 65 to 74 Years | 2 (6.1%) | 1 (1.9%) |
| 75 Years and over | 2 (4.3%) | 10 (10.7%) |
Technology Access in South Whitley
Computing Device Access in South Whitley
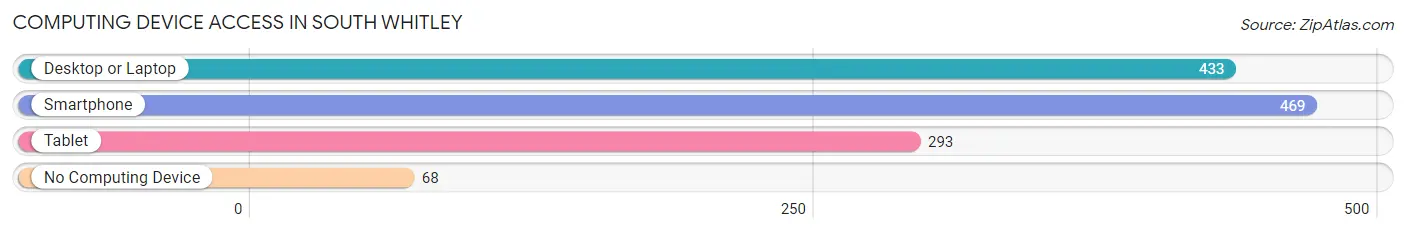
| Device Type | # Households | % Households |
| Desktop or Laptop | 433 | 73.4% |
| Smartphone | 469 | 79.5% |
| Tablet | 293 | 49.7% |
| No Computing Device | 68 | 11.5% |
| Total | 590 | 100.0% |
Internet Access in South Whitley
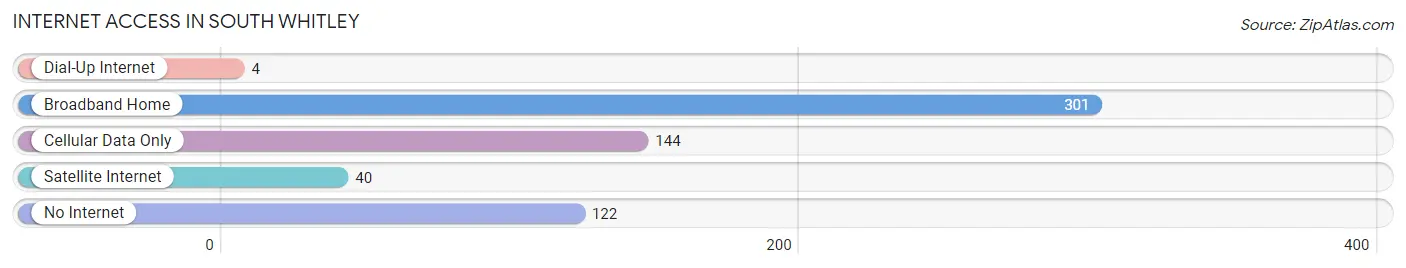
| Internet Type | # Households | % Households |
| Dial-Up Internet | 4 | 0.7% |
| Broadband Home | 301 | 51.0% |
| Cellular Data Only | 144 | 24.4% |
| Satellite Internet | 40 | 6.8% |
| No Internet | 122 | 20.7% |
| Total | 590 | 100.0% |
South Whitley Summary
History
The town of South Whitley, Indiana is located in Whitley County, Indiana, and is part of the Fort Wayne metropolitan area. The town was founded in 1837 by William Whitley, a Revolutionary War veteran, and was originally known as Whitleyville. The town was renamed South Whitley in 1867 when the post office was established.
The town was a major stop on the Wabash and Erie Canal, which was built in the early 1800s to connect the Great Lakes to the Ohio River. The canal was a major transportation route for goods and people, and the town of South Whitley was a major hub for the canal. The canal was eventually abandoned in the late 1800s, but the town of South Whitley continued to grow and develop.
The town was also home to several industries, including a flour mill, a sawmill, a brickyard, and a furniture factory. The town also had a railroad station, which was used to transport goods and people to and from the town.
The town of South Whitley was also home to several churches, including the First Presbyterian Church, which was founded in 1837. The town also had a school, which was established in 1845.
Geography
South Whitley is located in Whitley County, Indiana, and is part of the Fort Wayne metropolitan area. The town is situated on the banks of the Eel River, which flows through the town. The town is located approximately 25 miles south of Fort Wayne and is bordered by the towns of Columbia City, Churubusco, and Larwill.
The town of South Whitley has a total area of 1.3 square miles, all of which is land. The town has a humid continental climate, with hot summers and cold winters. The average temperature in the summer is around 75 degrees Fahrenheit, and the average temperature in the winter is around 25 degrees Fahrenheit.
Economy
The economy of South Whitley is largely based on agriculture and manufacturing. The town is home to several large agricultural operations, including a dairy farm, a hog farm, and a poultry farm. The town is also home to several manufacturing companies, including a furniture factory, a plastics factory, and a metal fabrication plant.
The town is also home to several retail stores, including a grocery store, a hardware store, and a clothing store. The town also has several restaurants, including a pizza shop, a Mexican restaurant, and a Chinese restaurant.
Demographics
As of the 2010 census, the town of South Whitley had a population of 1,845 people. The racial makeup of the town was 97.3% White, 0.7% African American, 0.2% Native American, 0.2% Asian, 0.2% from other races, and 1.6% from two or more races. Hispanic or Latino of any race were 1.2% of the population.
The median household income in the town was $41,250, and the median family income was $50,000. The per capita income in the town was $20,845. About 11.2% of the population was below the poverty line.
Common Questions
What is Per Capita Income in South Whitley?
Per Capita income in South Whitley is $29,212.
What is the Median Family Income in South Whitley?
Median Family Income in South Whitley is $66,786.
What is the Median Household income in South Whitley?
Median Household Income in South Whitley is $55,000.
What is Income or Wage Gap in South Whitley?
Income or Wage Gap in South Whitley is 31.0%.
Women in South Whitley earn 69.0 cents for every dollar earned by a man.
What is Family Income Deficit in South Whitley?
Family Income Deficit in South Whitley is $7,917.
Families that are below poverty line in South Whitley earn $7,917 less on average than the poverty threshold level.
What is Inequality or Gini Index in South Whitley?
Inequality or Gini Index in South Whitley is 0.36.
What is the Total Population of South Whitley?
Total Population of South Whitley is 1,273.
What is the Total Male Population of South Whitley?
Total Male Population of South Whitley is 667.
What is the Total Female Population of South Whitley?
Total Female Population of South Whitley is 606.
What is the Ratio of Males per 100 Females in South Whitley?
There are 110.07 Males per 100 Females in South Whitley.
What is the Ratio of Females per 100 Males in South Whitley?
There are 90.85 Females per 100 Males in South Whitley.
What is the Median Population Age in South Whitley?
Median Population Age in South Whitley is 40.8 Years.
What is the Average Family Size in South Whitley
Average Family Size in South Whitley is 2.8 People.
What is the Average Household Size in South Whitley
Average Household Size in South Whitley is 2.1 People.
How Large is the Labor Force in South Whitley?
There are 685 People in the Labor Forcein in South Whitley.
What is the Percentage of People in the Labor Force in South Whitley?
66.2% of People are in the Labor Force in South Whitley.
What is the Unemployment Rate in South Whitley?
Unemployment Rate in South Whitley is 7.6%.