Silver Lake, IN Map & Demographics
Silver Lake Map
Silver Lake Overview
$25,324
PER CAPITA INCOME
$53,542
AVG FAMILY INCOME
$48,971
AVG HOUSEHOLD INCOME
31.6%
WAGE / INCOME GAP [ % ]
68.4¢/ $1
WAGE / INCOME GAP [ $ ]
0.36
INEQUALITY / GINI INDEX
963
TOTAL POPULATION
466
MALE POPULATION
497
FEMALE POPULATION
93.76
MALES / 100 FEMALES
106.65
FEMALES / 100 MALES
45.7
MEDIAN AGE
2.7
AVG FAMILY SIZE
2.3
AVG HOUSEHOLD SIZE
440
LABOR FORCE [ PEOPLE ]
55.8%
PERCENT IN LABOR FORCE
7.7%
UNEMPLOYMENT RATE
Silver Lake Zip Codes
Silver Lake Area Codes
Income in Silver Lake
Income Overview in Silver Lake
Per Capita Income in Silver Lake is $25,324, while median incomes of families and households are $53,542 and $48,971 respectively.
| Characteristic | Number | Measure |
| Per Capita Income | 963 | $25,324 |
| Median Family Income | 227 | $53,542 |
| Mean Family Income | 227 | $65,568 |
| Median Household Income | 404 | $48,971 |
| Mean Household Income | 404 | $57,739 |
| Income Deficit | 227 | $0 |
| Wage / Income Gap (%) | 963 | 31.59% |
| Wage / Income Gap ($) | 963 | 68.41¢ per $1 |
| Gini / Inequality Index | 963 | 0.36 |
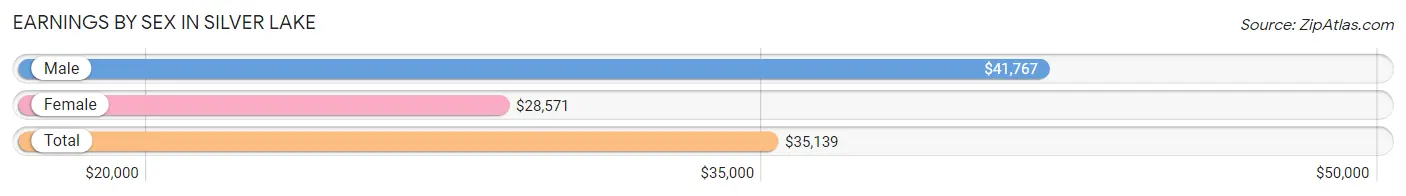
Earnings by Sex in Silver Lake
Average Earnings in Silver Lake are $35,139, $41,767 for men and $28,571 for women, a difference of 31.6%.
| Sex | Number | Average Earnings |
| Male | 243 (53.4%) | $41,767 |
| Female | 212 (46.6%) | $28,571 |
| Total | 455 (100.0%) | $35,139 |
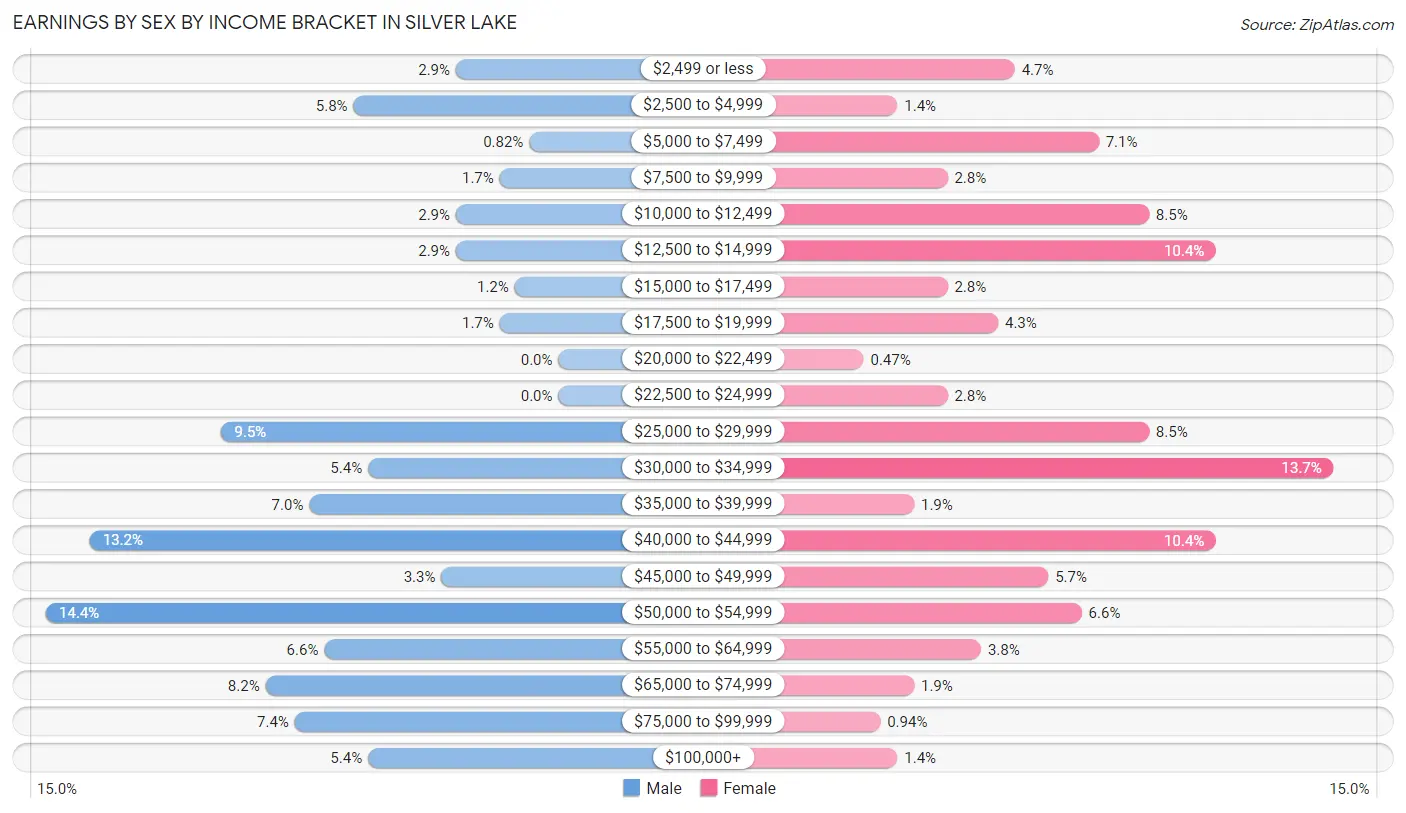
Earnings by Sex by Income Bracket in Silver Lake
The most common earnings brackets in Silver Lake are $50,000 to $54,999 for men (35 | 14.4%) and $30,000 to $34,999 for women (29 | 13.7%).
| Income | Male | Female |
| $2,499 or less | 7 (2.9%) | 10 (4.7%) |
| $2,500 to $4,999 | 14 (5.8%) | 3 (1.4%) |
| $5,000 to $7,499 | 2 (0.8%) | 15 (7.1%) |
| $7,500 to $9,999 | 4 (1.7%) | 6 (2.8%) |
| $10,000 to $12,499 | 7 (2.9%) | 18 (8.5%) |
| $12,500 to $14,999 | 7 (2.9%) | 22 (10.4%) |
| $15,000 to $17,499 | 3 (1.2%) | 6 (2.8%) |
| $17,500 to $19,999 | 4 (1.7%) | 9 (4.3%) |
| $20,000 to $22,499 | 0 (0.0%) | 1 (0.5%) |
| $22,500 to $24,999 | 0 (0.0%) | 6 (2.8%) |
| $25,000 to $29,999 | 23 (9.5%) | 18 (8.5%) |
| $30,000 to $34,999 | 13 (5.3%) | 29 (13.7%) |
| $35,000 to $39,999 | 17 (7.0%) | 4 (1.9%) |
| $40,000 to $44,999 | 32 (13.2%) | 22 (10.4%) |
| $45,000 to $49,999 | 8 (3.3%) | 12 (5.7%) |
| $50,000 to $54,999 | 35 (14.4%) | 14 (6.6%) |
| $55,000 to $64,999 | 16 (6.6%) | 8 (3.8%) |
| $65,000 to $74,999 | 20 (8.2%) | 4 (1.9%) |
| $75,000 to $99,999 | 18 (7.4%) | 2 (0.9%) |
| $100,000+ | 13 (5.3%) | 3 (1.4%) |
| Total | 243 (100.0%) | 212 (100.0%) |
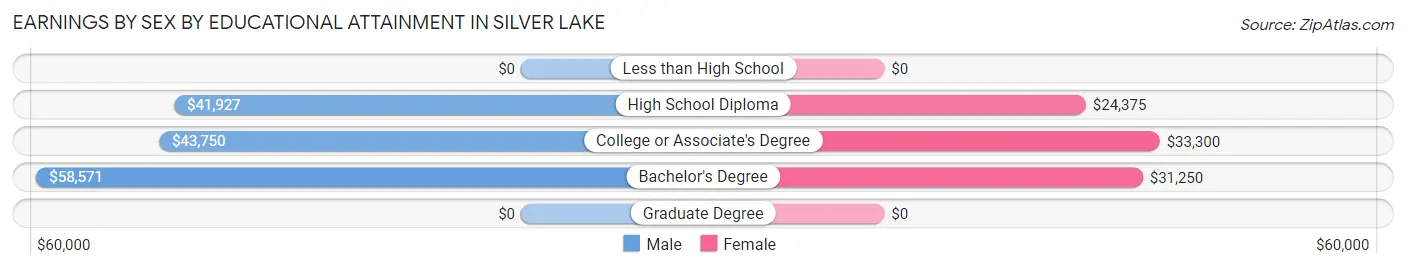
Earnings by Sex by Educational Attainment in Silver Lake
Average earnings in Silver Lake are $42,414 for men and $29,732 for women, a difference of 29.9%. Men with an educational attainment of bachelor's degree enjoy the highest average annual earnings of $58,571, while those with high school diploma education earn the least with $41,927. Women with an educational attainment of college or associate's degree earn the most with the average annual earnings of $33,300, while those with high school diploma education have the smallest earnings of $24,375.
| Educational Attainment | Male Income | Female Income |
| Less than High School | - | - |
| High School Diploma | $41,927 | $24,375 |
| College or Associate's Degree | $43,750 | $33,300 |
| Bachelor's Degree | $58,571 | $31,250 |
| Graduate Degree | - | - |
| Total | $42,414 | $29,732 |
Family Income in Silver Lake
Family Income Brackets in Silver Lake
According to the Silver Lake family income data, there are 55 families falling into the $50,000 to $74,999 income range, which is the most common income bracket and makes up 24.2% of all families.
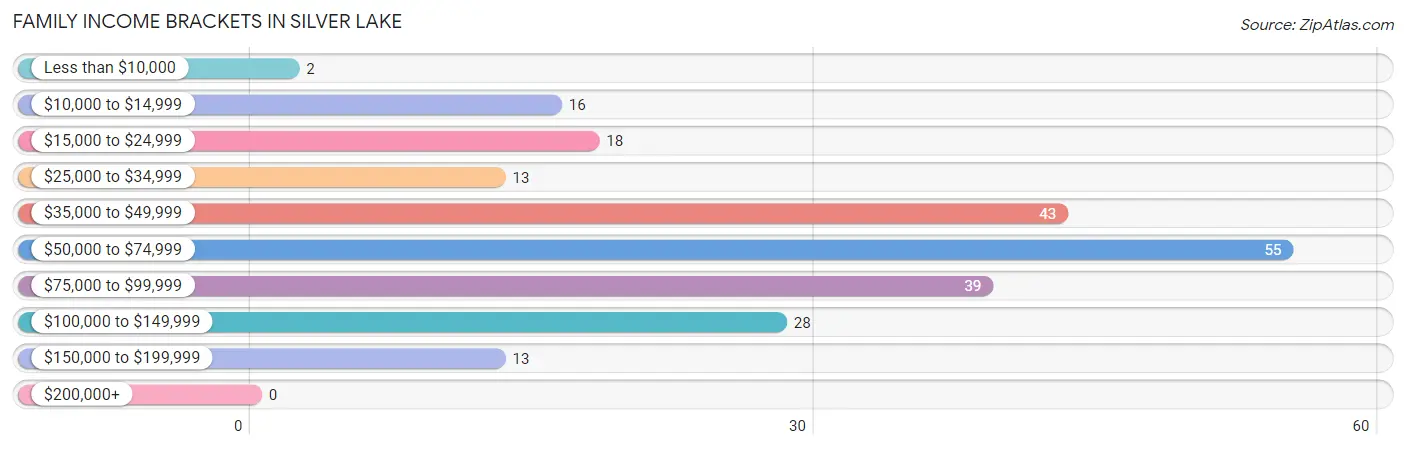
| Income Bracket | # Families | % Families |
| Less than $10,000 | 2 | 0.9% |
| $10,000 to $14,999 | 16 | 7.0% |
| $15,000 to $24,999 | 18 | 7.9% |
| $25,000 to $34,999 | 13 | 5.7% |
| $35,000 to $49,999 | 43 | 18.9% |
| $50,000 to $74,999 | 55 | 24.2% |
| $75,000 to $99,999 | 39 | 17.2% |
| $100,000 to $149,999 | 28 | 12.3% |
| $150,000 to $199,999 | 13 | 5.7% |
| $200,000+ | 0 | 0.0% |
Family Income by Famaliy Size in Silver Lake
6-person families (6 | 2.6%) account for the highest median family income in Silver Lake with $106,250 per family, while 3-person families (66 | 29.1%) have the highest median income of $27,262 per family member.
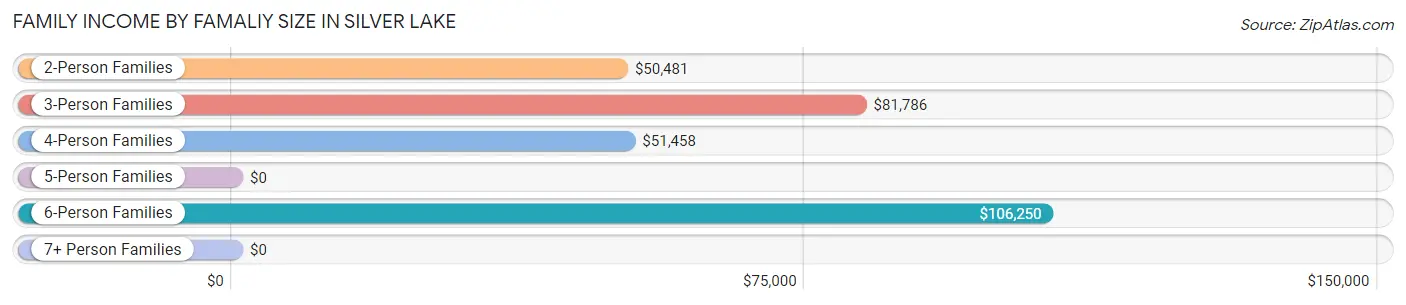
| Income Bracket | # Families | Median Income |
| 2-Person Families | 125 (55.1%) | $50,481 |
| 3-Person Families | 66 (29.1%) | $81,786 |
| 4-Person Families | 19 (8.4%) | $51,458 |
| 5-Person Families | 11 (4.9%) | $0 |
| 6-Person Families | 6 (2.6%) | $106,250 |
| 7+ Person Families | 0 (0.0%) | $0 |
| Total | 227 (100.0%) | $53,542 |
Family Income by Number of Earners in Silver Lake
The median family income in Silver Lake is $53,542, with families comprising 3+ earners (15) having the highest median family income of $130,536, while families with no earners (41) have the lowest median family income of $45,625, accounting for 6.6% and 18.1% of families, respectively.
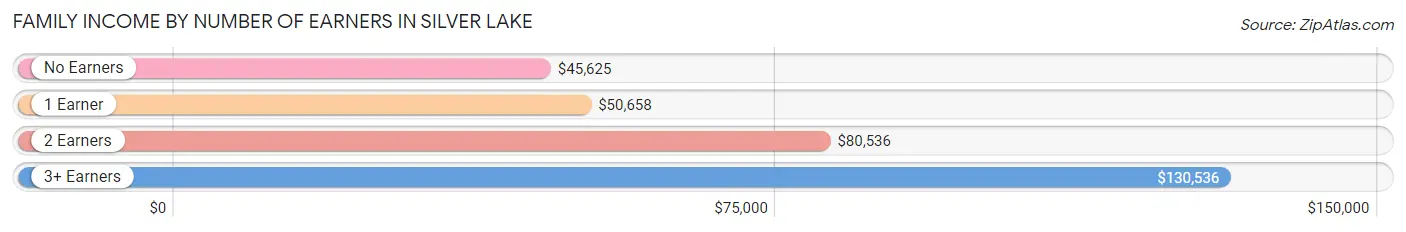
| Number of Earners | # Families | Median Income |
| No Earners | 41 (18.1%) | $45,625 |
| 1 Earner | 106 (46.7%) | $50,658 |
| 2 Earners | 65 (28.6%) | $80,536 |
| 3+ Earners | 15 (6.6%) | $130,536 |
| Total | 227 (100.0%) | $53,542 |
Household Income in Silver Lake
Household Income Brackets in Silver Lake
With 90 households falling in the category, the $50,000 to $74,999 income range is the most frequent in Silver Lake, accounting for 22.3% of all households.
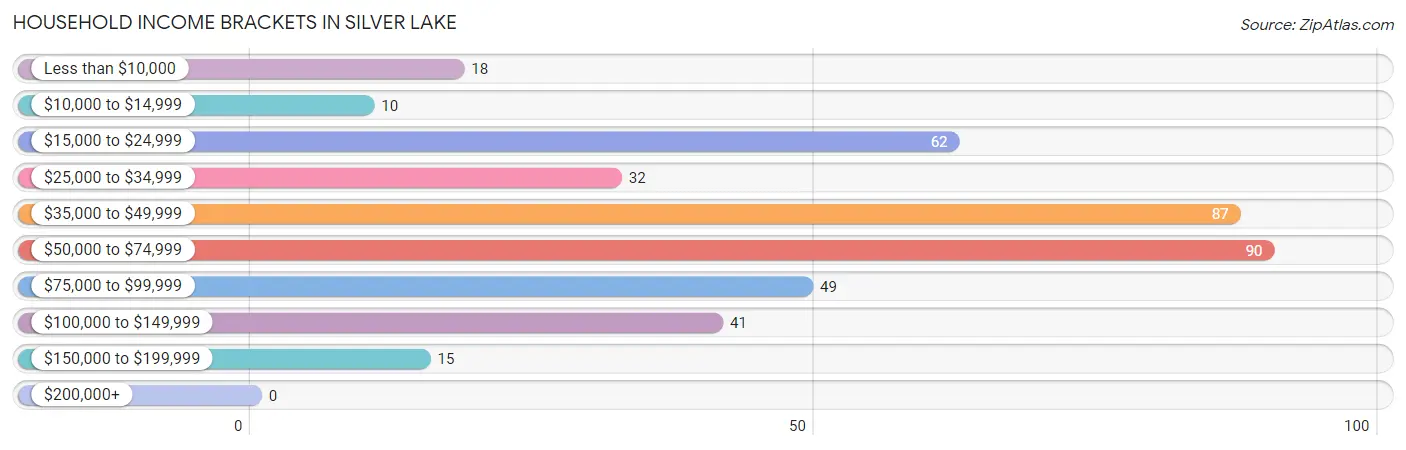
| Income Bracket | # Households | % Households |
| Less than $10,000 | 18 | 4.5% |
| $10,000 to $14,999 | 10 | 2.5% |
| $15,000 to $24,999 | 62 | 15.3% |
| $25,000 to $34,999 | 32 | 7.9% |
| $35,000 to $49,999 | 87 | 21.5% |
| $50,000 to $74,999 | 90 | 22.3% |
| $75,000 to $99,999 | 49 | 12.1% |
| $100,000 to $149,999 | 41 | 10.1% |
| $150,000 to $199,999 | 15 | 3.7% |
| $200,000+ | 0 | 0.0% |
Household Income by Householder Age in Silver Lake
The median household income in Silver Lake is $48,971, with the highest median household income of $85,000 found in the 25 to 44 years age bracket for the primary householder. A total of 92 households (22.8%) fall into this category. Meanwhile, the 15 to 24 years age bracket for the primary householder has the lowest median household income of $0, with 13 households (3.2%) in this group.
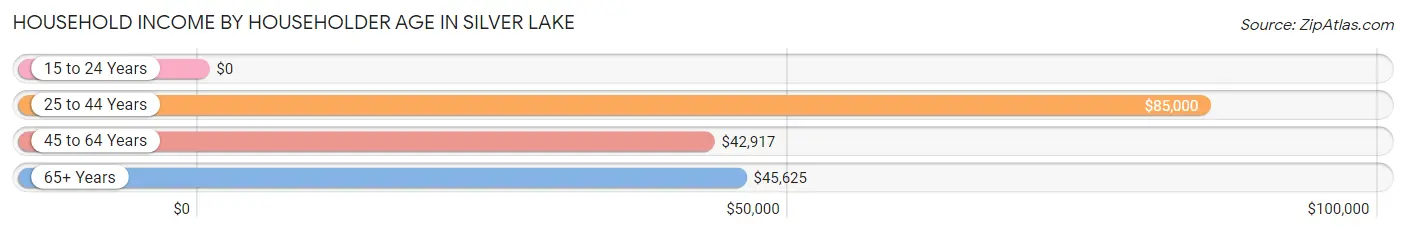
| Income Bracket | # Households | Median Income |
| 15 to 24 Years | 13 (3.2%) | $0 |
| 25 to 44 Years | 92 (22.8%) | $85,000 |
| 45 to 64 Years | 173 (42.8%) | $42,917 |
| 65+ Years | 126 (31.2%) | $45,625 |
| Total | 404 (100.0%) | $48,971 |
Poverty in Silver Lake
Income Below Poverty by Sex and Age in Silver Lake
With 13.2% poverty level for males and 22.5% for females among the residents of Silver Lake, 16 and 17 year old males and 12 to 14 year old females are the most vulnerable to poverty, with 3 males (50.0%) and 8 females (100.0%) in their respective age groups living below the poverty level.
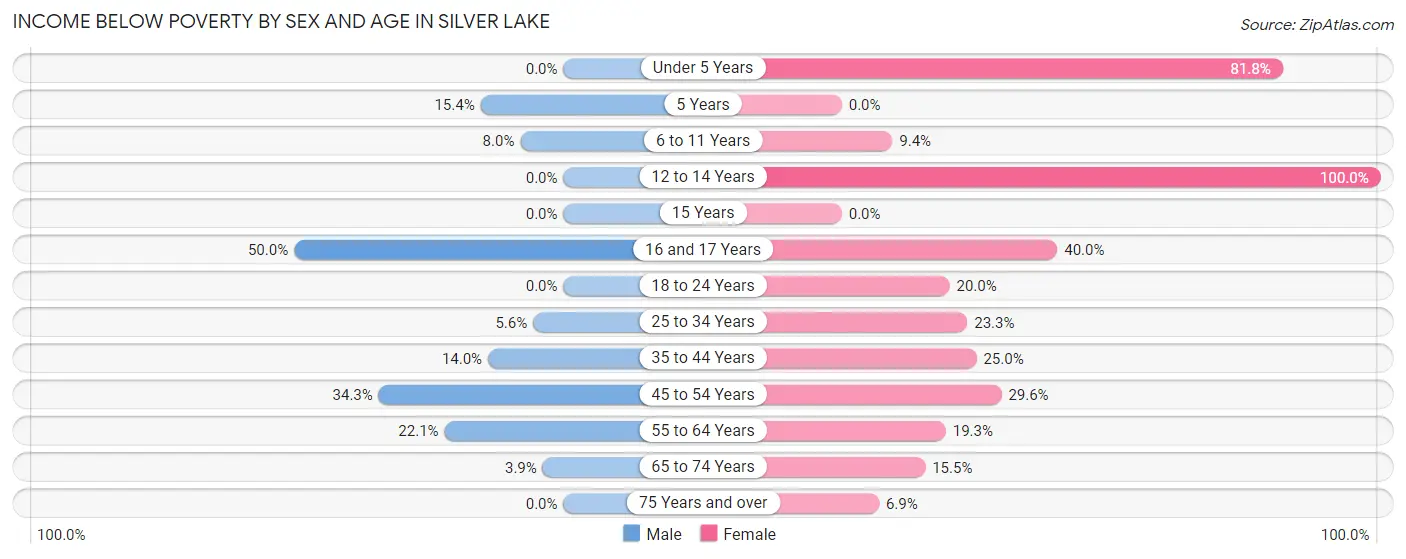
| Age Bracket | Male | Female |
| Under 5 Years | 0 (0.0%) | 9 (81.8%) |
| 5 Years | 2 (15.4%) | 0 (0.0%) |
| 6 to 11 Years | 2 (8.0%) | 3 (9.4%) |
| 12 to 14 Years | 0 (0.0%) | 8 (100.0%) |
| 15 Years | 0 (0.0%) | 0 (0.0%) |
| 16 and 17 Years | 3 (50.0%) | 4 (40.0%) |
| 18 to 24 Years | 0 (0.0%) | 5 (20.0%) |
| 25 to 34 Years | 4 (5.6%) | 17 (23.3%) |
| 35 to 44 Years | 7 (14.0%) | 11 (25.0%) |
| 45 to 54 Years | 24 (34.3%) | 24 (29.6%) |
| 55 to 64 Years | 17 (22.1%) | 11 (19.3%) |
| 65 to 74 Years | 2 (3.8%) | 11 (15.5%) |
| 75 Years and over | 0 (0.0%) | 4 (6.9%) |
| Total | 61 (13.2%) | 107 (22.5%) |
Income Above Poverty by Sex and Age in Silver Lake
According to the poverty statistics in Silver Lake, males aged under 5 years and females aged 5 years are the age groups that are most secure financially, with 100.0% of males and 100.0% of females in these age groups living above the poverty line.
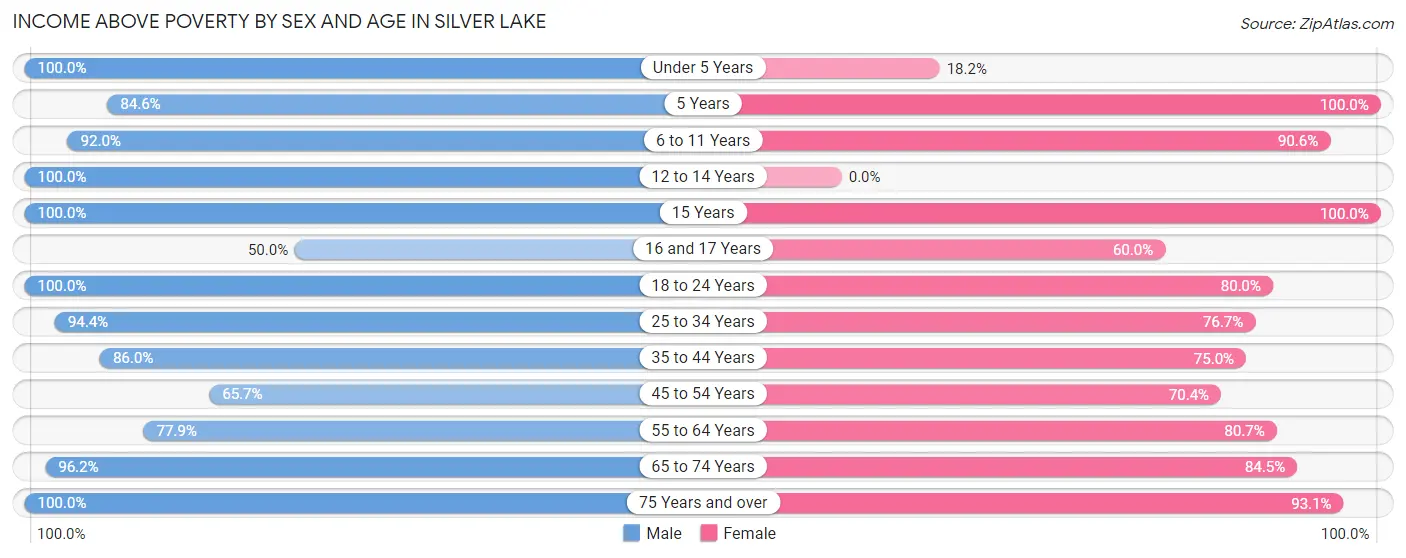
| Age Bracket | Male | Female |
| Under 5 Years | 37 (100.0%) | 2 (18.2%) |
| 5 Years | 11 (84.6%) | 2 (100.0%) |
| 6 to 11 Years | 23 (92.0%) | 29 (90.6%) |
| 12 to 14 Years | 13 (100.0%) | 0 (0.0%) |
| 15 Years | 4 (100.0%) | 3 (100.0%) |
| 16 and 17 Years | 3 (50.0%) | 6 (60.0%) |
| 18 to 24 Years | 18 (100.0%) | 20 (80.0%) |
| 25 to 34 Years | 67 (94.4%) | 56 (76.7%) |
| 35 to 44 Years | 43 (86.0%) | 33 (75.0%) |
| 45 to 54 Years | 46 (65.7%) | 57 (70.4%) |
| 55 to 64 Years | 60 (77.9%) | 46 (80.7%) |
| 65 to 74 Years | 50 (96.2%) | 60 (84.5%) |
| 75 Years and over | 25 (100.0%) | 54 (93.1%) |
| Total | 400 (86.8%) | 368 (77.5%) |
Income Below Poverty Among Married-Couple Families in Silver Lake
The poverty statistics for married-couple families in Silver Lake show that 2.9% or 4 of the total 140 families live below the poverty line. Families with 1 or 2 children have the highest poverty rate of 4.3%, comprising of 2 families. On the other hand, families with 3 or 4 children have the lowest poverty rate of 0.0%, which includes 0 families.
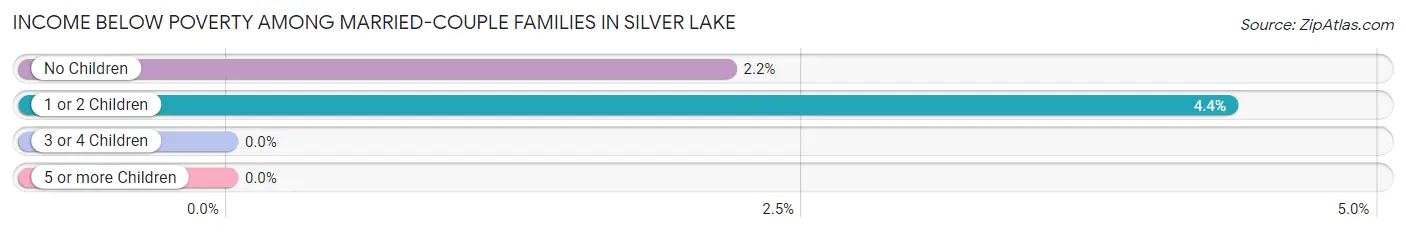
| Children | Above Poverty | Below Poverty |
| No Children | 90 (97.8%) | 2 (2.2%) |
| 1 or 2 Children | 44 (95.7%) | 2 (4.3%) |
| 3 or 4 Children | 2 (100.0%) | 0 (0.0%) |
| 5 or more Children | 0 (0.0%) | 0 (0.0%) |
| Total | 136 (97.1%) | 4 (2.9%) |
Income Below Poverty Among Single-Parent Households in Silver Lake
According to the poverty data in Silver Lake, 12.5% or 7 single-father households and 48.4% or 15 single-mother households are living below the poverty line. Among single-father households, those with 1 or 2 children have the highest poverty rate, with 7 households (15.2%) experiencing poverty. Likewise, among single-mother households, those with 1 or 2 children have the highest poverty rate, with 11 households (57.9%) falling below the poverty line.
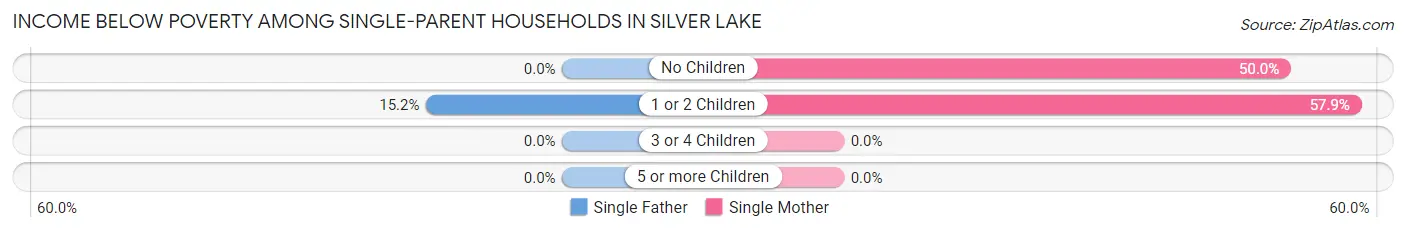
| Children | Single Father | Single Mother |
| No Children | 0 (0.0%) | 4 (50.0%) |
| 1 or 2 Children | 7 (15.2%) | 11 (57.9%) |
| 3 or 4 Children | 0 (0.0%) | 0 (0.0%) |
| 5 or more Children | 0 (0.0%) | 0 (0.0%) |
| Total | 7 (12.5%) | 15 (48.4%) |
Income Below Poverty Among Married-Couple vs Single-Parent Households in Silver Lake
The poverty data for Silver Lake shows that 4 of the married-couple family households (2.9%) and 22 of the single-parent households (25.3%) are living below the poverty level. Within the married-couple family households, those with 1 or 2 children have the highest poverty rate, with 2 households (4.3%) falling below the poverty line. Among the single-parent households, those with 1 or 2 children have the highest poverty rate, with 18 household (27.7%) living below poverty.
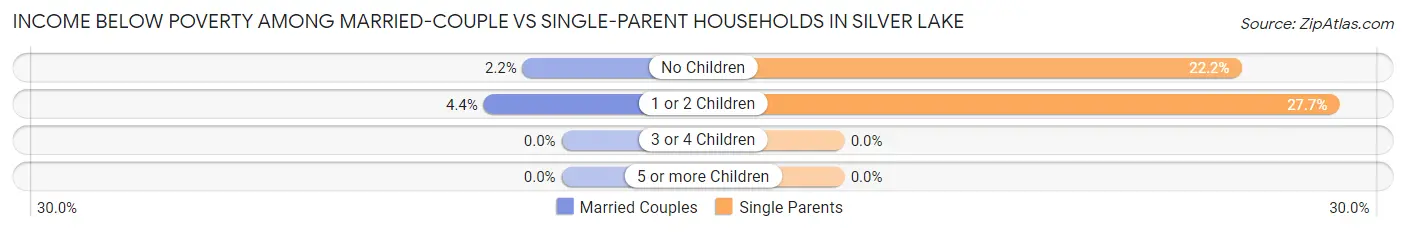
| Children | Married-Couple Families | Single-Parent Households |
| No Children | 2 (2.2%) | 4 (22.2%) |
| 1 or 2 Children | 2 (4.3%) | 18 (27.7%) |
| 3 or 4 Children | 0 (0.0%) | 0 (0.0%) |
| 5 or more Children | 0 (0.0%) | 0 (0.0%) |
| Total | 4 (2.9%) | 22 (25.3%) |
Race in Silver Lake
The most populous races in Silver Lake are White / Caucasian (937 | 97.3%), Two or more Races (25 | 2.6%), and Hispanic or Latino (16 | 1.7%).
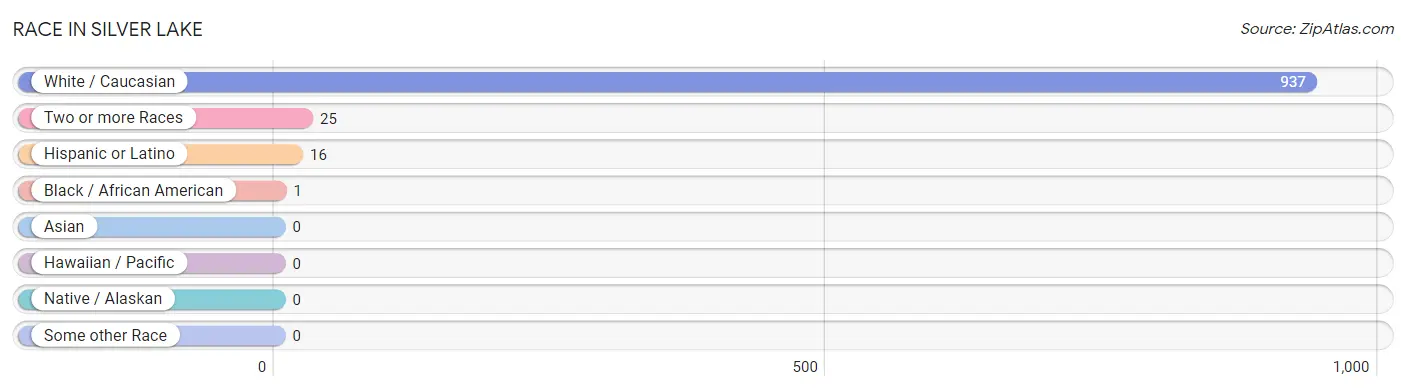
| Race | # Population | % Population |
| Asian | 0 | 0.0% |
| Black / African American | 1 | 0.1% |
| Hawaiian / Pacific | 0 | 0.0% |
| Hispanic or Latino | 16 | 1.7% |
| Native / Alaskan | 0 | 0.0% |
| White / Caucasian | 937 | 97.3% |
| Two or more Races | 25 | 2.6% |
| Some other Race | 0 | 0.0% |
| Total | 963 | 100.0% |
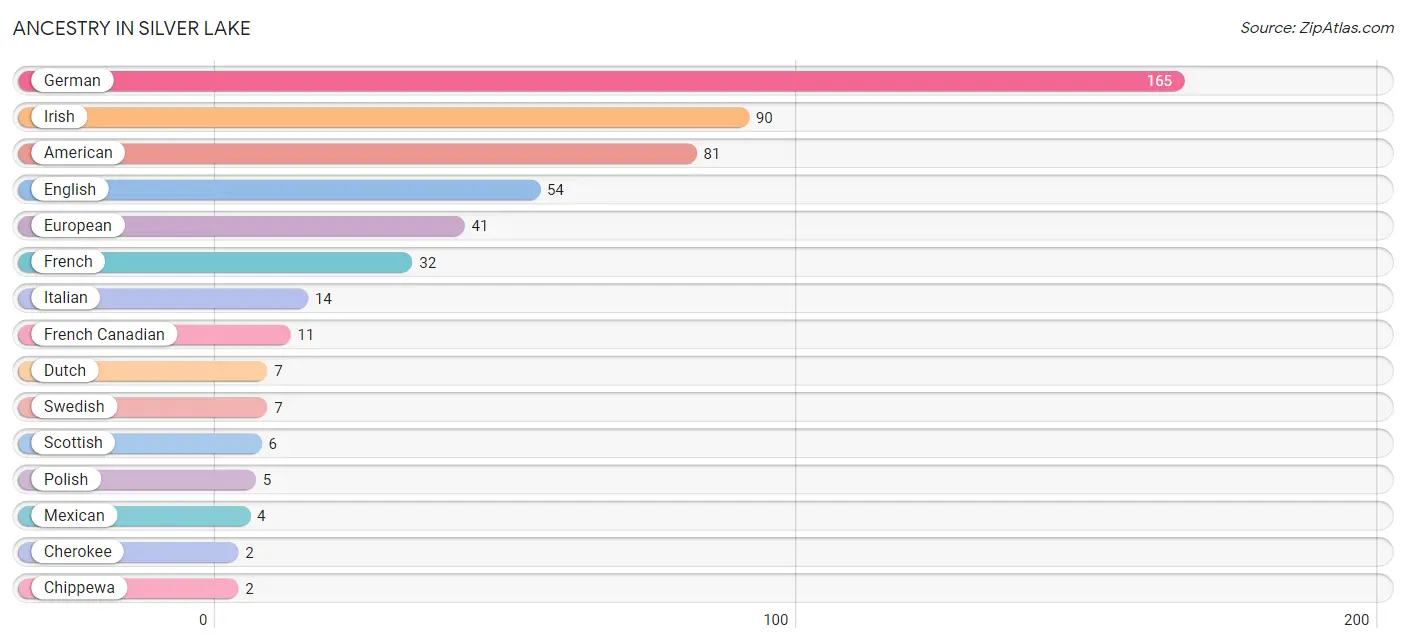
Ancestry in Silver Lake
The most populous ancestries reported in Silver Lake are German (165 | 17.1%), Irish (90 | 9.3%), American (81 | 8.4%), English (54 | 5.6%), and European (41 | 4.3%), together accounting for 44.8% of all Silver Lake residents.
| Ancestry | # Population | % Population |
| American | 81 | 8.4% |
| Cherokee | 2 | 0.2% |
| Chippewa | 2 | 0.2% |
| Dutch | 7 | 0.7% |
| English | 54 | 5.6% |
| European | 41 | 4.3% |
| French | 32 | 3.3% |
| French Canadian | 11 | 1.1% |
| German | 165 | 17.1% |
| Irish | 90 | 9.3% |
| Italian | 14 | 1.5% |
| Mexican | 4 | 0.4% |
| Norwegian | 2 | 0.2% |
| Polish | 5 | 0.5% |
| Scandinavian | 2 | 0.2% |
| Scottish | 6 | 0.6% |
| Swedish | 7 | 0.7% | View All 17 Rows |
Immigrants in Silver Lake

| Immigration Origin | # Population | % Population | View All 0 Rows |
Sex and Age in Silver Lake
Sex and Age in Silver Lake
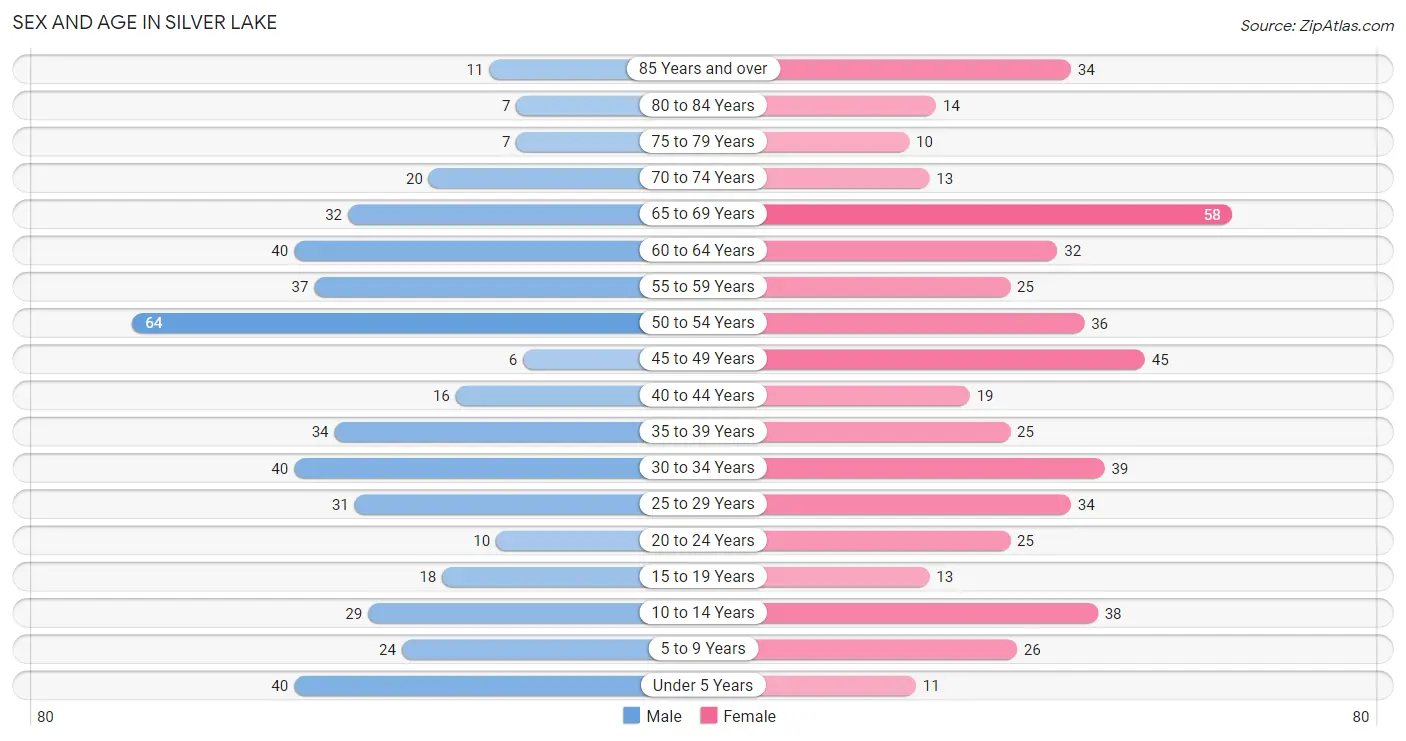
The most populous age groups in Silver Lake are 50 to 54 Years (64 | 13.7%) for men and 65 to 69 Years (58 | 11.7%) for women.
| Age Bracket | Male | Female |
| Under 5 Years | 40 (8.6%) | 11 (2.2%) |
| 5 to 9 Years | 24 (5.1%) | 26 (5.2%) |
| 10 to 14 Years | 29 (6.2%) | 38 (7.6%) |
| 15 to 19 Years | 18 (3.9%) | 13 (2.6%) |
| 20 to 24 Years | 10 (2.1%) | 25 (5.0%) |
| 25 to 29 Years | 31 (6.7%) | 34 (6.8%) |
| 30 to 34 Years | 40 (8.6%) | 39 (7.9%) |
| 35 to 39 Years | 34 (7.3%) | 25 (5.0%) |
| 40 to 44 Years | 16 (3.4%) | 19 (3.8%) |
| 45 to 49 Years | 6 (1.3%) | 45 (9.0%) |
| 50 to 54 Years | 64 (13.7%) | 36 (7.2%) |
| 55 to 59 Years | 37 (7.9%) | 25 (5.0%) |
| 60 to 64 Years | 40 (8.6%) | 32 (6.4%) |
| 65 to 69 Years | 32 (6.9%) | 58 (11.7%) |
| 70 to 74 Years | 20 (4.3%) | 13 (2.6%) |
| 75 to 79 Years | 7 (1.5%) | 10 (2.0%) |
| 80 to 84 Years | 7 (1.5%) | 14 (2.8%) |
| 85 Years and over | 11 (2.4%) | 34 (6.8%) |
| Total | 466 (100.0%) | 497 (100.0%) |
Families and Households in Silver Lake
Median Family Size in Silver Lake
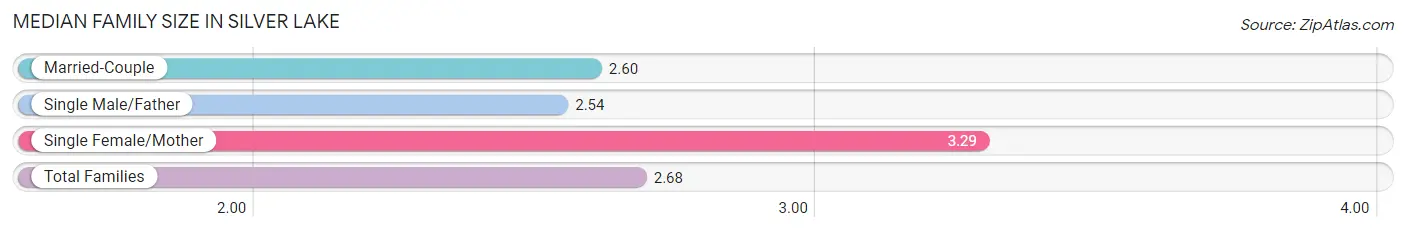
The median family size in Silver Lake is 2.68 persons per family, with single female/mother families (31 | 13.7%) accounting for the largest median family size of 3.29 persons per family. On the other hand, single male/father families (56 | 24.7%) represent the smallest median family size with 2.54 persons per family.
| Family Type | # Families | Family Size |
| Married-Couple | 140 (61.7%) | 2.60 |
| Single Male/Father | 56 (24.7%) | 2.54 |
| Single Female/Mother | 31 (13.7%) | 3.29 |
| Total Families | 227 (100.0%) | 2.68 |
Median Household Size in Silver Lake
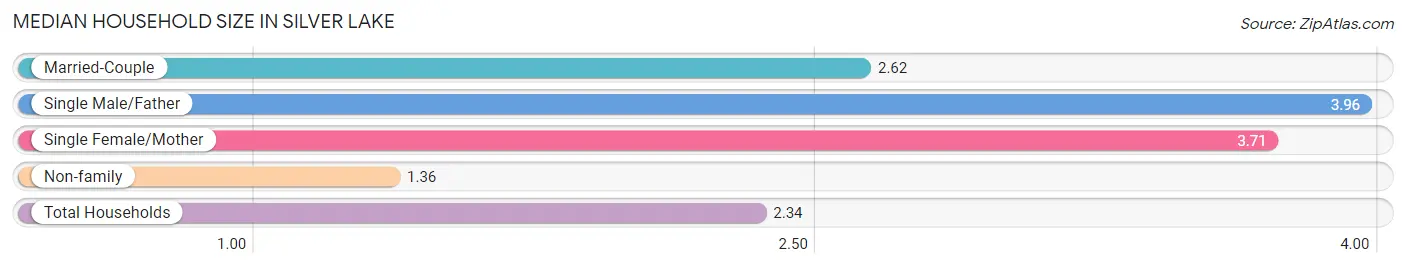
The median household size in Silver Lake is 2.34 persons per household, with single male/father households (56 | 13.9%) accounting for the largest median household size of 3.96 persons per household. non-family households (177 | 43.8%) represent the smallest median household size with 1.36 persons per household.
| Household Type | # Households | Household Size |
| Married-Couple | 140 (34.6%) | 2.62 |
| Single Male/Father | 56 (13.9%) | 3.96 |
| Single Female/Mother | 31 (7.7%) | 3.71 |
| Non-family | 177 (43.8%) | 1.36 |
| Total Households | 404 (100.0%) | 2.34 |
Household Size by Marriage Status in Silver Lake
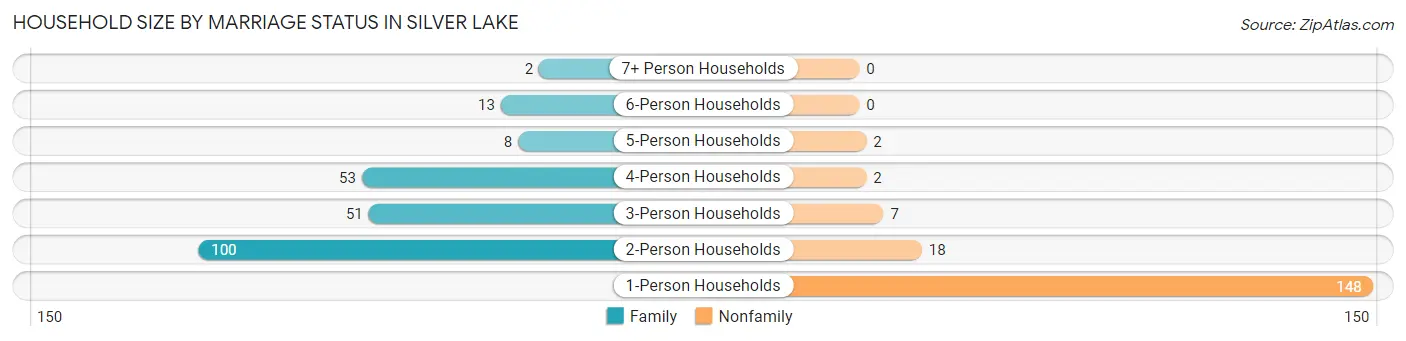
Out of a total of 404 households in Silver Lake, 227 (56.2%) are family households, while 177 (43.8%) are nonfamily households. The most numerous type of family households are 2-person households, comprising 100, and the most common type of nonfamily households are 1-person households, comprising 148.
| Household Size | Family Households | Nonfamily Households |
| 1-Person Households | - | 148 (36.6%) |
| 2-Person Households | 100 (24.7%) | 18 (4.5%) |
| 3-Person Households | 51 (12.6%) | 7 (1.7%) |
| 4-Person Households | 53 (13.1%) | 2 (0.5%) |
| 5-Person Households | 8 (2.0%) | 2 (0.5%) |
| 6-Person Households | 13 (3.2%) | 0 (0.0%) |
| 7+ Person Households | 2 (0.5%) | 0 (0.0%) |
| Total | 227 (56.2%) | 177 (43.8%) |
Female Fertility in Silver Lake
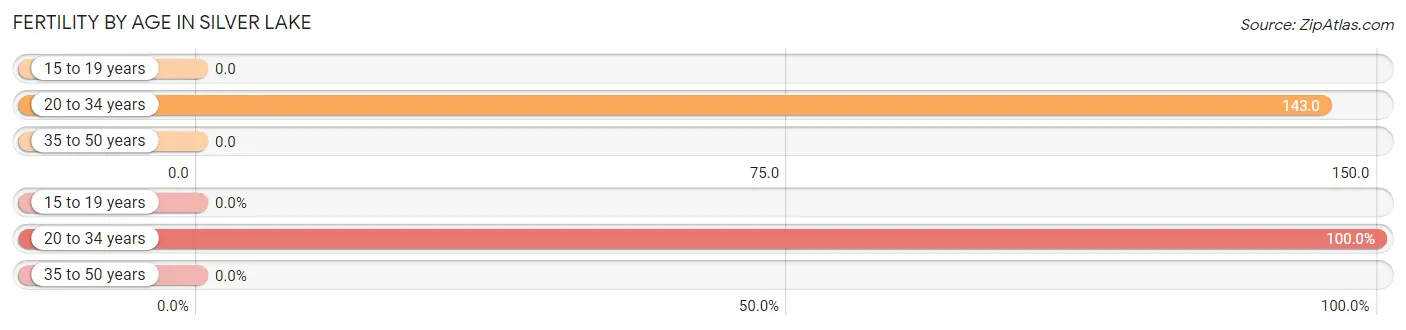
Fertility by Age in Silver Lake
Average fertility rate in Silver Lake is 66.0 births per 1,000 women. Women in the age bracket of 20 to 34 years have the highest fertility rate with 143.0 births per 1,000 women. Women in the age bracket of 20 to 34 years acount for 100.0% of all women with births.
| Age Bracket | Women with Births | Births / 1,000 Women |
| 15 to 19 years | 0 (0.0%) | 0.0 |
| 20 to 34 years | 14 (100.0%) | 143.0 |
| 35 to 50 years | 0 (0.0%) | 0.0 |
| Total | 14 (100.0%) | 66.0 |
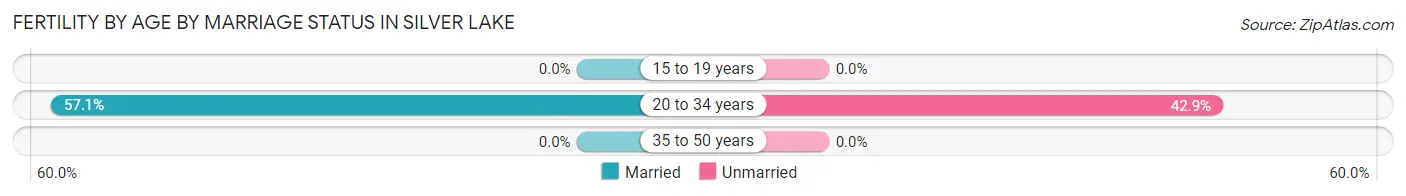
Fertility by Age by Marriage Status in Silver Lake
57.1% of women with births (14) in Silver Lake are married. The highest percentage of unmarried women with births falls into 20 to 34 years age bracket with 42.9% of them unmarried at the time of birth, while the lowest percentage of unmarried women with births belong to 20 to 34 years age bracket with 42.9% of them unmarried.
| Age Bracket | Married | Unmarried |
| 15 to 19 years | 0 (0.0%) | 0 (0.0%) |
| 20 to 34 years | 8 (57.1%) | 6 (42.9%) |
| 35 to 50 years | 0 (0.0%) | 0 (0.0%) |
| Total | 8 (57.1%) | 6 (42.9%) |
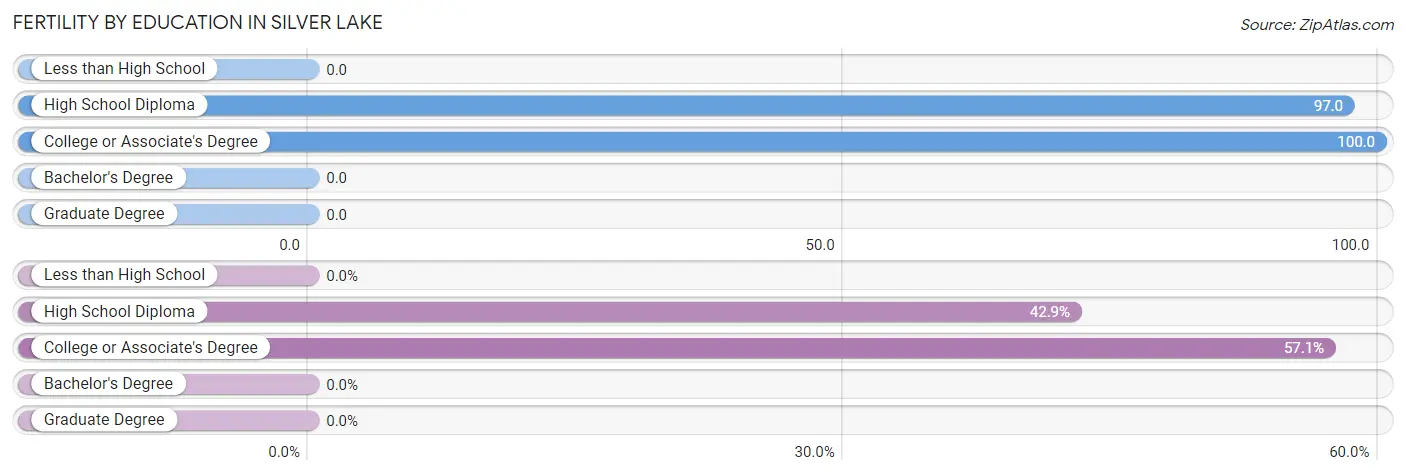
Fertility by Education in Silver Lake
| Educational Attainment | Women with Births | Births / 1,000 Women |
| Less than High School | 0 (0.0%) | 0.0 |
| High School Diploma | 6 (42.9%) | 97.0 |
| College or Associate's Degree | 8 (57.1%) | 100.0 |
| Bachelor's Degree | 0 (0.0%) | 0.0 |
| Graduate Degree | 0 (0.0%) | 0.0 |
| Total | 14 (100.0%) | 66.0 |
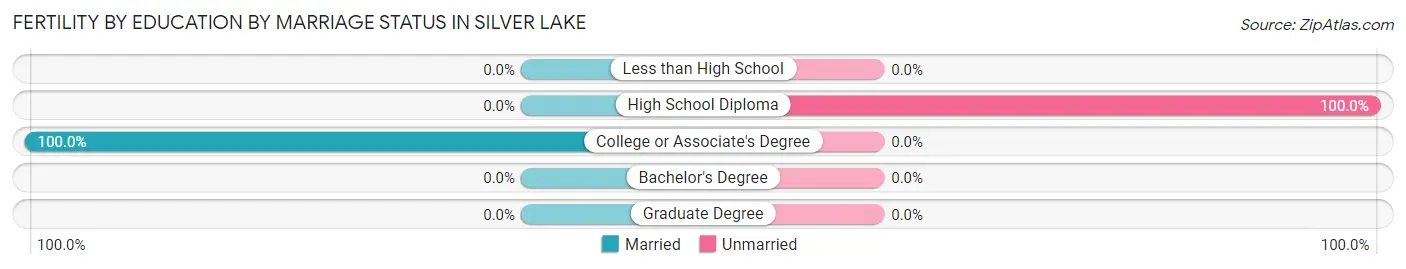
Fertility by Education by Marriage Status in Silver Lake
42.9% of women with births in Silver Lake are unmarried. Women with the educational attainment of college or associate's degree are most likely to be married with 100.0% of them married at childbirth, while women with the educational attainment of high school diploma are least likely to be married with 100.0% of them unmarried at childbirth.
| Educational Attainment | Married | Unmarried |
| Less than High School | 0 (0.0%) | 0 (0.0%) |
| High School Diploma | 0 (0.0%) | 6 (100.0%) |
| College or Associate's Degree | 8 (100.0%) | 0 (0.0%) |
| Bachelor's Degree | 0 (0.0%) | 0 (0.0%) |
| Graduate Degree | 0 (0.0%) | 0 (0.0%) |
| Total | 8 (57.1%) | 6 (42.9%) |
Employment Characteristics in Silver Lake
Employment by Class of Employer in Silver Lake
Among the 400 employed individuals in Silver Lake, private company employees (285 | 71.3%), self-employed (not incorporated) (52 | 13.0%), and not-for-profit organizations (26 | 6.5%) make up the most common classes of employment.
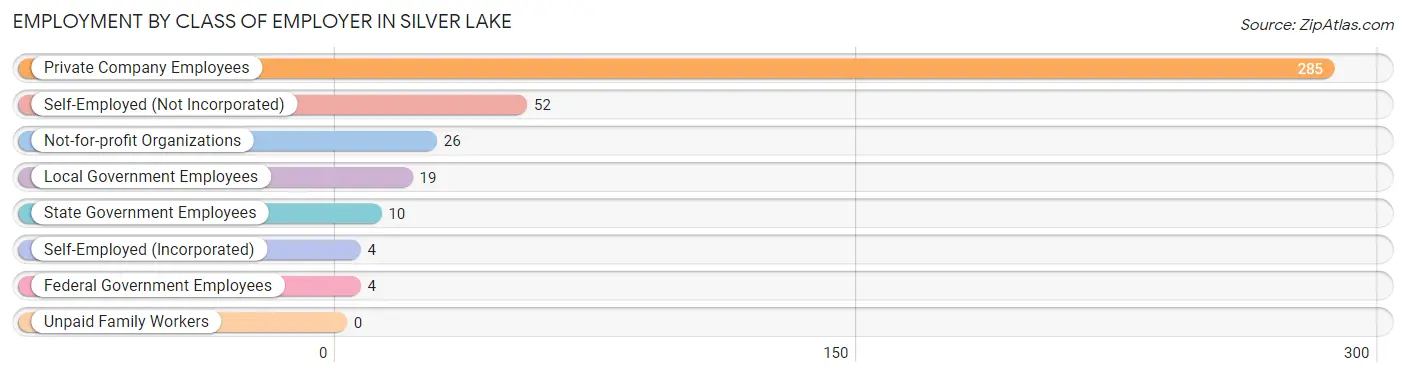
| Employer Class | # Employees | % Employees |
| Private Company Employees | 285 | 71.3% |
| Self-Employed (Incorporated) | 4 | 1.0% |
| Self-Employed (Not Incorporated) | 52 | 13.0% |
| Not-for-profit Organizations | 26 | 6.5% |
| Local Government Employees | 19 | 4.8% |
| State Government Employees | 10 | 2.5% |
| Federal Government Employees | 4 | 1.0% |
| Unpaid Family Workers | 0 | 0.0% |
| Total | 400 | 100.0% |
Employment Status by Age in Silver Lake
According to the labor force statistics for Silver Lake, out of the total population over 16 years of age (788), 55.8% or 440 individuals are in the labor force, with 7.7% or 34 of them unemployed. The age group with the highest labor force participation rate is 30 to 34 years, with 94.9% or 75 individuals in the labor force. Within the labor force, the 30 to 34 years age range has the highest percentage of unemployed individuals, with 16.0% or 12 of them being unemployed.
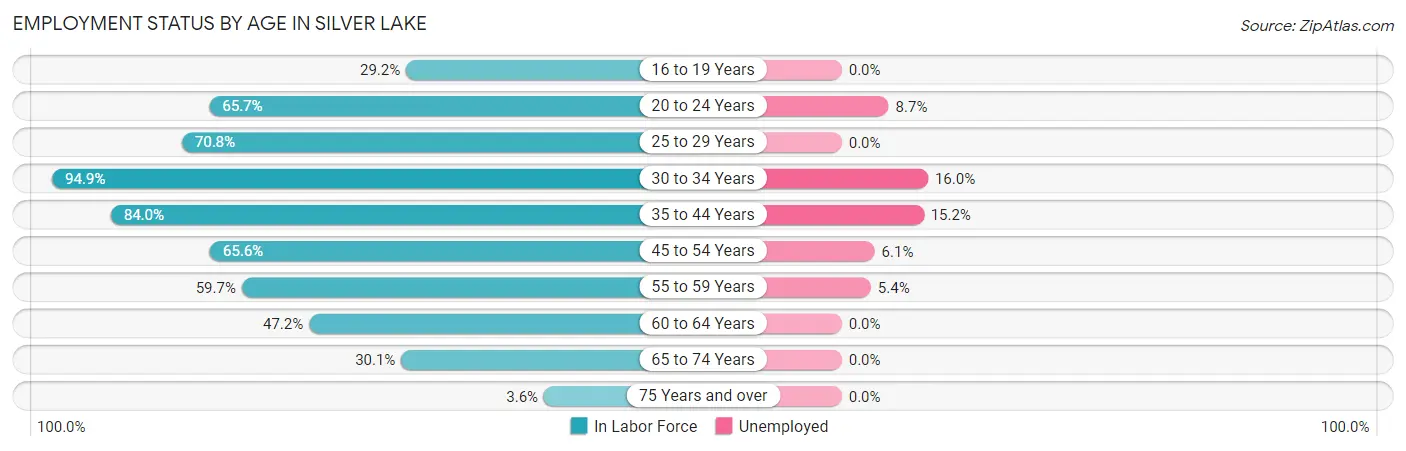
| Age Bracket | In Labor Force | Unemployed |
| 16 to 19 Years | 7 (29.2%) | 0 (0.0%) |
| 20 to 24 Years | 23 (65.7%) | 2 (8.7%) |
| 25 to 29 Years | 46 (70.8%) | 0 (0.0%) |
| 30 to 34 Years | 75 (94.9%) | 12 (16.0%) |
| 35 to 44 Years | 79 (84.0%) | 12 (15.2%) |
| 45 to 54 Years | 99 (65.6%) | 6 (6.1%) |
| 55 to 59 Years | 37 (59.7%) | 2 (5.4%) |
| 60 to 64 Years | 34 (47.2%) | 0 (0.0%) |
| 65 to 74 Years | 37 (30.1%) | 0 (0.0%) |
| 75 Years and over | 3 (3.6%) | 0 (0.0%) |
| Total | 440 (55.8%) | 34 (7.7%) |
Employment Status by Educational Attainment in Silver Lake
According to labor force statistics for Silver Lake, 70.7% of individuals (370) out of the total population between 25 and 64 years of age (523) are in the labor force, with 8.6% or 32 of them being unemployed. The group with the highest labor force participation rate are those with the educational attainment of bachelor's degree or higher, with 94.3% or 33 individuals in the labor force. Within the labor force, individuals with less than high school education have the highest percentage of unemployment, with 37.5% or 18 of them being unemployed.
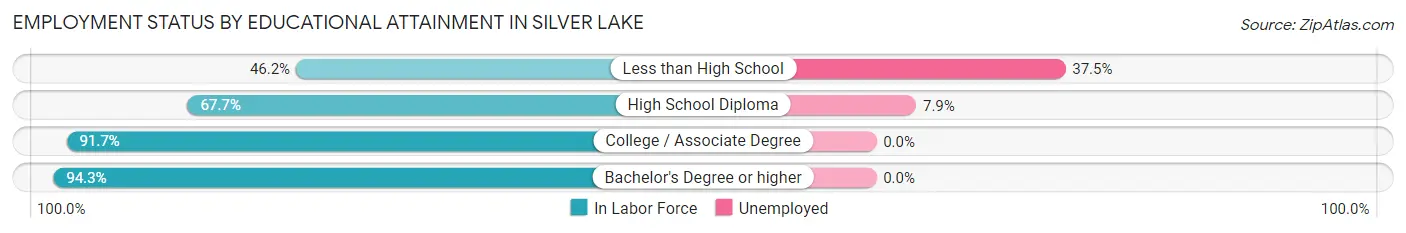
| Educational Attainment | In Labor Force | Unemployed |
| Less than High School | 48 (46.2%) | 39 (37.5%) |
| High School Diploma | 178 (67.7%) | 21 (7.9%) |
| College / Associate Degree | 111 (91.7%) | 0 (0.0%) |
| Bachelor's Degree or higher | 33 (94.3%) | 0 (0.0%) |
| Total | 370 (70.7%) | 45 (8.6%) |
Employment Occupations by Sex in Silver Lake
Management, Business, Science and Arts Occupations
The most common Management, Business, Science and Arts occupations in Silver Lake are Business & Financial (28 | 6.9%), Community & Social Service (26 | 6.4%), Education, Arts & Media (17 | 4.2%), Management (14 | 3.5%), and Education Instruction & Library (9 | 2.2%).
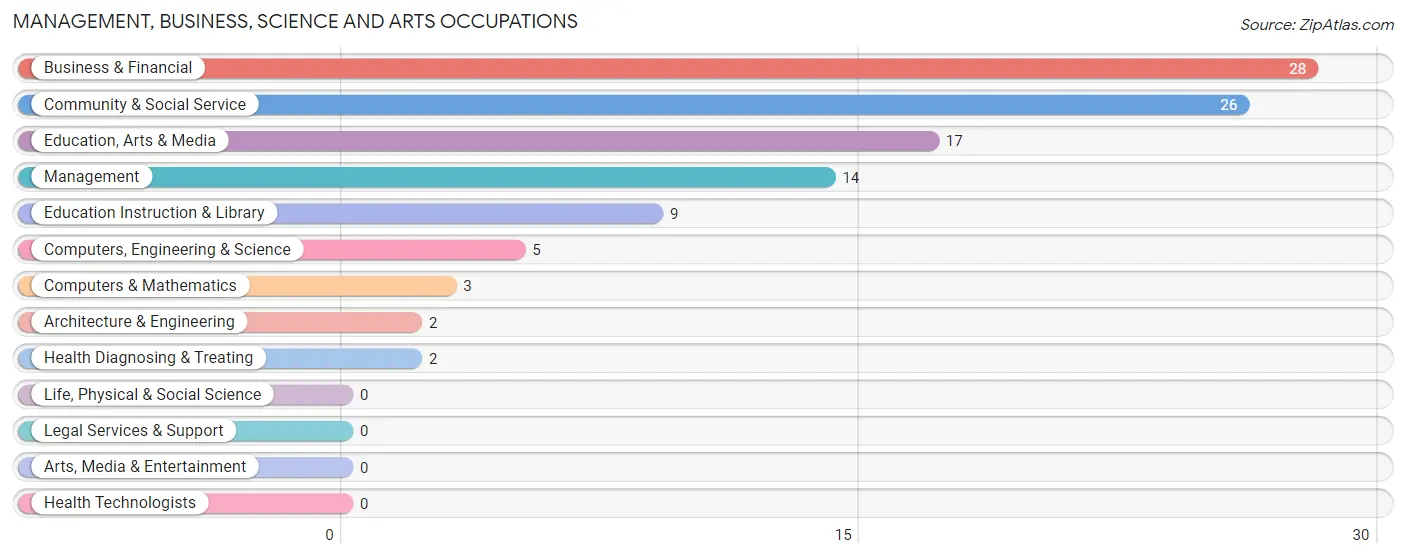
Management, Business, Science and Arts Occupations by Sex
Within the Management, Business, Science and Arts occupations in Silver Lake, the most male-oriented occupations are Computers & Mathematics (100.0%), Computers, Engineering & Science (60.0%), and Education, Arts & Media (58.8%), while the most female-oriented occupations are Architecture & Engineering (100.0%), Education Instruction & Library (100.0%), and Health Diagnosing & Treating (100.0%).
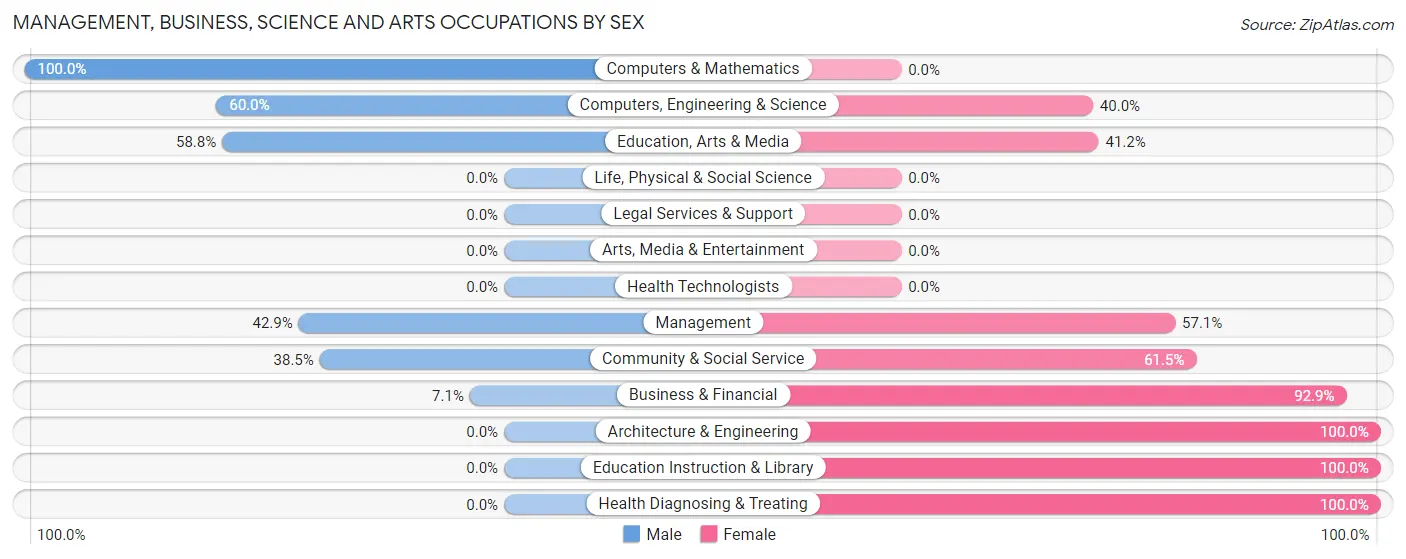
| Occupation | Male | Female |
| Management | 6 (42.9%) | 8 (57.1%) |
| Business & Financial | 2 (7.1%) | 26 (92.9%) |
| Computers, Engineering & Science | 3 (60.0%) | 2 (40.0%) |
| Computers & Mathematics | 3 (100.0%) | 0 (0.0%) |
| Architecture & Engineering | 0 (0.0%) | 2 (100.0%) |
| Life, Physical & Social Science | 0 (0.0%) | 0 (0.0%) |
| Community & Social Service | 10 (38.5%) | 16 (61.5%) |
| Education, Arts & Media | 10 (58.8%) | 7 (41.2%) |
| Legal Services & Support | 0 (0.0%) | 0 (0.0%) |
| Education Instruction & Library | 0 (0.0%) | 9 (100.0%) |
| Arts, Media & Entertainment | 0 (0.0%) | 0 (0.0%) |
| Health Diagnosing & Treating | 0 (0.0%) | 2 (100.0%) |
| Health Technologists | 0 (0.0%) | 0 (0.0%) |
| Total (Category) | 21 (28.0%) | 54 (72.0%) |
| Total (Overall) | 210 (51.7%) | 196 (48.3%) |
Services Occupations
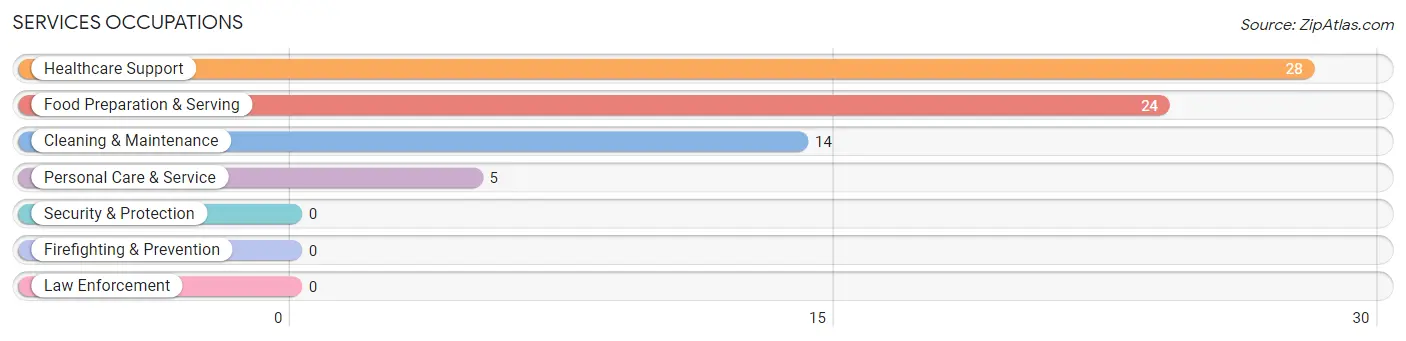
The most common Services occupations in Silver Lake are Healthcare Support (28 | 6.9%), Food Preparation & Serving (24 | 5.9%), Cleaning & Maintenance (14 | 3.5%), and Personal Care & Service (5 | 1.2%).
Services Occupations by Sex
Within the Services occupations in Silver Lake, the most male-oriented occupations are Cleaning & Maintenance (100.0%), and Healthcare Support (21.4%), while the most female-oriented occupations are Food Preparation & Serving (100.0%), Personal Care & Service (100.0%), and Healthcare Support (78.6%).
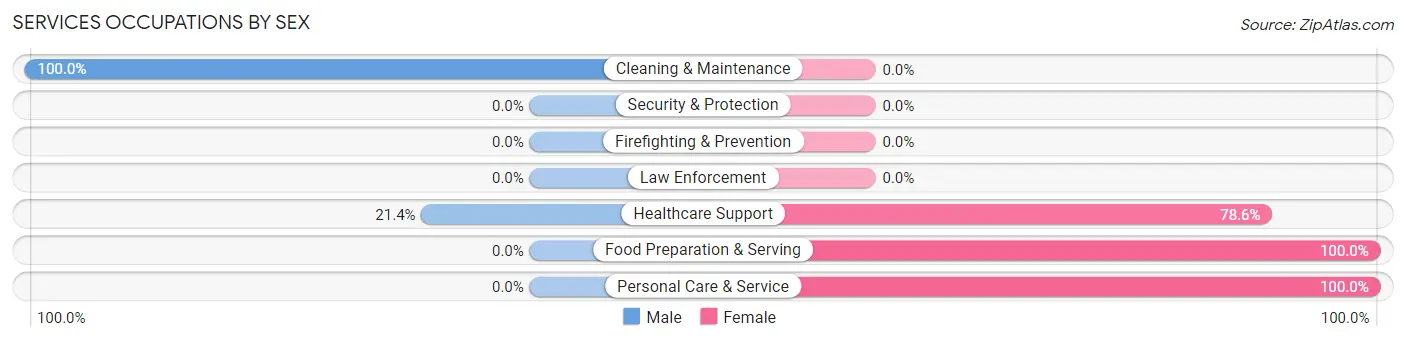
| Occupation | Male | Female |
| Healthcare Support | 6 (21.4%) | 22 (78.6%) |
| Security & Protection | 0 (0.0%) | 0 (0.0%) |
| Firefighting & Prevention | 0 (0.0%) | 0 (0.0%) |
| Law Enforcement | 0 (0.0%) | 0 (0.0%) |
| Food Preparation & Serving | 0 (0.0%) | 24 (100.0%) |
| Cleaning & Maintenance | 14 (100.0%) | 0 (0.0%) |
| Personal Care & Service | 0 (0.0%) | 5 (100.0%) |
| Total (Category) | 20 (28.2%) | 51 (71.8%) |
| Total (Overall) | 210 (51.7%) | 196 (48.3%) |
Sales and Office Occupations
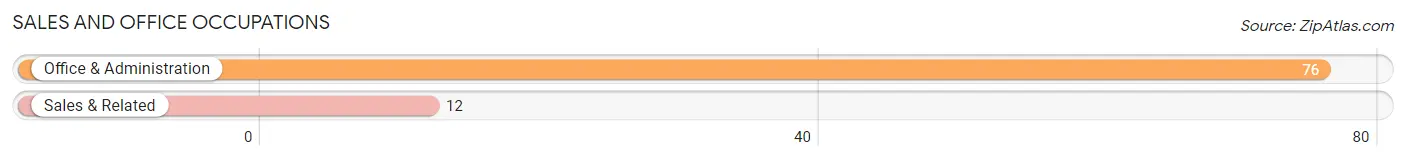
The most common Sales and Office occupations in Silver Lake are Office & Administration (76 | 18.7%), and Sales & Related (12 | 3.0%).
Sales and Office Occupations by Sex
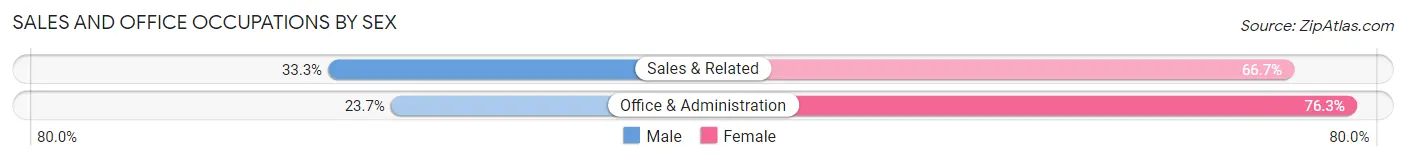
| Occupation | Male | Female |
| Sales & Related | 4 (33.3%) | 8 (66.7%) |
| Office & Administration | 18 (23.7%) | 58 (76.3%) |
| Total (Category) | 22 (25.0%) | 66 (75.0%) |
| Total (Overall) | 210 (51.7%) | 196 (48.3%) |
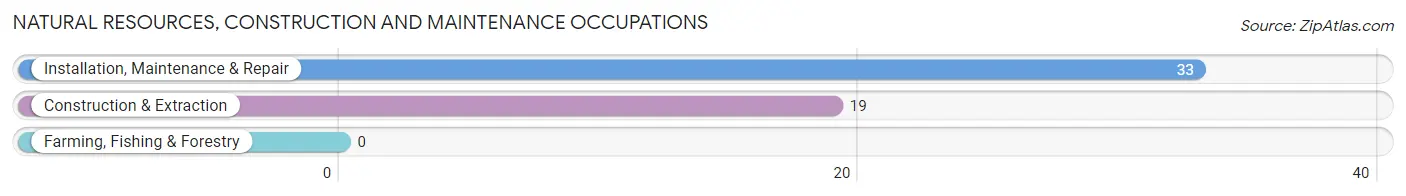
Natural Resources, Construction and Maintenance Occupations
The most common Natural Resources, Construction and Maintenance occupations in Silver Lake are Installation, Maintenance & Repair (33 | 8.1%), and Construction & Extraction (19 | 4.7%).
Natural Resources, Construction and Maintenance Occupations by Sex
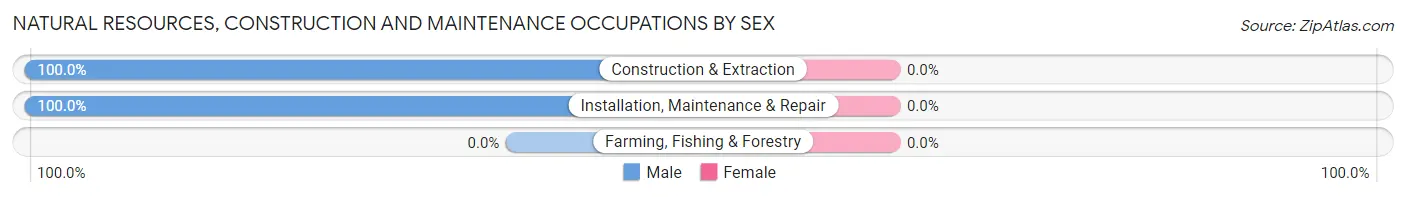
| Occupation | Male | Female |
| Farming, Fishing & Forestry | 0 (0.0%) | 0 (0.0%) |
| Construction & Extraction | 19 (100.0%) | 0 (0.0%) |
| Installation, Maintenance & Repair | 33 (100.0%) | 0 (0.0%) |
| Total (Category) | 52 (100.0%) | 0 (0.0%) |
| Total (Overall) | 210 (51.7%) | 196 (48.3%) |
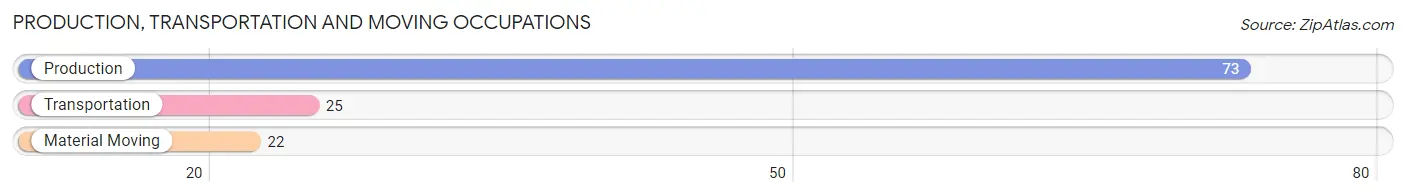
Production, Transportation and Moving Occupations
The most common Production, Transportation and Moving occupations in Silver Lake are Production (73 | 18.0%), Transportation (25 | 6.2%), and Material Moving (22 | 5.4%).
Production, Transportation and Moving Occupations by Sex
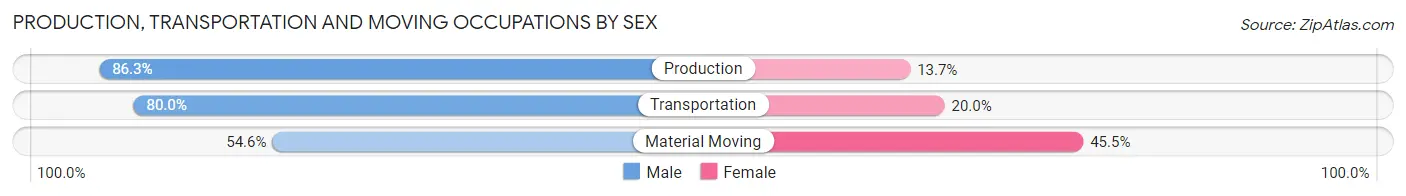
| Occupation | Male | Female |
| Production | 63 (86.3%) | 10 (13.7%) |
| Transportation | 20 (80.0%) | 5 (20.0%) |
| Material Moving | 12 (54.5%) | 10 (45.5%) |
| Total (Category) | 95 (79.2%) | 25 (20.8%) |
| Total (Overall) | 210 (51.7%) | 196 (48.3%) |
Employment Industries by Sex in Silver Lake
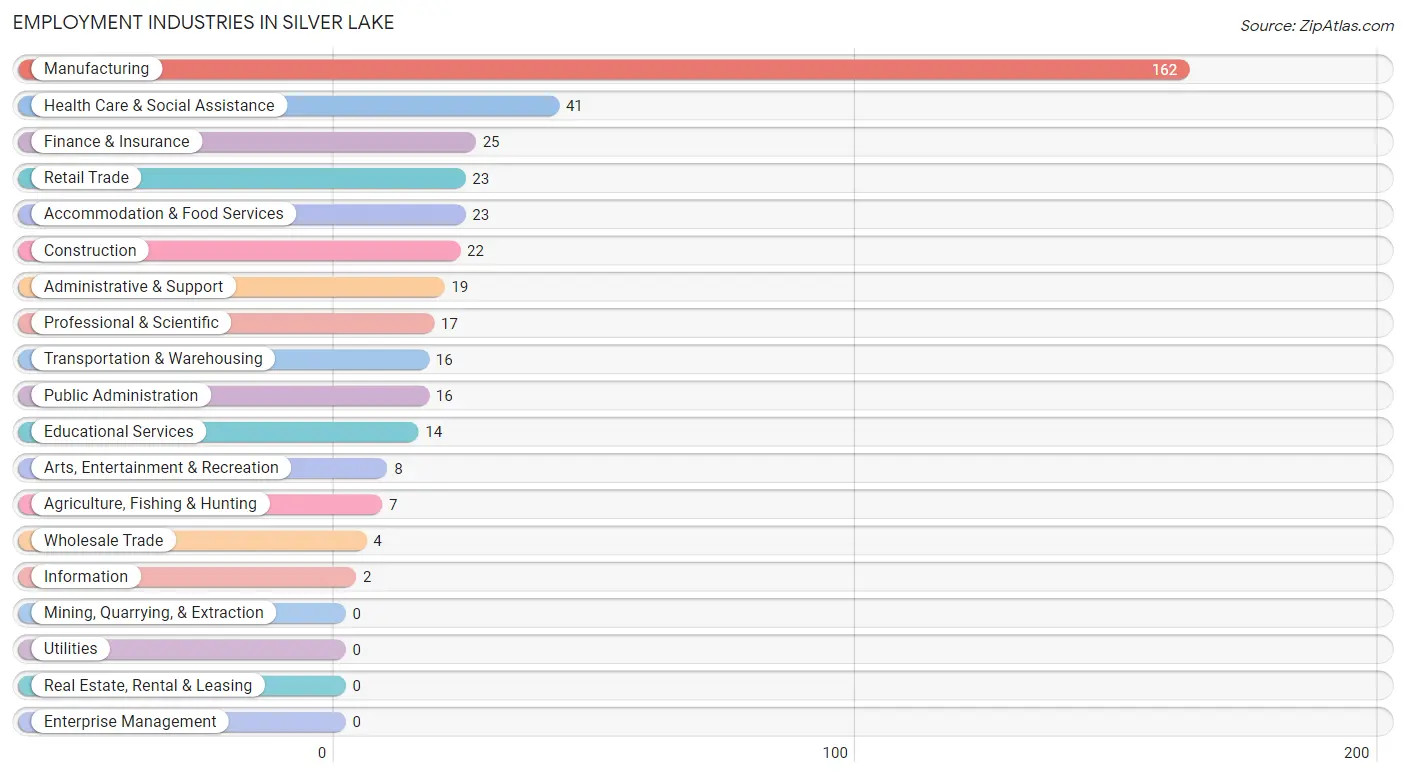
Employment Industries in Silver Lake
The major employment industries in Silver Lake include Manufacturing (162 | 39.9%), Health Care & Social Assistance (41 | 10.1%), Finance & Insurance (25 | 6.2%), Retail Trade (23 | 5.7%), and Accommodation & Food Services (23 | 5.7%).
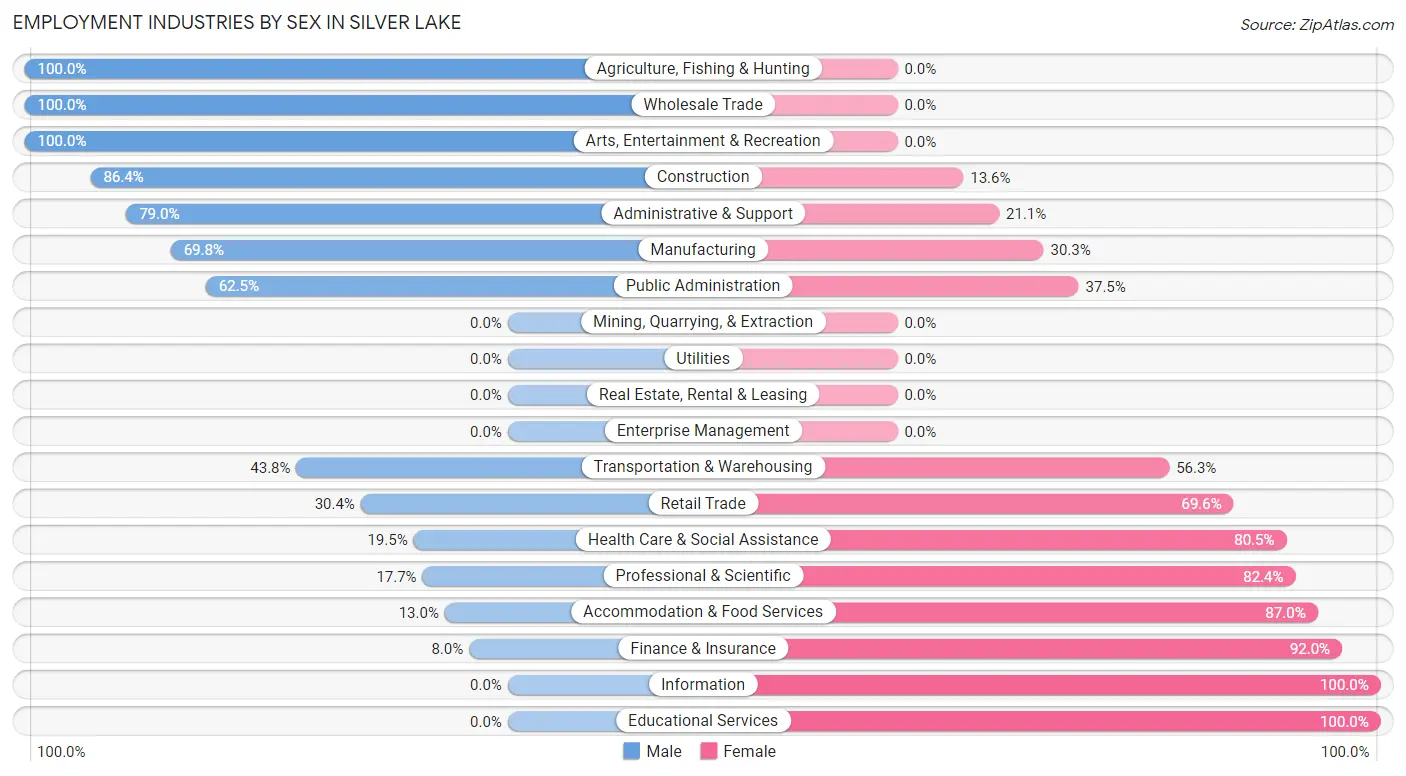
Employment Industries by Sex in Silver Lake
The Silver Lake industries that see more men than women are Agriculture, Fishing & Hunting (100.0%), Wholesale Trade (100.0%), and Arts, Entertainment & Recreation (100.0%), whereas the industries that tend to have a higher number of women are Information (100.0%), Educational Services (100.0%), and Finance & Insurance (92.0%).
| Industry | Male | Female |
| Agriculture, Fishing & Hunting | 7 (100.0%) | 0 (0.0%) |
| Mining, Quarrying, & Extraction | 0 (0.0%) | 0 (0.0%) |
| Construction | 19 (86.4%) | 3 (13.6%) |
| Manufacturing | 113 (69.8%) | 49 (30.2%) |
| Wholesale Trade | 4 (100.0%) | 0 (0.0%) |
| Retail Trade | 7 (30.4%) | 16 (69.6%) |
| Transportation & Warehousing | 7 (43.8%) | 9 (56.2%) |
| Utilities | 0 (0.0%) | 0 (0.0%) |
| Information | 0 (0.0%) | 2 (100.0%) |
| Finance & Insurance | 2 (8.0%) | 23 (92.0%) |
| Real Estate, Rental & Leasing | 0 (0.0%) | 0 (0.0%) |
| Professional & Scientific | 3 (17.6%) | 14 (82.4%) |
| Enterprise Management | 0 (0.0%) | 0 (0.0%) |
| Administrative & Support | 15 (78.9%) | 4 (21.0%) |
| Educational Services | 0 (0.0%) | 14 (100.0%) |
| Health Care & Social Assistance | 8 (19.5%) | 33 (80.5%) |
| Arts, Entertainment & Recreation | 8 (100.0%) | 0 (0.0%) |
| Accommodation & Food Services | 3 (13.0%) | 20 (87.0%) |
| Public Administration | 10 (62.5%) | 6 (37.5%) |
| Total | 210 (51.7%) | 196 (48.3%) |
Education in Silver Lake
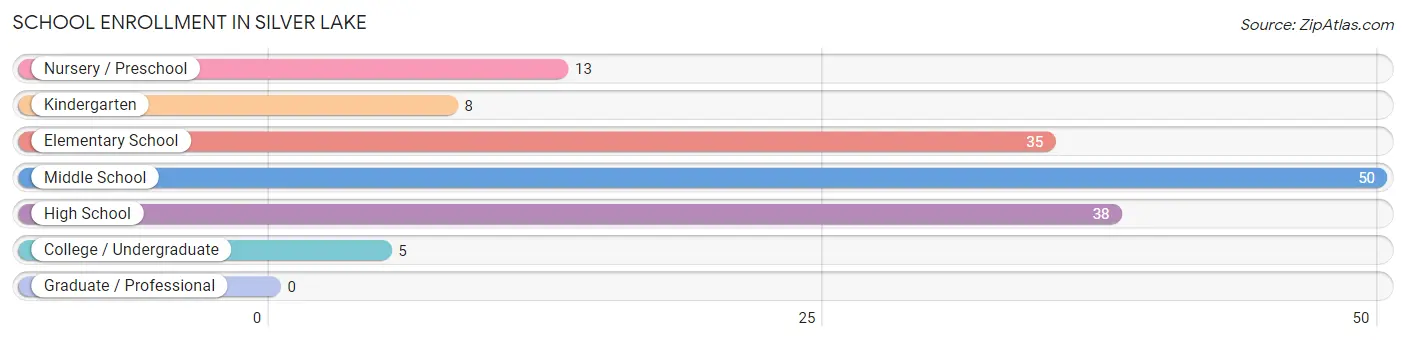
School Enrollment in Silver Lake
The most common levels of schooling among the 149 students in Silver Lake are middle school (50 | 33.6%), high school (38 | 25.5%), and elementary school (35 | 23.5%).
| School Level | # Students | % Students |
| Nursery / Preschool | 13 | 8.7% |
| Kindergarten | 8 | 5.4% |
| Elementary School | 35 | 23.5% |
| Middle School | 50 | 33.6% |
| High School | 38 | 25.5% |
| College / Undergraduate | 5 | 3.4% |
| Graduate / Professional | 0 | 0.0% |
| Total | 149 | 100.0% |
School Enrollment by Age by Funding Source in Silver Lake
Out of a total of 149 students who are enrolled in schools in Silver Lake, 31 (20.8%) attend a private institution, while the remaining 118 (79.2%) are enrolled in public schools. The age group of 10 to 14 year olds has the highest likelihood of being enrolled in private schools, with 26 (38.8% in the age bracket) enrolled. Conversely, the age group of 3 to 4 year olds has the lowest likelihood of being enrolled in a private school, with 7 (100.0% in the age bracket) attending a public institution.
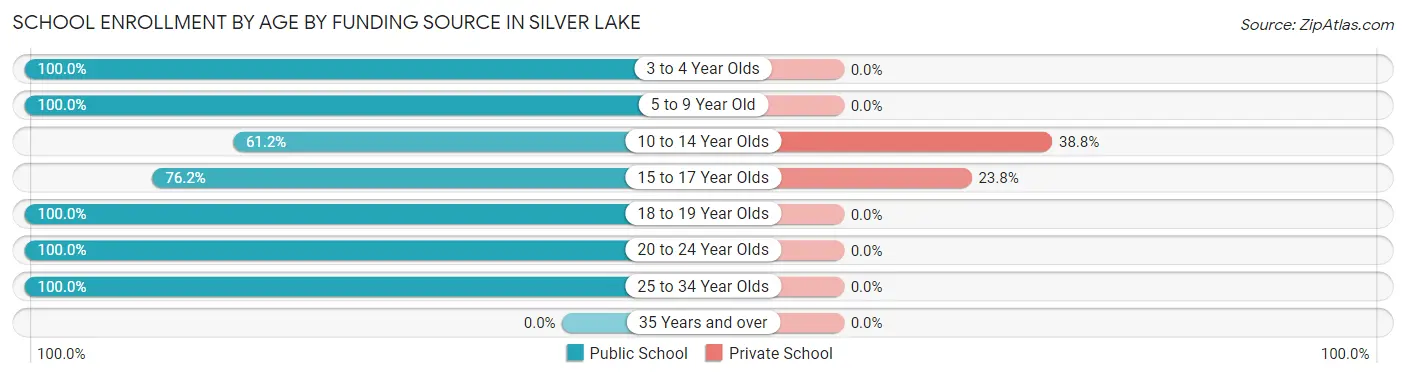
| Age Bracket | Public School | Private School |
| 3 to 4 Year Olds | 7 (100.0%) | 0 (0.0%) |
| 5 to 9 Year Old | 44 (100.0%) | 0 (0.0%) |
| 10 to 14 Year Olds | 41 (61.2%) | 26 (38.8%) |
| 15 to 17 Year Olds | 16 (76.2%) | 5 (23.8%) |
| 18 to 19 Year Olds | 5 (100.0%) | 0 (0.0%) |
| 20 to 24 Year Olds | 2 (100.0%) | 0 (0.0%) |
| 25 to 34 Year Olds | 3 (100.0%) | 0 (0.0%) |
| 35 Years and over | 0 (0.0%) | 0 (0.0%) |
| Total | 118 (79.2%) | 31 (20.8%) |
Educational Attainment by Field of Study in Silver Lake
Education (15 | 31.9%), business (7 | 14.9%), arts & humanities (7 | 14.9%), liberal arts & history (5 | 10.6%), and visual & performing arts (4 | 8.5%) are the most common fields of study among 47 individuals in Silver Lake who have obtained a bachelor's degree or higher.
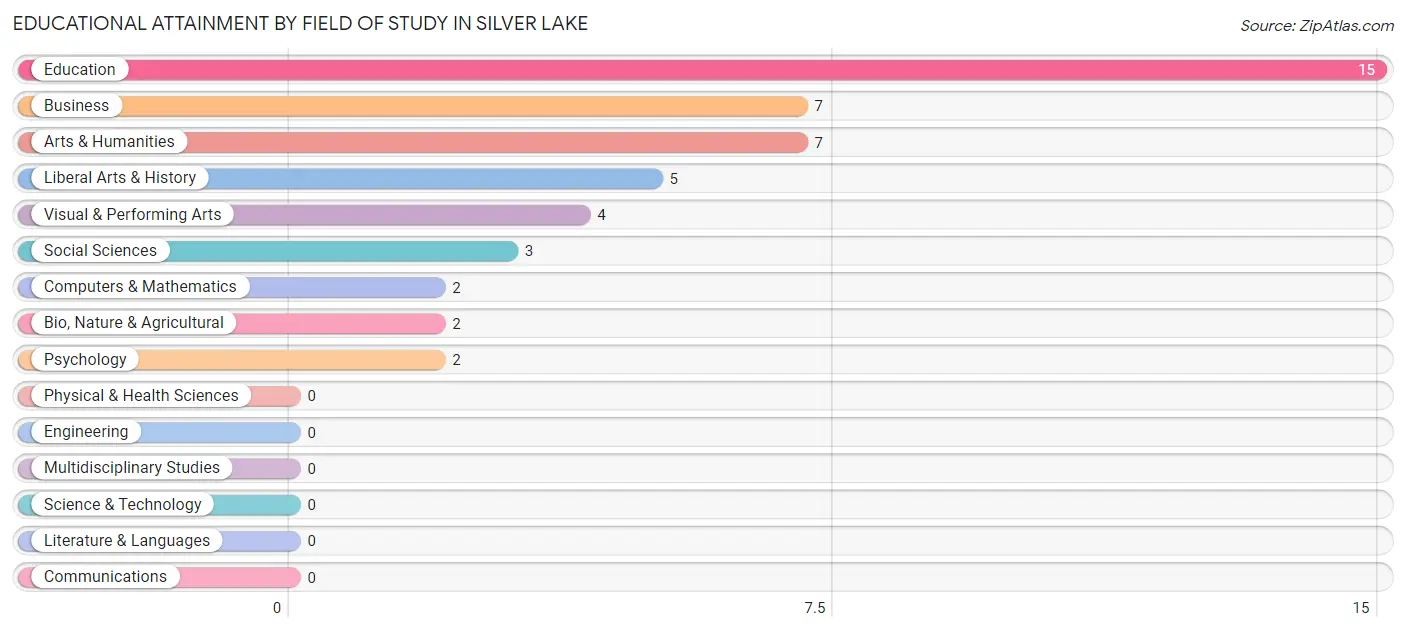
| Field of Study | # Graduates | % Graduates |
| Computers & Mathematics | 2 | 4.3% |
| Bio, Nature & Agricultural | 2 | 4.3% |
| Physical & Health Sciences | 0 | 0.0% |
| Psychology | 2 | 4.3% |
| Social Sciences | 3 | 6.4% |
| Engineering | 0 | 0.0% |
| Multidisciplinary Studies | 0 | 0.0% |
| Science & Technology | 0 | 0.0% |
| Business | 7 | 14.9% |
| Education | 15 | 31.9% |
| Literature & Languages | 0 | 0.0% |
| Liberal Arts & History | 5 | 10.6% |
| Visual & Performing Arts | 4 | 8.5% |
| Communications | 0 | 0.0% |
| Arts & Humanities | 7 | 14.9% |
| Total | 47 | 100.0% |
Transportation & Commute in Silver Lake
Vehicle Availability by Sex in Silver Lake
The most prevalent vehicle ownership categories in Silver Lake are males with 2 vehicles (93, accounting for 44.9%) and females with 2 vehicles (57, making up 48.2%).
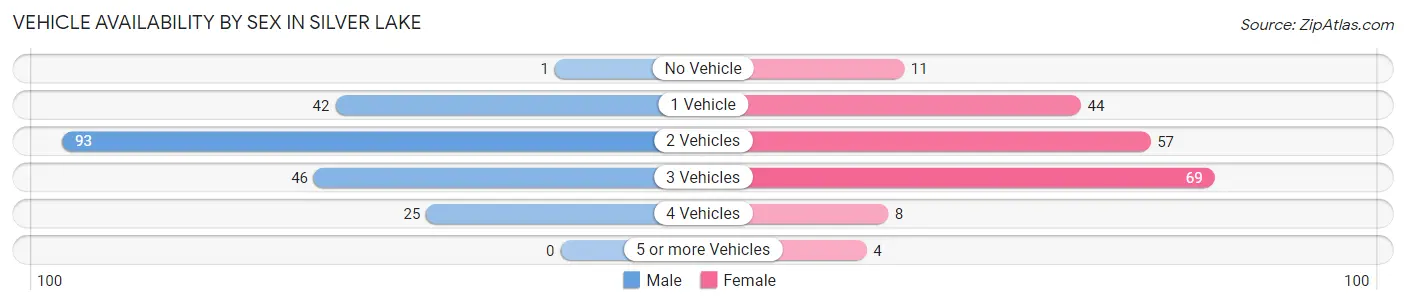
| Vehicles Available | Male | Female |
| No Vehicle | 1 (0.5%) | 11 (5.7%) |
| 1 Vehicle | 42 (20.3%) | 44 (22.8%) |
| 2 Vehicles | 93 (44.9%) | 57 (29.5%) |
| 3 Vehicles | 46 (22.2%) | 69 (35.7%) |
| 4 Vehicles | 25 (12.1%) | 8 (4.2%) |
| 5 or more Vehicles | 0 (0.0%) | 4 (2.1%) |
| Total | 207 (100.0%) | 193 (100.0%) |
Commute Time in Silver Lake
The most frequently occuring commute durations in Silver Lake are 30 to 34 minutes (149 commuters, 37.7%), 20 to 24 minutes (75 commuters, 19.0%), and 25 to 29 minutes (46 commuters, 11.7%).
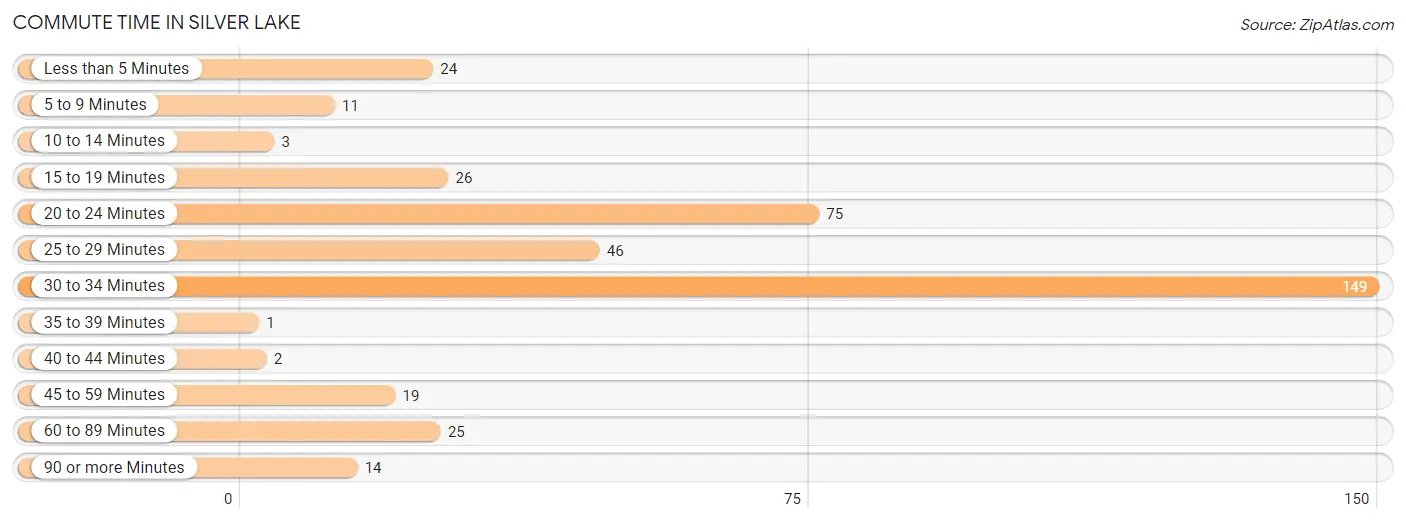
| Commute Time | # Commuters | % Commuters |
| Less than 5 Minutes | 24 | 6.1% |
| 5 to 9 Minutes | 11 | 2.8% |
| 10 to 14 Minutes | 3 | 0.8% |
| 15 to 19 Minutes | 26 | 6.6% |
| 20 to 24 Minutes | 75 | 19.0% |
| 25 to 29 Minutes | 46 | 11.7% |
| 30 to 34 Minutes | 149 | 37.7% |
| 35 to 39 Minutes | 1 | 0.3% |
| 40 to 44 Minutes | 2 | 0.5% |
| 45 to 59 Minutes | 19 | 4.8% |
| 60 to 89 Minutes | 25 | 6.3% |
| 90 or more Minutes | 14 | 3.5% |
Commute Time by Sex in Silver Lake
The most common commute times in Silver Lake are 30 to 34 minutes (69 commuters, 33.3%) for males and 30 to 34 minutes (80 commuters, 42.5%) for females.
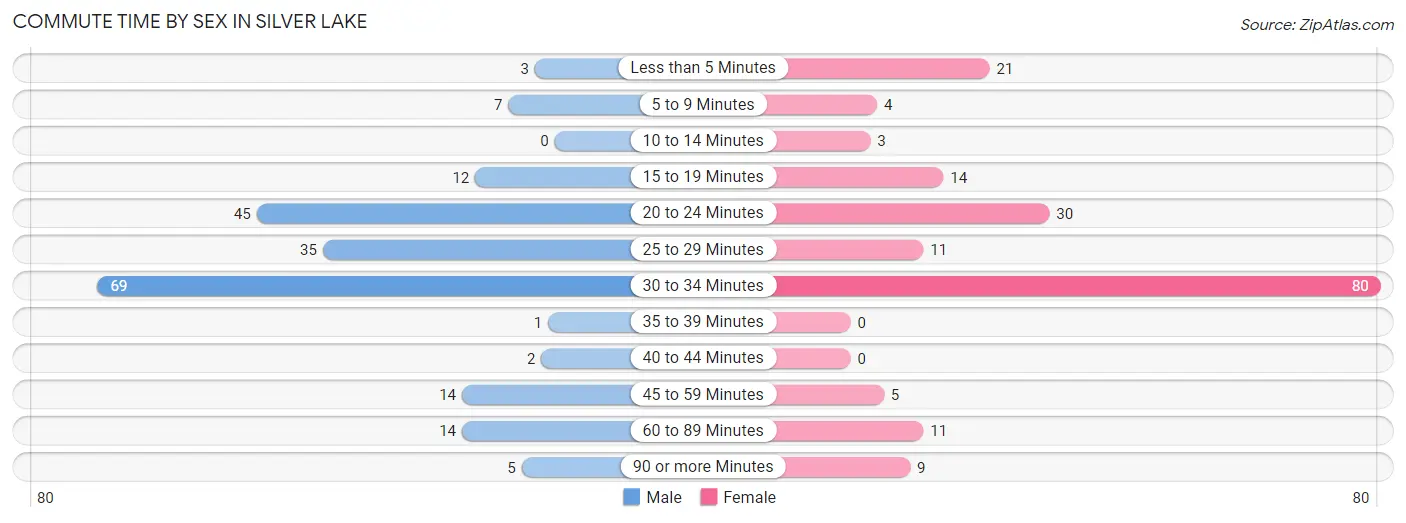
| Commute Time | Male | Female |
| Less than 5 Minutes | 3 (1.5%) | 21 (11.2%) |
| 5 to 9 Minutes | 7 (3.4%) | 4 (2.1%) |
| 10 to 14 Minutes | 0 (0.0%) | 3 (1.6%) |
| 15 to 19 Minutes | 12 (5.8%) | 14 (7.4%) |
| 20 to 24 Minutes | 45 (21.7%) | 30 (16.0%) |
| 25 to 29 Minutes | 35 (16.9%) | 11 (5.9%) |
| 30 to 34 Minutes | 69 (33.3%) | 80 (42.5%) |
| 35 to 39 Minutes | 1 (0.5%) | 0 (0.0%) |
| 40 to 44 Minutes | 2 (1.0%) | 0 (0.0%) |
| 45 to 59 Minutes | 14 (6.8%) | 5 (2.7%) |
| 60 to 89 Minutes | 14 (6.8%) | 11 (5.9%) |
| 90 or more Minutes | 5 (2.4%) | 9 (4.8%) |
Time of Departure to Work by Sex in Silver Lake
The most frequent times of departure to work in Silver Lake are 12:00 AM to 4:59 AM (42, 20.3%) for males and 7:00 AM to 7:29 AM (46, 24.5%) for females.
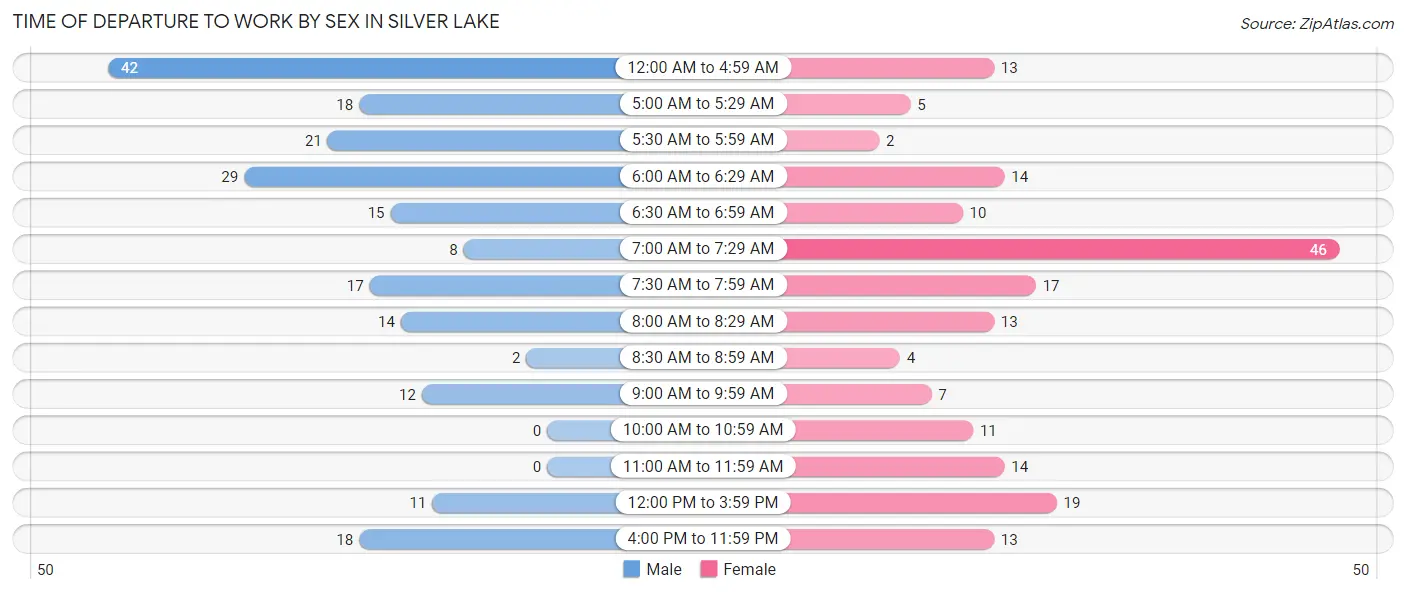
| Time of Departure | Male | Female |
| 12:00 AM to 4:59 AM | 42 (20.3%) | 13 (6.9%) |
| 5:00 AM to 5:29 AM | 18 (8.7%) | 5 (2.7%) |
| 5:30 AM to 5:59 AM | 21 (10.1%) | 2 (1.1%) |
| 6:00 AM to 6:29 AM | 29 (14.0%) | 14 (7.4%) |
| 6:30 AM to 6:59 AM | 15 (7.2%) | 10 (5.3%) |
| 7:00 AM to 7:29 AM | 8 (3.9%) | 46 (24.5%) |
| 7:30 AM to 7:59 AM | 17 (8.2%) | 17 (9.0%) |
| 8:00 AM to 8:29 AM | 14 (6.8%) | 13 (6.9%) |
| 8:30 AM to 8:59 AM | 2 (1.0%) | 4 (2.1%) |
| 9:00 AM to 9:59 AM | 12 (5.8%) | 7 (3.7%) |
| 10:00 AM to 10:59 AM | 0 (0.0%) | 11 (5.9%) |
| 11:00 AM to 11:59 AM | 0 (0.0%) | 14 (7.4%) |
| 12:00 PM to 3:59 PM | 11 (5.3%) | 19 (10.1%) |
| 4:00 PM to 11:59 PM | 18 (8.7%) | 13 (6.9%) |
| Total | 207 (100.0%) | 188 (100.0%) |
Housing Occupancy in Silver Lake
Occupancy by Ownership in Silver Lake
Of the total 404 dwellings in Silver Lake, owner-occupied units account for 309 (76.5%), while renter-occupied units make up 95 (23.5%).
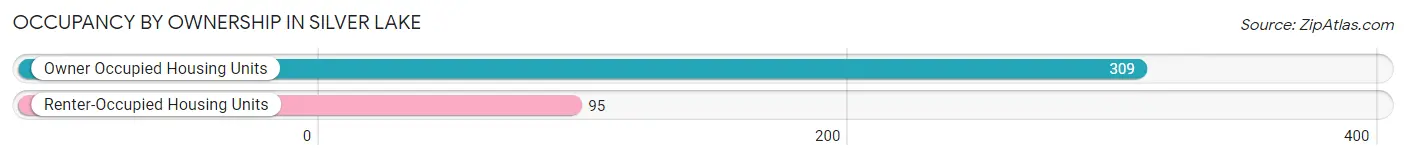
| Occupancy | # Housing Units | % Housing Units |
| Owner Occupied Housing Units | 309 | 76.5% |
| Renter-Occupied Housing Units | 95 | 23.5% |
| Total Occupied Housing Units | 404 | 100.0% |
Occupancy by Household Size in Silver Lake
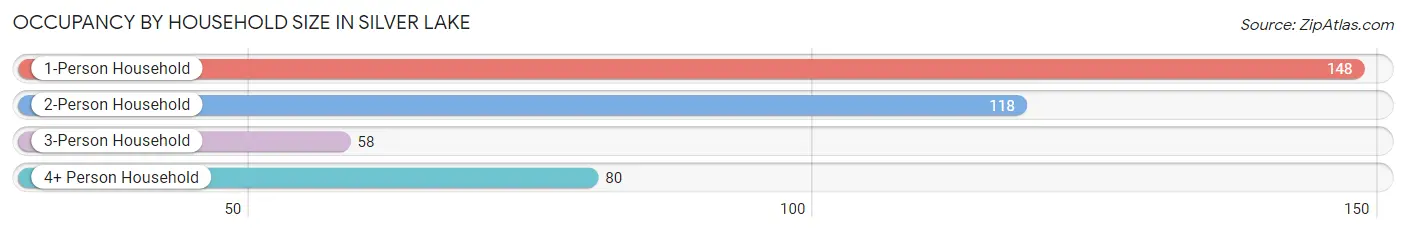
| Household Size | # Housing Units | % Housing Units |
| 1-Person Household | 148 | 36.6% |
| 2-Person Household | 118 | 29.2% |
| 3-Person Household | 58 | 14.4% |
| 4+ Person Household | 80 | 19.8% |
| Total Housing Units | 404 | 100.0% |
Occupancy by Ownership by Household Size in Silver Lake
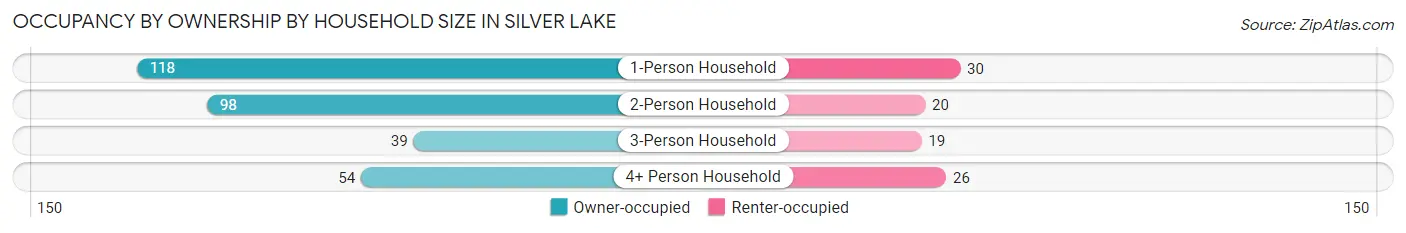
| Household Size | Owner-occupied | Renter-occupied |
| 1-Person Household | 118 (79.7%) | 30 (20.3%) |
| 2-Person Household | 98 (83.1%) | 20 (17.0%) |
| 3-Person Household | 39 (67.2%) | 19 (32.8%) |
| 4+ Person Household | 54 (67.5%) | 26 (32.5%) |
| Total Housing Units | 309 (76.5%) | 95 (23.5%) |
Occupancy by Educational Attainment in Silver Lake
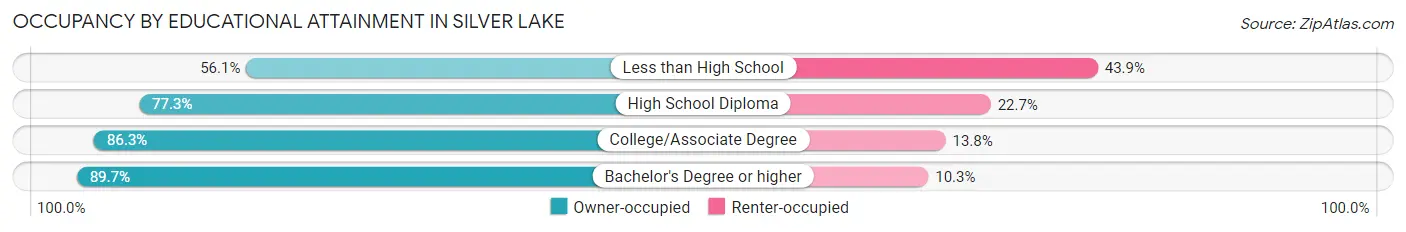
| Household Size | Owner-occupied | Renter-occupied |
| Less than High School | 37 (56.1%) | 29 (43.9%) |
| High School Diploma | 177 (77.3%) | 52 (22.7%) |
| College/Associate Degree | 69 (86.3%) | 11 (13.8%) |
| Bachelor's Degree or higher | 26 (89.7%) | 3 (10.3%) |
Occupancy by Age of Householder in Silver Lake
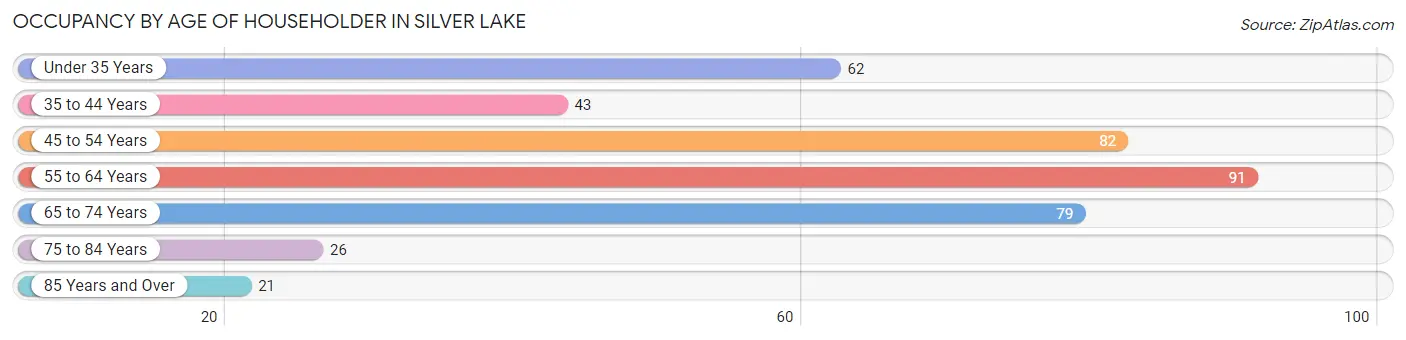
| Age Bracket | # Households | % Households |
| Under 35 Years | 62 | 15.3% |
| 35 to 44 Years | 43 | 10.6% |
| 45 to 54 Years | 82 | 20.3% |
| 55 to 64 Years | 91 | 22.5% |
| 65 to 74 Years | 79 | 19.6% |
| 75 to 84 Years | 26 | 6.4% |
| 85 Years and Over | 21 | 5.2% |
| Total | 404 | 100.0% |
Housing Finances in Silver Lake
Median Income by Occupancy in Silver Lake
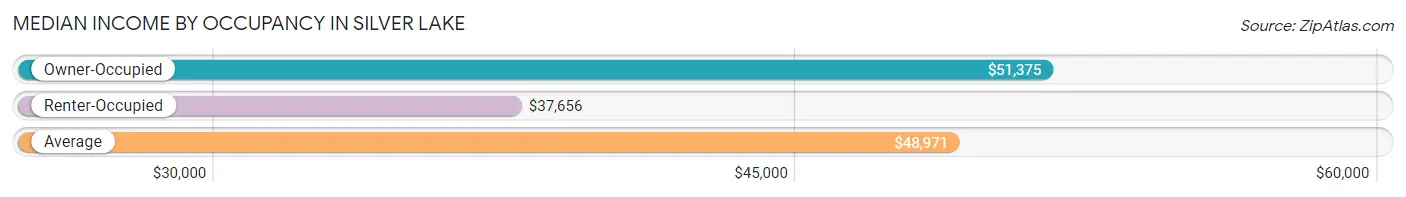
| Occupancy Type | # Households | Median Income |
| Owner-Occupied | 309 (76.5%) | $51,375 |
| Renter-Occupied | 95 (23.5%) | $37,656 |
| Average | 404 (100.0%) | $48,971 |
Occupancy by Householder Income Bracket in Silver Lake
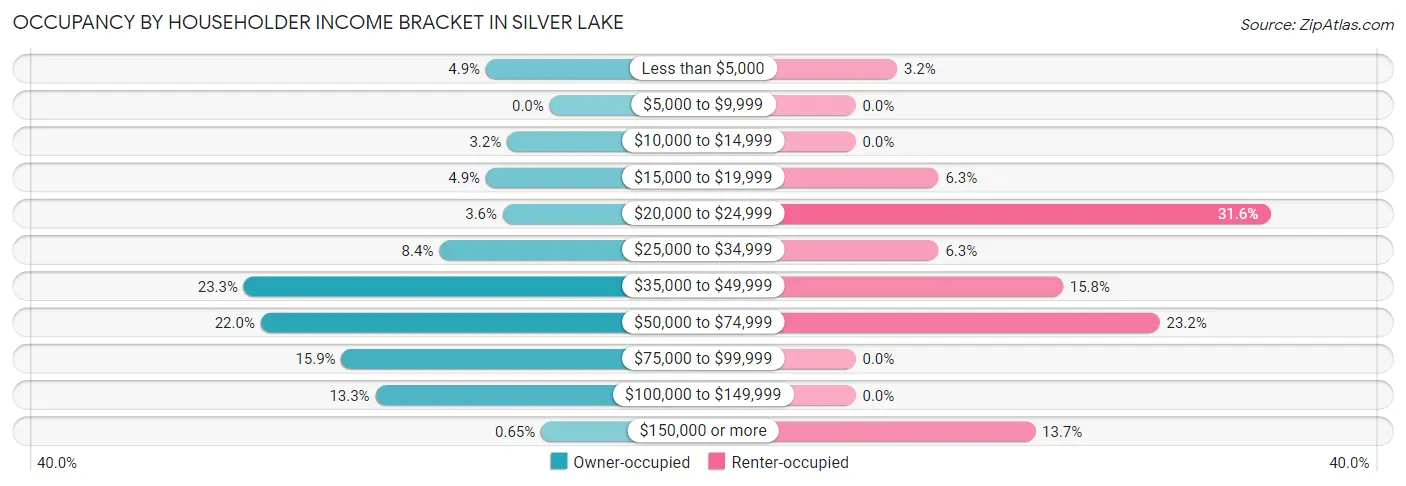
| Income Bracket | Owner-occupied | Renter-occupied |
| Less than $5,000 | 15 (4.9%) | 3 (3.2%) |
| $5,000 to $9,999 | 0 (0.0%) | 0 (0.0%) |
| $10,000 to $14,999 | 10 (3.2%) | 0 (0.0%) |
| $15,000 to $19,999 | 15 (4.9%) | 6 (6.3%) |
| $20,000 to $24,999 | 11 (3.6%) | 30 (31.6%) |
| $25,000 to $34,999 | 26 (8.4%) | 6 (6.3%) |
| $35,000 to $49,999 | 72 (23.3%) | 15 (15.8%) |
| $50,000 to $74,999 | 68 (22.0%) | 22 (23.2%) |
| $75,000 to $99,999 | 49 (15.9%) | 0 (0.0%) |
| $100,000 to $149,999 | 41 (13.3%) | 0 (0.0%) |
| $150,000 or more | 2 (0.6%) | 13 (13.7%) |
| Total | 309 (100.0%) | 95 (100.0%) |
Monthly Housing Cost Tiers in Silver Lake
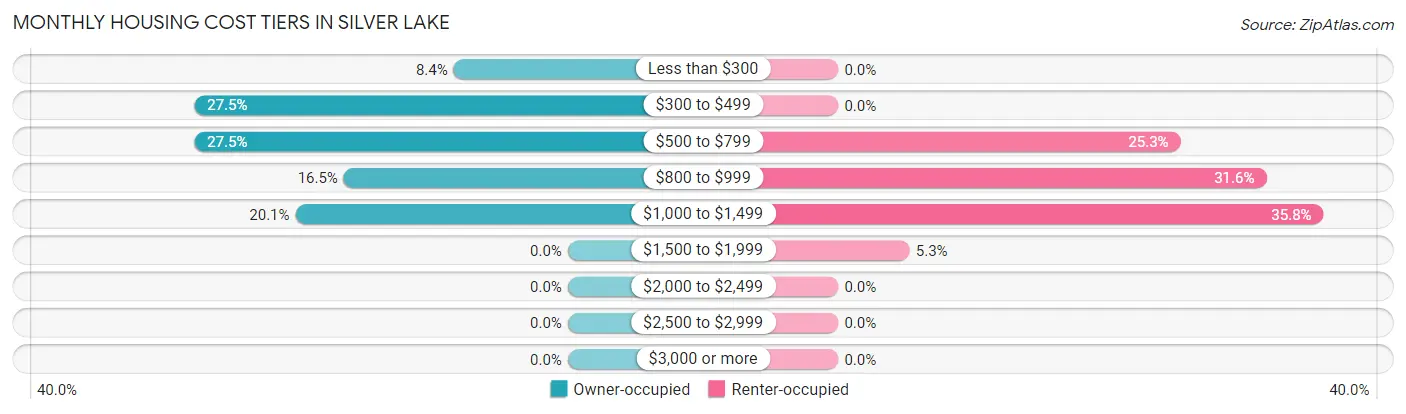
| Monthly Cost | Owner-occupied | Renter-occupied |
| Less than $300 | 26 (8.4%) | 0 (0.0%) |
| $300 to $499 | 85 (27.5%) | 0 (0.0%) |
| $500 to $799 | 85 (27.5%) | 24 (25.3%) |
| $800 to $999 | 51 (16.5%) | 30 (31.6%) |
| $1,000 to $1,499 | 62 (20.1%) | 34 (35.8%) |
| $1,500 to $1,999 | 0 (0.0%) | 5 (5.3%) |
| $2,000 to $2,499 | 0 (0.0%) | 0 (0.0%) |
| $2,500 to $2,999 | 0 (0.0%) | 0 (0.0%) |
| $3,000 or more | 0 (0.0%) | 0 (0.0%) |
| Total | 309 (100.0%) | 95 (100.0%) |
Physical Housing Characteristics in Silver Lake
Housing Structures in Silver Lake
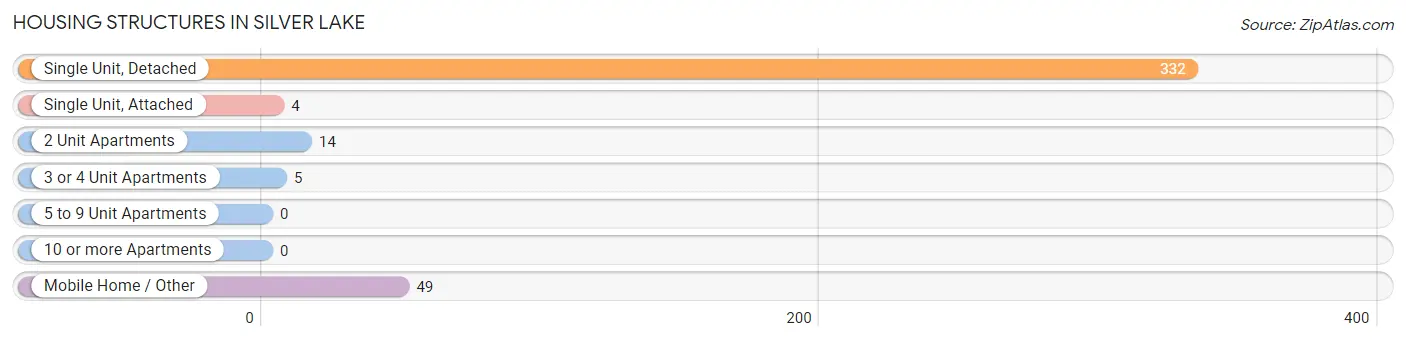
| Structure Type | # Housing Units | % Housing Units |
| Single Unit, Detached | 332 | 82.2% |
| Single Unit, Attached | 4 | 1.0% |
| 2 Unit Apartments | 14 | 3.5% |
| 3 or 4 Unit Apartments | 5 | 1.2% |
| 5 to 9 Unit Apartments | 0 | 0.0% |
| 10 or more Apartments | 0 | 0.0% |
| Mobile Home / Other | 49 | 12.1% |
| Total | 404 | 100.0% |
Housing Structures by Occupancy in Silver Lake
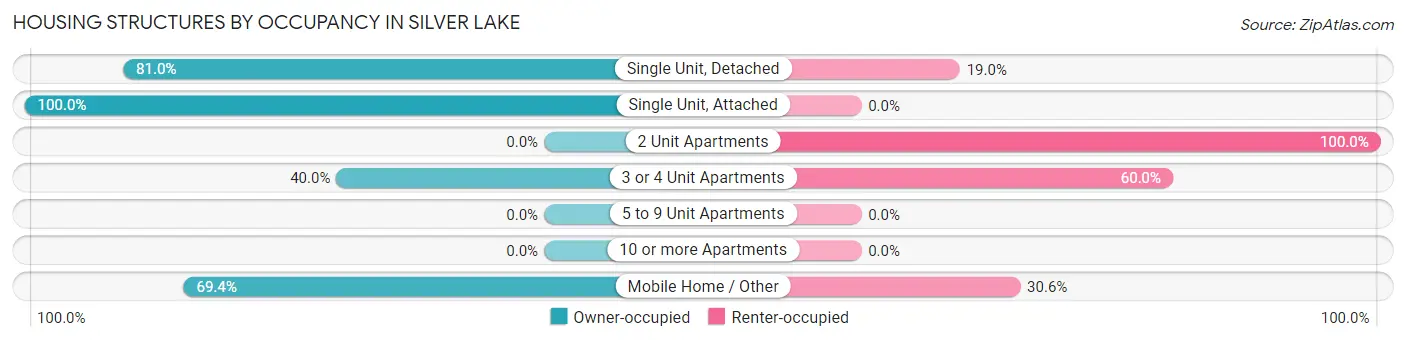
| Structure Type | Owner-occupied | Renter-occupied |
| Single Unit, Detached | 269 (81.0%) | 63 (19.0%) |
| Single Unit, Attached | 4 (100.0%) | 0 (0.0%) |
| 2 Unit Apartments | 0 (0.0%) | 14 (100.0%) |
| 3 or 4 Unit Apartments | 2 (40.0%) | 3 (60.0%) |
| 5 to 9 Unit Apartments | 0 (0.0%) | 0 (0.0%) |
| 10 or more Apartments | 0 (0.0%) | 0 (0.0%) |
| Mobile Home / Other | 34 (69.4%) | 15 (30.6%) |
| Total | 309 (76.5%) | 95 (23.5%) |
Housing Structures by Number of Rooms in Silver Lake
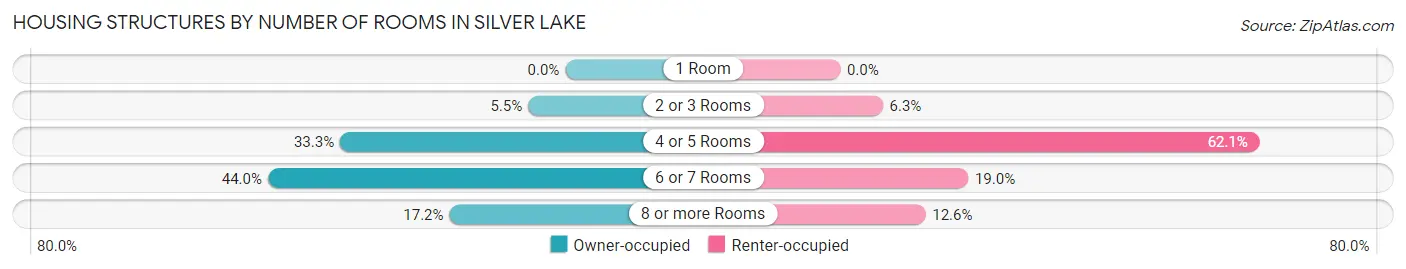
| Number of Rooms | Owner-occupied | Renter-occupied |
| 1 Room | 0 (0.0%) | 0 (0.0%) |
| 2 or 3 Rooms | 17 (5.5%) | 6 (6.3%) |
| 4 or 5 Rooms | 103 (33.3%) | 59 (62.1%) |
| 6 or 7 Rooms | 136 (44.0%) | 18 (19.0%) |
| 8 or more Rooms | 53 (17.2%) | 12 (12.6%) |
| Total | 309 (100.0%) | 95 (100.0%) |
Housing Structure by Heating Type in Silver Lake
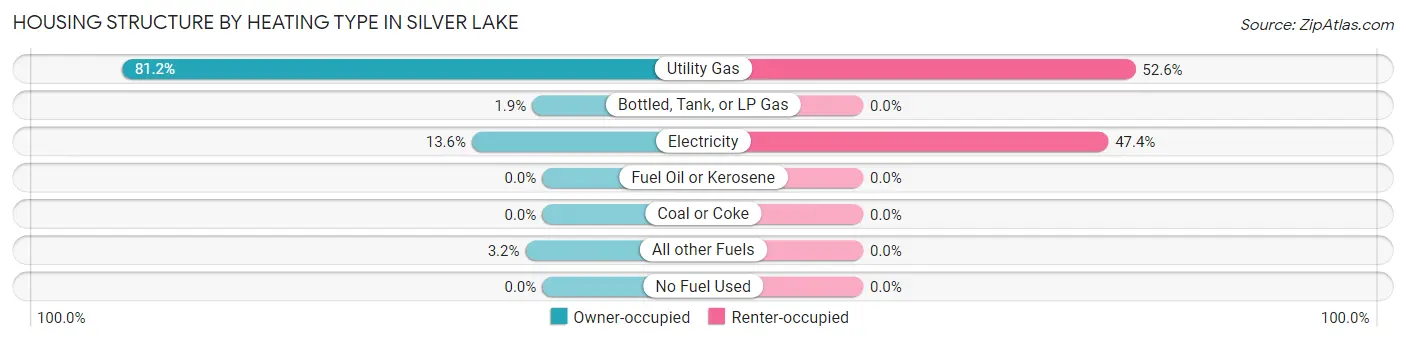
| Heating Type | Owner-occupied | Renter-occupied |
| Utility Gas | 251 (81.2%) | 50 (52.6%) |
| Bottled, Tank, or LP Gas | 6 (1.9%) | 0 (0.0%) |
| Electricity | 42 (13.6%) | 45 (47.4%) |
| Fuel Oil or Kerosene | 0 (0.0%) | 0 (0.0%) |
| Coal or Coke | 0 (0.0%) | 0 (0.0%) |
| All other Fuels | 10 (3.2%) | 0 (0.0%) |
| No Fuel Used | 0 (0.0%) | 0 (0.0%) |
| Total | 309 (100.0%) | 95 (100.0%) |
Household Vehicle Usage in Silver Lake
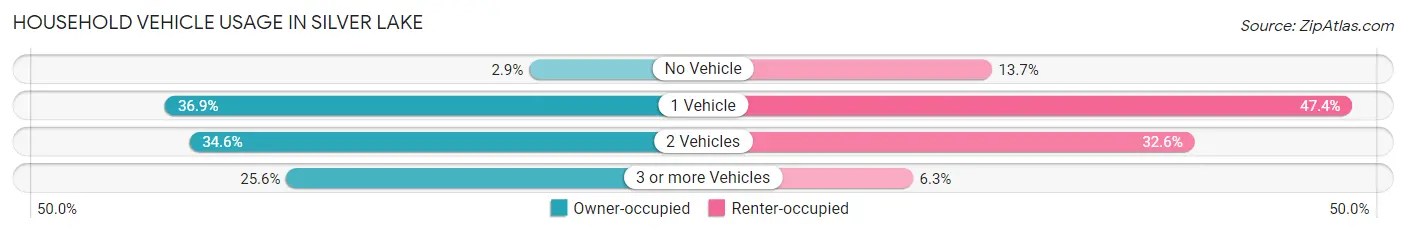
| Vehicles per Household | Owner-occupied | Renter-occupied |
| No Vehicle | 9 (2.9%) | 13 (13.7%) |
| 1 Vehicle | 114 (36.9%) | 45 (47.4%) |
| 2 Vehicles | 107 (34.6%) | 31 (32.6%) |
| 3 or more Vehicles | 79 (25.6%) | 6 (6.3%) |
| Total | 309 (100.0%) | 95 (100.0%) |
Real Estate & Mortgages in Silver Lake
Real Estate and Mortgage Overview in Silver Lake
| Characteristic | Without Mortgage | With Mortgage |
| Housing Units | 144 | 165 |
| Median Property Value | $102,100 | $104,400 |
| Median Household Income | $51,250 | $2 |
| Monthly Housing Costs | $421 | $0 |
| Real Estate Taxes | $708 | $3 |
Property Value by Mortgage Status in Silver Lake
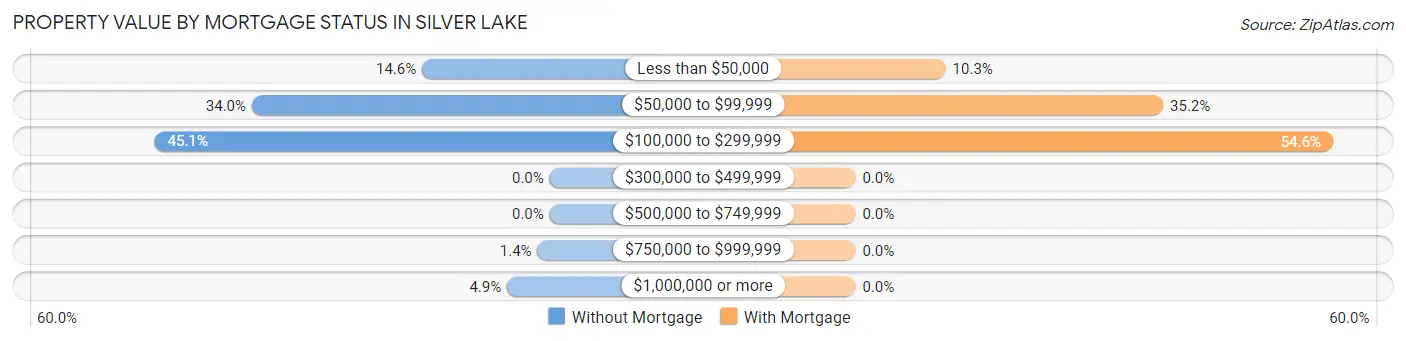
| Property Value | Without Mortgage | With Mortgage |
| Less than $50,000 | 21 (14.6%) | 17 (10.3%) |
| $50,000 to $99,999 | 49 (34.0%) | 58 (35.1%) |
| $100,000 to $299,999 | 65 (45.1%) | 90 (54.5%) |
| $300,000 to $499,999 | 0 (0.0%) | 0 (0.0%) |
| $500,000 to $749,999 | 0 (0.0%) | 0 (0.0%) |
| $750,000 to $999,999 | 2 (1.4%) | 0 (0.0%) |
| $1,000,000 or more | 7 (4.9%) | 0 (0.0%) |
| Total | 144 (100.0%) | 165 (100.0%) |
Household Income by Mortgage Status in Silver Lake
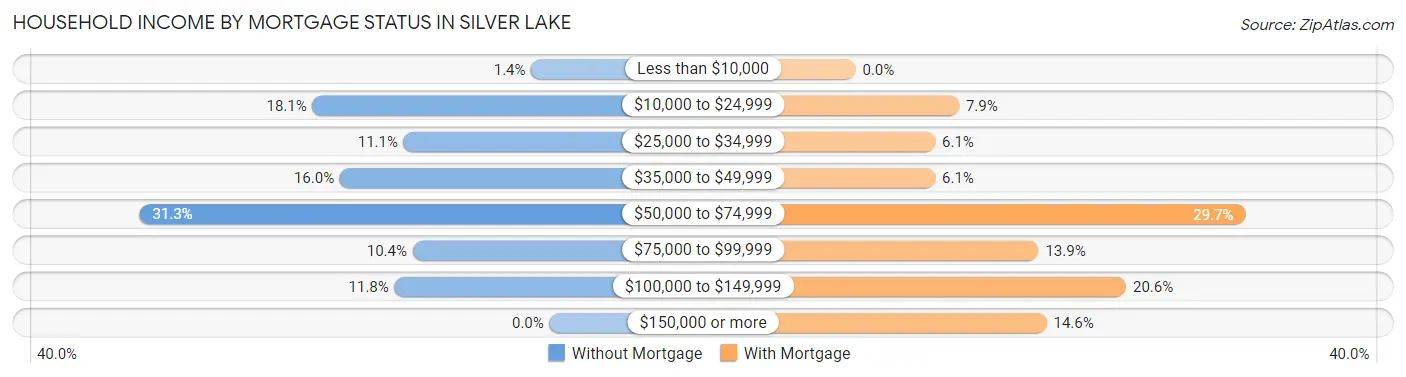
| Household Income | Without Mortgage | With Mortgage |
| Less than $10,000 | 2 (1.4%) | 0 (0.0%) |
| $10,000 to $24,999 | 26 (18.1%) | 13 (7.9%) |
| $25,000 to $34,999 | 16 (11.1%) | 10 (6.1%) |
| $35,000 to $49,999 | 23 (16.0%) | 10 (6.1%) |
| $50,000 to $74,999 | 45 (31.2%) | 49 (29.7%) |
| $75,000 to $99,999 | 15 (10.4%) | 23 (13.9%) |
| $100,000 to $149,999 | 17 (11.8%) | 34 (20.6%) |
| $150,000 or more | 0 (0.0%) | 24 (14.5%) |
| Total | 144 (100.0%) | 165 (100.0%) |
Property Value to Household Income Ratio in Silver Lake
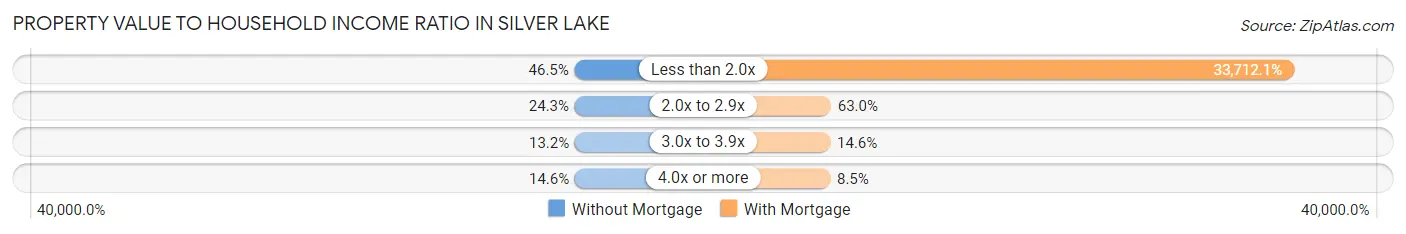
| Value-to-Income Ratio | Without Mortgage | With Mortgage |
| Less than 2.0x | 67 (46.5%) | 55,625 (33,712.1%) |
| 2.0x to 2.9x | 35 (24.3%) | 104 (63.0%) |
| 3.0x to 3.9x | 19 (13.2%) | 24 (14.5%) |
| 4.0x or more | 21 (14.6%) | 14 (8.5%) |
| Total | 144 (100.0%) | 165 (100.0%) |
Real Estate Taxes by Mortgage Status in Silver Lake
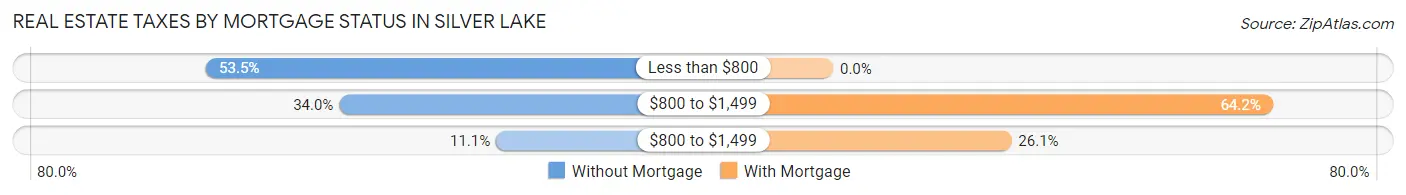
| Property Taxes | Without Mortgage | With Mortgage |
| Less than $800 | 77 (53.5%) | 0 (0.0%) |
| $800 to $1,499 | 49 (34.0%) | 106 (64.2%) |
| $800 to $1,499 | 16 (11.1%) | 43 (26.1%) |
| Total | 144 (100.0%) | 165 (100.0%) |
Health & Disability in Silver Lake
Health Insurance Coverage by Age in Silver Lake
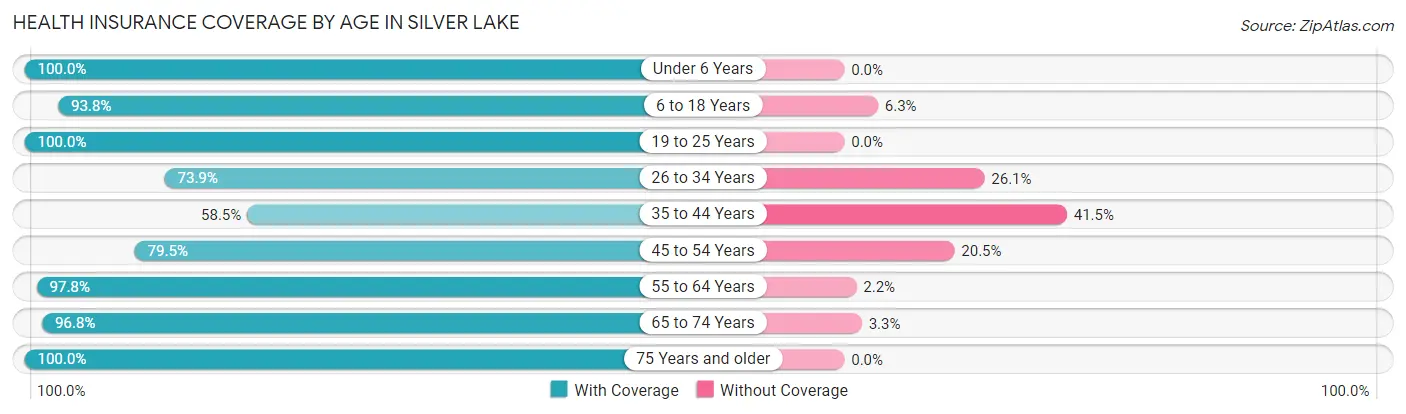
| Age Bracket | With Coverage | Without Coverage |
| Under 6 Years | 68 (100.0%) | 0 (0.0%) |
| 6 to 18 Years | 120 (93.8%) | 8 (6.2%) |
| 19 to 25 Years | 48 (100.0%) | 0 (0.0%) |
| 26 to 34 Years | 99 (73.9%) | 35 (26.1%) |
| 35 to 44 Years | 55 (58.5%) | 39 (41.5%) |
| 45 to 54 Years | 120 (79.5%) | 31 (20.5%) |
| 55 to 64 Years | 131 (97.8%) | 3 (2.2%) |
| 65 to 74 Years | 119 (96.8%) | 4 (3.3%) |
| 75 Years and older | 83 (100.0%) | 0 (0.0%) |
| Total | 843 (87.5%) | 120 (12.5%) |
Health Insurance Coverage by Citizenship Status in Silver Lake
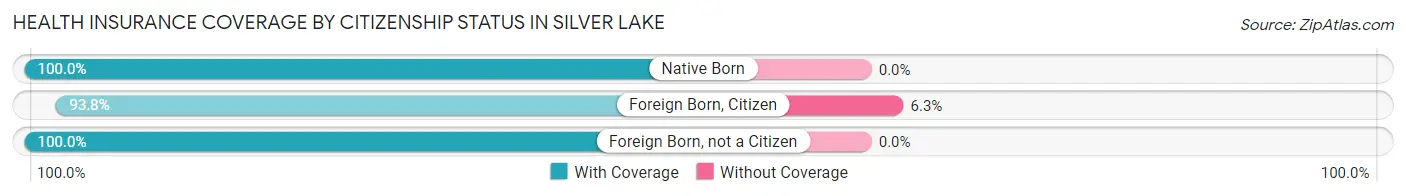
| Citizenship Status | With Coverage | Without Coverage |
| Native Born | 68 (100.0%) | 0 (0.0%) |
| Foreign Born, Citizen | 120 (93.8%) | 8 (6.2%) |
| Foreign Born, not a Citizen | 48 (100.0%) | 0 (0.0%) |
Health Insurance Coverage by Household Income in Silver Lake
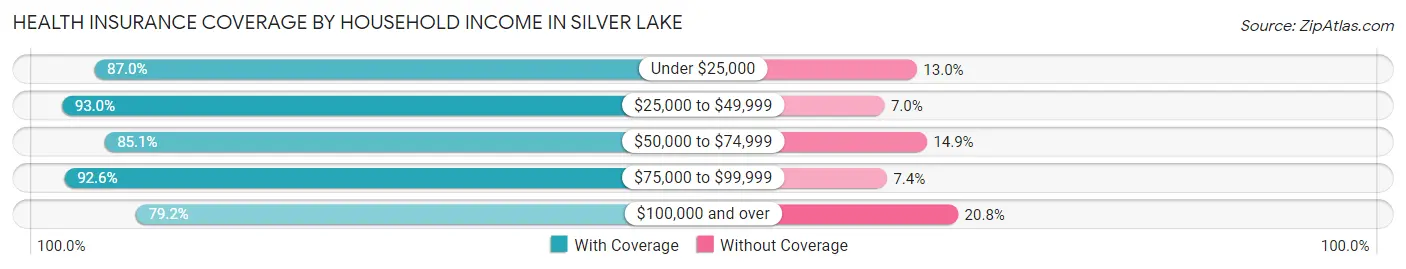
| Household Income | With Coverage | Without Coverage |
| Under $25,000 | 120 (87.0%) | 18 (13.0%) |
| $25,000 to $49,999 | 187 (93.0%) | 14 (7.0%) |
| $50,000 to $74,999 | 211 (85.1%) | 37 (14.9%) |
| $75,000 to $99,999 | 162 (92.6%) | 13 (7.4%) |
| $100,000 and over | 145 (79.2%) | 38 (20.8%) |
Public vs Private Health Insurance Coverage by Age in Silver Lake
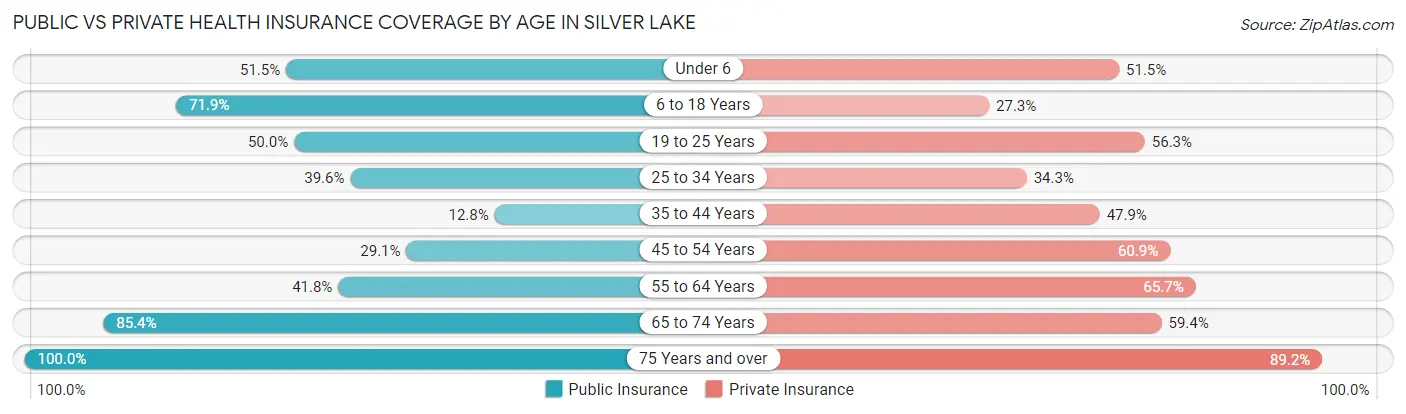
| Age Bracket | Public Insurance | Private Insurance |
| Under 6 | 35 (51.5%) | 35 (51.5%) |
| 6 to 18 Years | 92 (71.9%) | 35 (27.3%) |
| 19 to 25 Years | 24 (50.0%) | 27 (56.2%) |
| 25 to 34 Years | 53 (39.6%) | 46 (34.3%) |
| 35 to 44 Years | 12 (12.8%) | 45 (47.9%) |
| 45 to 54 Years | 44 (29.1%) | 92 (60.9%) |
| 55 to 64 Years | 56 (41.8%) | 88 (65.7%) |
| 65 to 74 Years | 105 (85.4%) | 73 (59.4%) |
| 75 Years and over | 83 (100.0%) | 74 (89.2%) |
| Total | 504 (52.3%) | 515 (53.5%) |
Disability Status by Sex by Age in Silver Lake
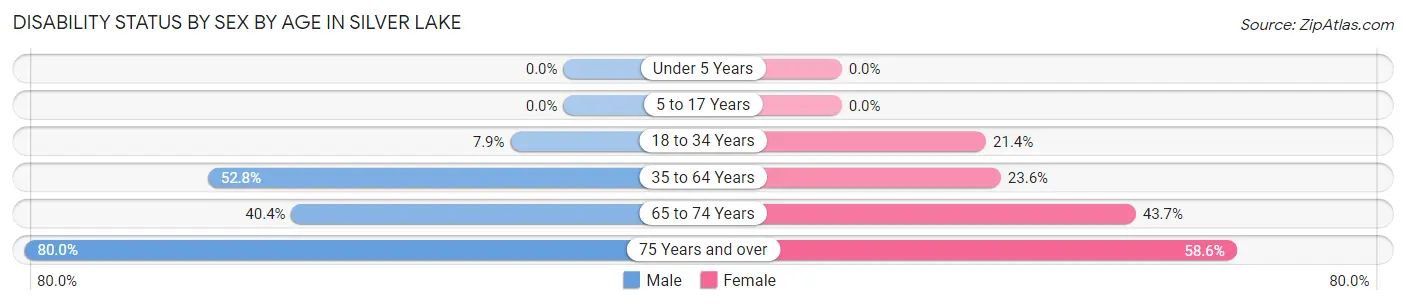
| Age Bracket | Male | Female |
| Under 5 Years | 0 (0.0%) | 0 (0.0%) |
| 5 to 17 Years | 0 (0.0%) | 0 (0.0%) |
| 18 to 34 Years | 7 (7.9%) | 21 (21.4%) |
| 35 to 64 Years | 104 (52.8%) | 43 (23.6%) |
| 65 to 74 Years | 21 (40.4%) | 31 (43.7%) |
| 75 Years and over | 20 (80.0%) | 34 (58.6%) |
Disability Class by Sex by Age in Silver Lake
Disability Class: Hearing Difficulty

| Age Bracket | Male | Female |
| Under 5 Years | 0 (0.0%) | 0 (0.0%) |
| 5 to 17 Years | 0 (0.0%) | 0 (0.0%) |
| 18 to 34 Years | 0 (0.0%) | 15 (15.3%) |
| 35 to 64 Years | 18 (9.1%) | 5 (2.8%) |
| 65 to 74 Years | 16 (30.8%) | 3 (4.2%) |
| 75 Years and over | 20 (80.0%) | 26 (44.8%) |
Disability Class: Vision Difficulty
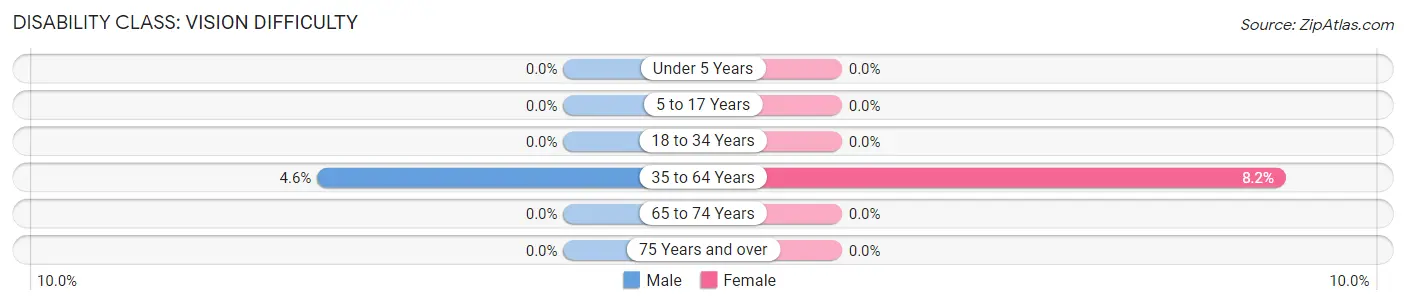
| Age Bracket | Male | Female |
| Under 5 Years | 0 (0.0%) | 0 (0.0%) |
| 5 to 17 Years | 0 (0.0%) | 0 (0.0%) |
| 18 to 34 Years | 0 (0.0%) | 0 (0.0%) |
| 35 to 64 Years | 9 (4.6%) | 15 (8.2%) |
| 65 to 74 Years | 0 (0.0%) | 0 (0.0%) |
| 75 Years and over | 0 (0.0%) | 0 (0.0%) |
Disability Class: Cognitive Difficulty
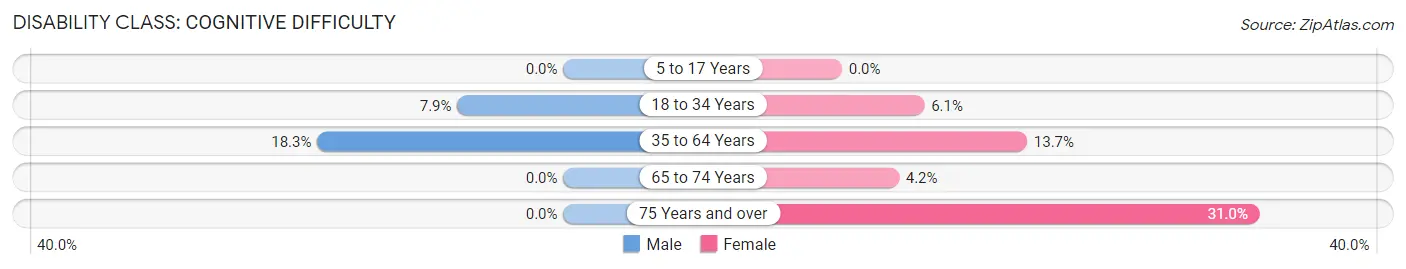
| Age Bracket | Male | Female |
| 5 to 17 Years | 0 (0.0%) | 0 (0.0%) |
| 18 to 34 Years | 7 (7.9%) | 6 (6.1%) |
| 35 to 64 Years | 36 (18.3%) | 25 (13.7%) |
| 65 to 74 Years | 0 (0.0%) | 3 (4.2%) |
| 75 Years and over | 0 (0.0%) | 18 (31.0%) |
Disability Class: Ambulatory Difficulty
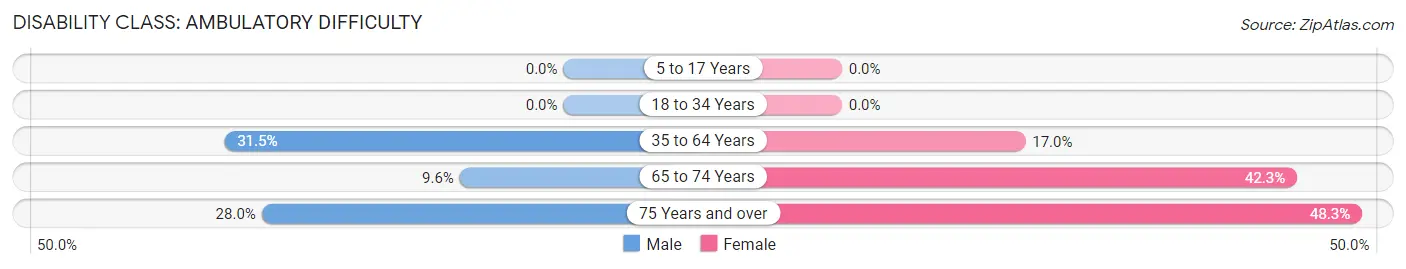
| Age Bracket | Male | Female |
| 5 to 17 Years | 0 (0.0%) | 0 (0.0%) |
| 18 to 34 Years | 0 (0.0%) | 0 (0.0%) |
| 35 to 64 Years | 62 (31.5%) | 31 (17.0%) |
| 65 to 74 Years | 5 (9.6%) | 30 (42.2%) |
| 75 Years and over | 7 (28.0%) | 28 (48.3%) |
Disability Class: Self-Care Difficulty

| Age Bracket | Male | Female |
| 5 to 17 Years | 0 (0.0%) | 0 (0.0%) |
| 18 to 34 Years | 0 (0.0%) | 0 (0.0%) |
| 35 to 64 Years | 6 (3.0%) | 10 (5.5%) |
| 65 to 74 Years | 7 (13.5%) | 4 (5.6%) |
| 75 Years and over | 7 (28.0%) | 24 (41.4%) |
Technology Access in Silver Lake
Computing Device Access in Silver Lake
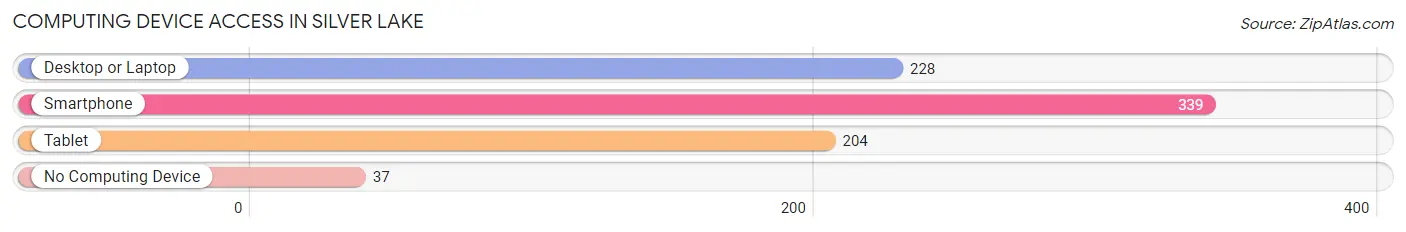
| Device Type | # Households | % Households |
| Desktop or Laptop | 228 | 56.4% |
| Smartphone | 339 | 83.9% |
| Tablet | 204 | 50.5% |
| No Computing Device | 37 | 9.2% |
| Total | 404 | 100.0% |
Internet Access in Silver Lake
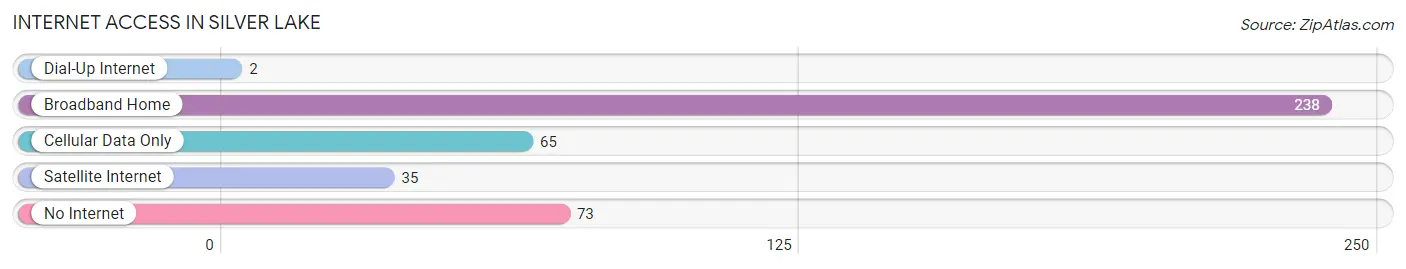
| Internet Type | # Households | % Households |
| Dial-Up Internet | 2 | 0.5% |
| Broadband Home | 238 | 58.9% |
| Cellular Data Only | 65 | 16.1% |
| Satellite Internet | 35 | 8.7% |
| No Internet | 73 | 18.1% |
| Total | 404 | 100.0% |
Silver Lake Summary
Introduction
Silver Lake is a small town located in Kosciusko County, Indiana. It is situated in the northern part of the state, about 20 miles south of the Michigan border. The town has a population of about 1,500 people and is known for its rural charm and small-town atmosphere. The town is home to a variety of businesses, including a grocery store, a hardware store, a bank, and a few restaurants. The town is also home to a number of churches, including the Silver Lake United Methodist Church, the Silver Lake Baptist Church, and the Silver Lake Presbyterian Church.
History
Silver Lake was founded in 1837 by a group of settlers from Ohio. The town was originally known as “Silver Creek”, but the name was changed to Silver Lake in 1845. The town was incorporated in 1851 and was named after the nearby lake.
The town grew slowly over the years, but it was not until the late 19th century that it began to experience significant growth. In 1887, the Silver Lake Railroad was built, connecting the town to nearby Warsaw and providing a link to the outside world. This allowed the town to become a center of commerce and industry.
In the early 20th century, Silver Lake experienced a period of rapid growth. The town was home to a variety of businesses, including a flour mill, a sawmill, a furniture factory, and a canning factory. The town also had a number of churches, schools, and other civic organizations.
Geography
Silver Lake is located in the northern part of Kosciusko County, Indiana. The town is situated on the banks of Silver Lake, a small lake that is part of the Tippecanoe River watershed. The town is surrounded by farmland and is located about 20 miles south of the Michigan border.
The town has a total area of 1.2 square miles, all of which is land. The town is located at an elevation of 845 feet above sea level.
Economy
Silver Lake’s economy is largely based on agriculture and tourism. The town is home to a variety of businesses, including a grocery store, a hardware store, a bank, and a few restaurants. The town is also home to a number of churches, schools, and other civic organizations.
The town is also home to a number of small manufacturing businesses, including a furniture factory and a canning factory. The town is also home to a number of farms, which produce a variety of crops, including corn, soybeans, and wheat.
Demographics
As of the 2010 census, Silver Lake had a population of 1,500 people. The town has a median household income of $41,250 and a median family income of $50,000. The town has a poverty rate of 11.7%, which is slightly higher than the national average.
The town is predominantly white, with 92.7% of the population identifying as white. The town also has a small Hispanic population, with 4.7% of the population identifying as Hispanic or Latino.
Conclusion
Silver Lake is a small town located in Kosciusko County, Indiana. The town has a population of about 1,500 people and is known for its rural charm and small-town atmosphere. The town is home to a variety of businesses, including a grocery store, a hardware store, a bank, and a few restaurants. The town is also home to a number of churches, schools, and other civic organizations. The town’s economy is largely based on agriculture and tourism. The town is predominantly white, with 92.7% of the population identifying as white. The town also has a small Hispanic population, with 4.7% of the population identifying as Hispanic or Latino.
Common Questions
What is Per Capita Income in Silver Lake?
Per Capita income in Silver Lake is $25,324.
What is the Median Family Income in Silver Lake?
Median Family Income in Silver Lake is $53,542.
What is the Median Household income in Silver Lake?
Median Household Income in Silver Lake is $48,971.
What is Income or Wage Gap in Silver Lake?
Income or Wage Gap in Silver Lake is 31.6%.
Women in Silver Lake earn 68.4 cents for every dollar earned by a man.
What is Inequality or Gini Index in Silver Lake?
Inequality or Gini Index in Silver Lake is 0.36.
What is the Total Population of Silver Lake?
Total Population of Silver Lake is 963.
What is the Total Male Population of Silver Lake?
Total Male Population of Silver Lake is 466.
What is the Total Female Population of Silver Lake?
Total Female Population of Silver Lake is 497.
What is the Ratio of Males per 100 Females in Silver Lake?
There are 93.76 Males per 100 Females in Silver Lake.
What is the Ratio of Females per 100 Males in Silver Lake?
There are 106.65 Females per 100 Males in Silver Lake.
What is the Median Population Age in Silver Lake?
Median Population Age in Silver Lake is 45.7 Years.
What is the Average Family Size in Silver Lake
Average Family Size in Silver Lake is 2.7 People.
What is the Average Household Size in Silver Lake
Average Household Size in Silver Lake is 2.3 People.
How Large is the Labor Force in Silver Lake?
There are 440 People in the Labor Forcein in Silver Lake.
What is the Percentage of People in the Labor Force in Silver Lake?
55.8% of People are in the Labor Force in Silver Lake.
What is the Unemployment Rate in Silver Lake?
Unemployment Rate in Silver Lake is 7.7%.