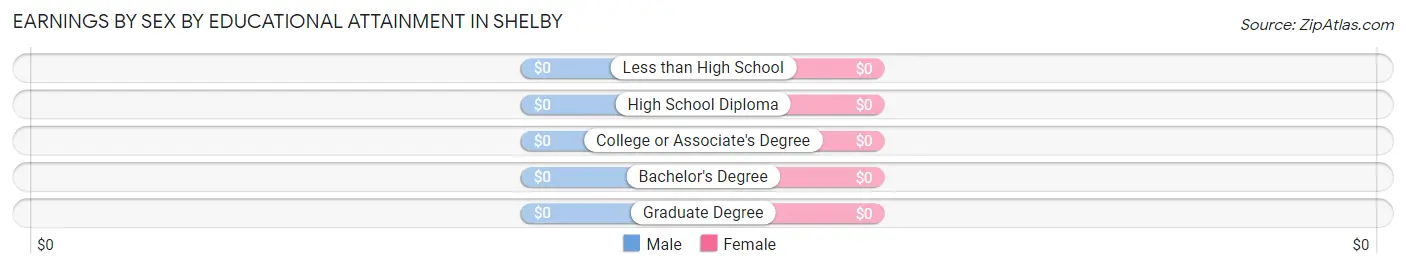
Earnings by Sex by Educational Attainment in Shelby
Educational Attainment
Male Income
Female Income
Less than High School
-
-
High School Diploma
-
-
College or Associate's Degree
-
-
Bachelor's Degree
-
-
Graduate Degree
-
-
Total
-
-
Family Income in Shelby
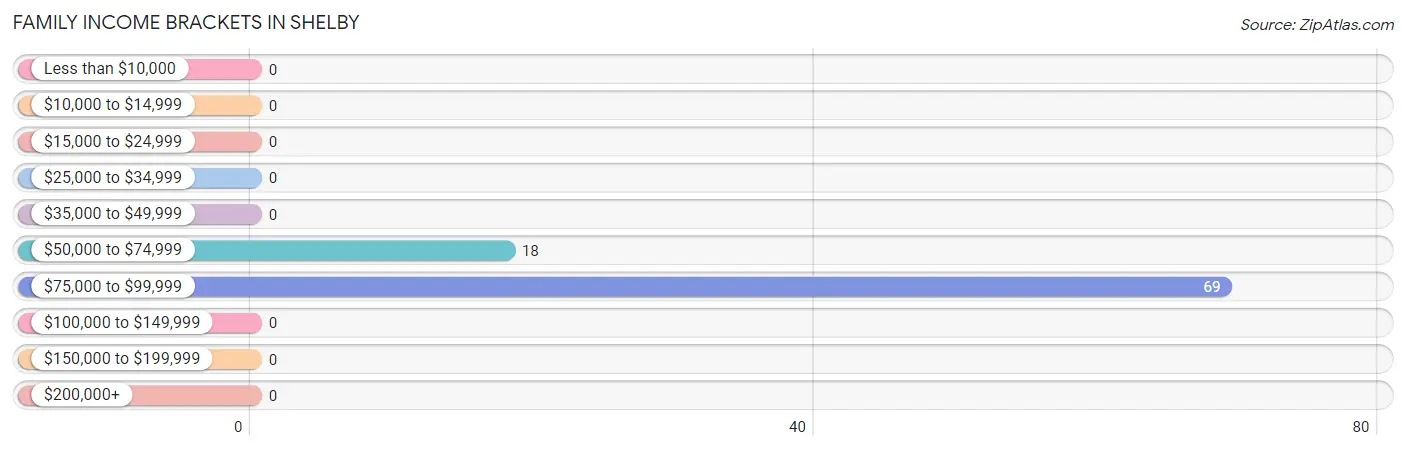
Family Income Brackets in Shelby
According to the Shelby family income data, there are 69 families falling into the $75,000 to $99,999 income range, which is the most common income bracket and makes up 79.3% of all families.
Income Bracket
# Families
% Families
Less than $10,000
0
0.0%
$10,000 to $14,999
0
0.0%
$15,000 to $24,999
0
0.0%
$25,000 to $34,999
0
0.0%
$35,000 to $49,999
0
0.0%
$50,000 to $74,999
18
20.7%
$75,000 to $99,999
69
79.3%
$100,000 to $149,999
0
0.0%
$150,000 to $199,999
0
0.0%
$200,000+
0
0.0%
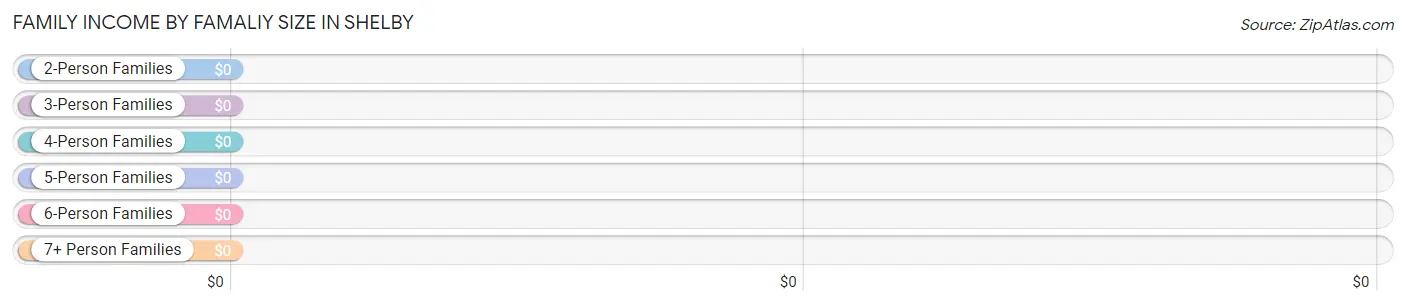
Family Income by Famaliy Size in Shelby
Income Bracket
# Families
Median Income
2-Person Families
71 (81.6%)
$0
3-Person Families
16 (18.4%)
$0
4-Person Families
0 (0.0%)
$0
5-Person Families
0 (0.0%)
$0
6-Person Families
0 (0.0%)
$0
7+ Person Families
0 (0.0%)
$0
Total
87 (100.0%)
$78,703
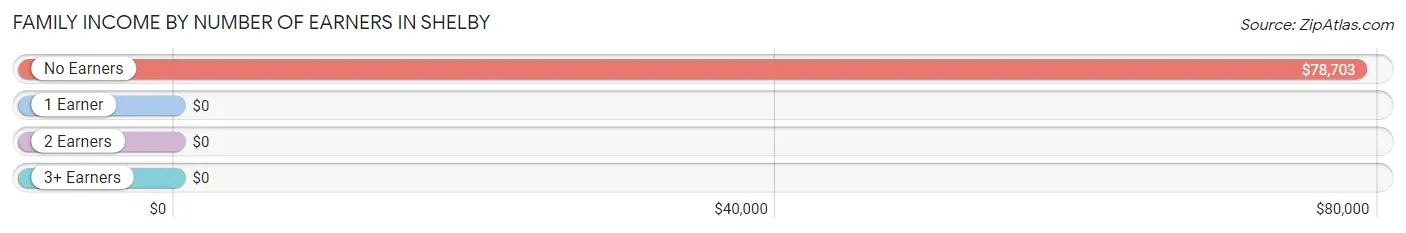
Family Income by Number of Earners in Shelby
Number of Earners
# Families
Median Income
No Earners
87 (100.0%)
$78,703
1 Earner
0 (0.0%)
$0
2 Earners
0 (0.0%)
$0
3+ Earners
0 (0.0%)
$0
Total
87 (100.0%)
$78,703
Household Income in Shelby
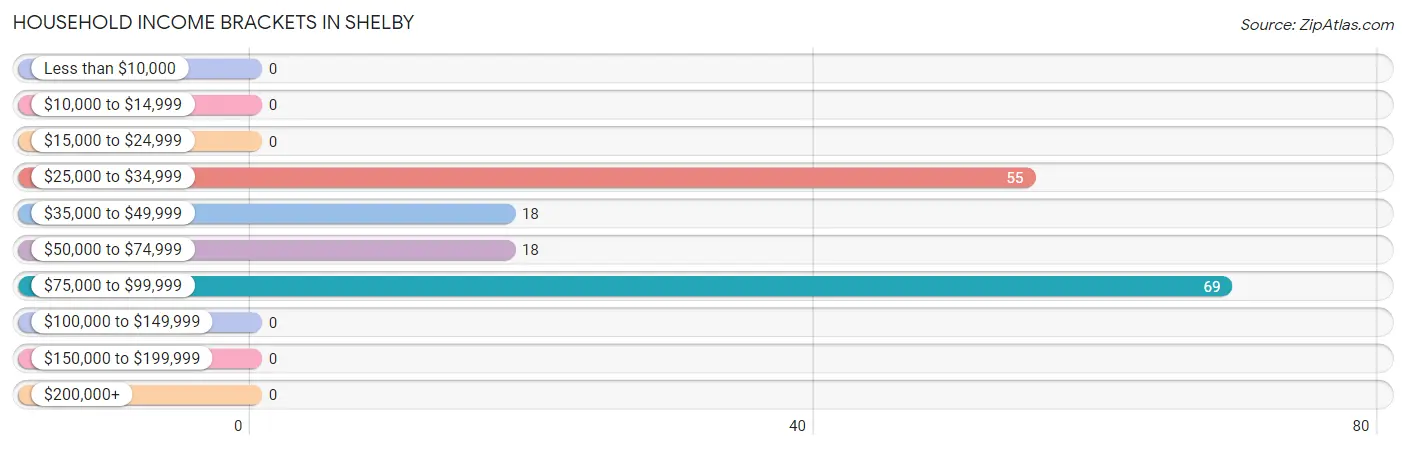
Household Income Brackets in Shelby
With 69 households falling in the category, the $75,000 to $99,999 income range is the most frequent in Shelby, accounting for 43.1% of all households.
Income Bracket
# Households
% Households
Less than $10,000
0
0.0%
$10,000 to $14,999
0
0.0%
$15,000 to $24,999
0
0.0%
$25,000 to $34,999
55
34.4%
$35,000 to $49,999
18
11.3%
$50,000 to $74,999
18
11.3%
$75,000 to $99,999
69
43.1%
$100,000 to $149,999
0
0.0%
$150,000 to $199,999
0
0.0%
$200,000+
0
0.0%
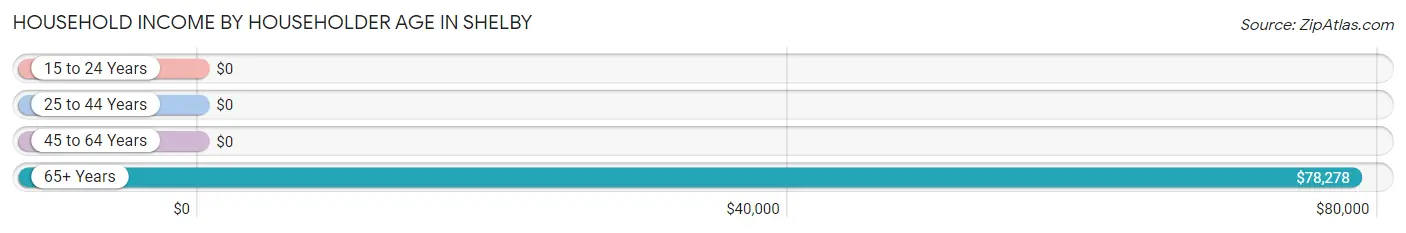
Household Income by Householder Age in Shelby
The median household income in Shelby is $0, with the highest median household income of $78,278 found in the 65+ years age bracket for the primary householder. A total of 105 households (65.6%) fall into this category.
Income Bracket
# Households
Median Income
15 to 24 Years
0 (0.0%)
$0
25 to 44 Years
0 (0.0%)
$0
45 to 64 Years
55 (34.4%)
$0
65+ Years
105 (65.6%)
$78,278
Total
160 (100.0%)
$0
Poverty in Shelby
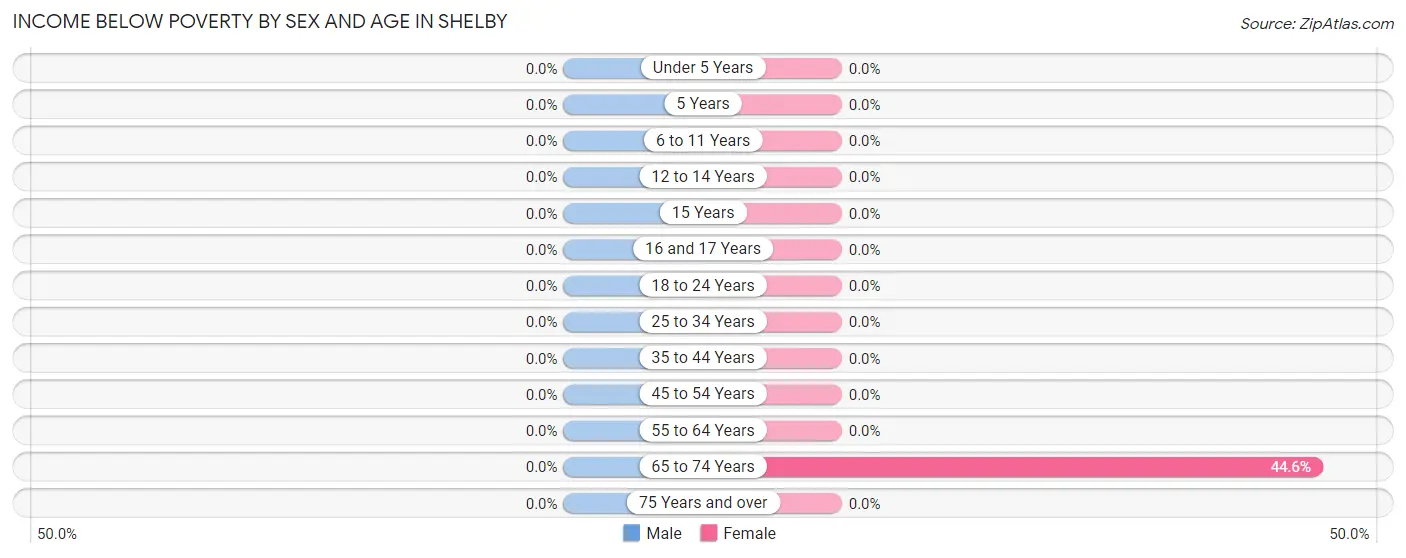
Income Below Poverty by Sex and Age in Shelby
Age Bracket
Male
Female
Under 5 Years
0 (0.0%)
0 (0.0%)
5 Years
0 (0.0%)
0 (0.0%)
6 to 11 Years
0 (0.0%)
0 (0.0%)
12 to 14 Years
0 (0.0%)
0 (0.0%)
15 Years
0 (0.0%)
0 (0.0%)
16 and 17 Years
0 (0.0%)
0 (0.0%)
18 to 24 Years
0 (0.0%)
0 (0.0%)
25 to 34 Years
0 (0.0%)
0 (0.0%)
35 to 44 Years
0 (0.0%)
0 (0.0%)
45 to 54 Years
0 (0.0%)
0 (0.0%)
55 to 64 Years
0 (0.0%)
0 (0.0%)
65 to 74 Years
0 (0.0%)
50 (44.6%)
75 Years and over
0 (0.0%)
0 (0.0%)
Total
0 (0.0%)
50 (38.5%)
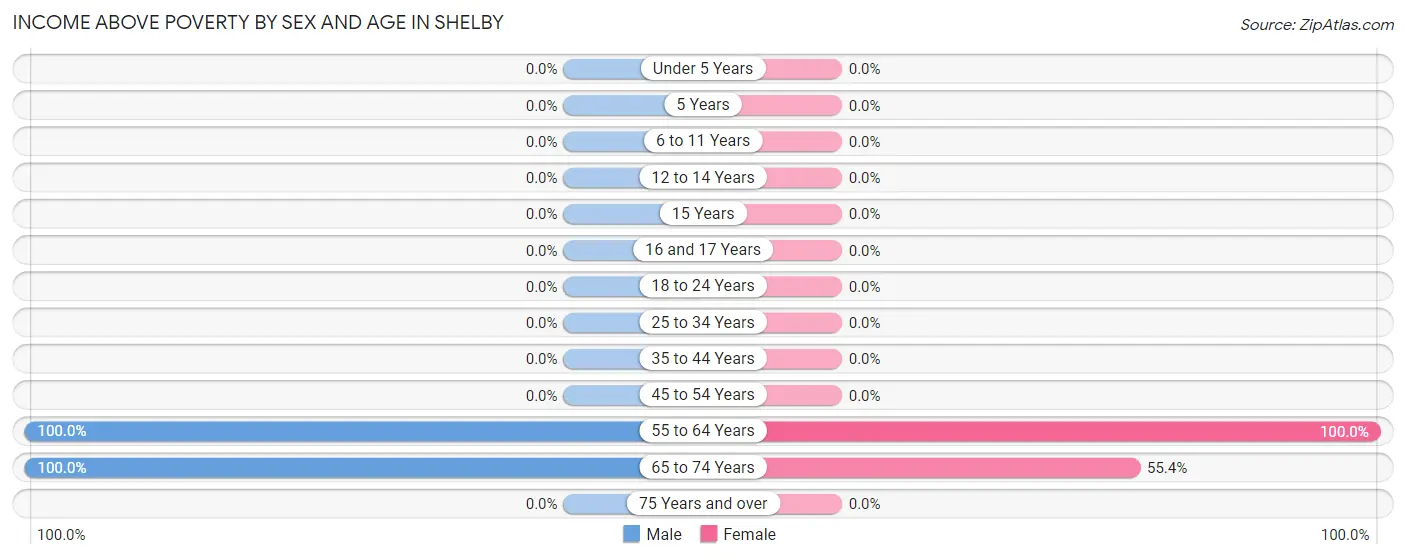
Income Above Poverty by Sex and Age in Shelby
According to the poverty statistics in Shelby, males aged 55 to 64 years and females aged 55 to 64 years are the age groups that are most secure financially, with 100.0% of males and 100.0% of females in these age groups living above the poverty line.
Age Bracket
Male
Female
Under 5 Years
0 (0.0%)
0 (0.0%)
5 Years
0 (0.0%)
0 (0.0%)
6 to 11 Years
0 (0.0%)
0 (0.0%)
12 to 14 Years
0 (0.0%)
0 (0.0%)
15 Years
0 (0.0%)
0 (0.0%)
16 and 17 Years
0 (0.0%)
0 (0.0%)
18 to 24 Years
0 (0.0%)
0 (0.0%)
25 to 34 Years
0 (0.0%)
0 (0.0%)
35 to 44 Years
0 (0.0%)
0 (0.0%)
45 to 54 Years
0 (0.0%)
0 (0.0%)
55 to 64 Years
55 (100.0%)
18 (100.0%)
65 to 74 Years
123 (100.0%)
62 (55.4%)
75 Years and over
0 (0.0%)
0 (0.0%)
Total
178 (100.0%)
80 (61.5%)
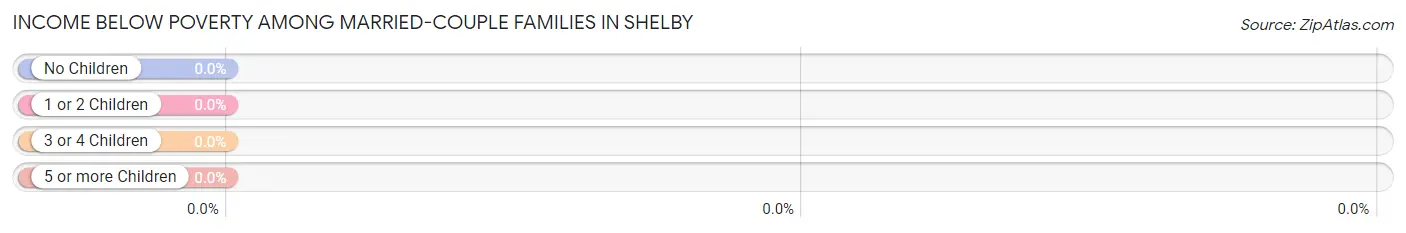
Income Below Poverty Among Married-Couple Families in Shelby
Children
Above Poverty
Below Poverty
No Children
87 (100.0%)
0 (0.0%)
1 or 2 Children
0 (0.0%)
0 (0.0%)
3 or 4 Children
0 (0.0%)
0 (0.0%)
5 or more Children
0 (0.0%)
0 (0.0%)
Total
87 (100.0%)
0 (0.0%)
Income Below Poverty Among Single-Parent Households in Shelby
Children
Single Father
Single Mother
No Children
0 (0.0%)
0 (0.0%)
1 or 2 Children
0 (0.0%)
0 (0.0%)
3 or 4 Children
0 (0.0%)
0 (0.0%)
5 or more Children
0 (0.0%)
0 (0.0%)
Total
0 (0.0%)
0 (0.0%)
Income Below Poverty Among Married-Couple vs Single-Parent Households in Shelby
Children
Married-Couple Families
Single-Parent Households
No Children
0 (0.0%)
0 (0.0%)
1 or 2 Children
0 (0.0%)
0 (0.0%)
3 or 4 Children
0 (0.0%)
0 (0.0%)
5 or more Children
0 (0.0%)
0 (0.0%)
Total
0 (0.0%)
0 (0.0%)
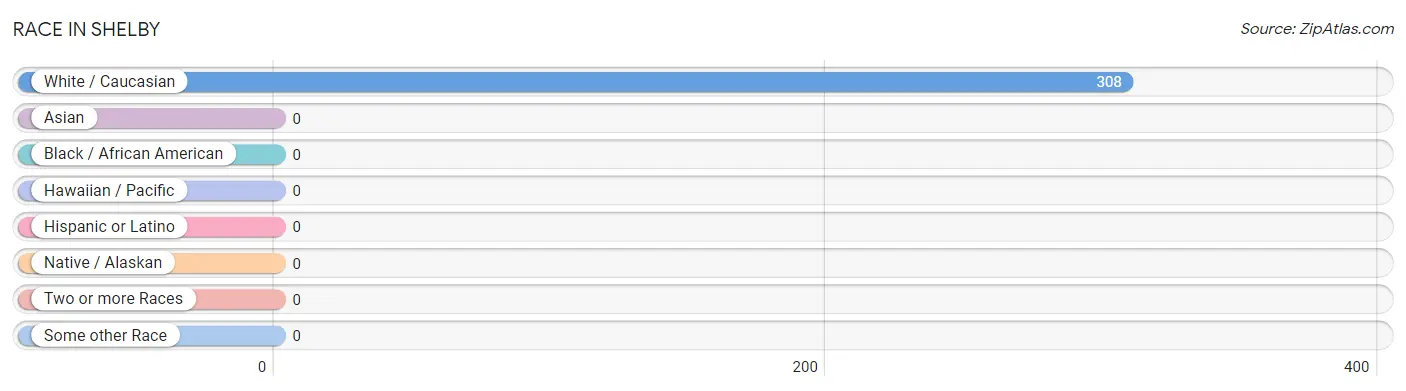
Race in Shelby
The most populous races in Shelby are , and White / Caucasian (308 | 100.0%).
Race
# Population
% Population
Asian
0
0.0%
Black / African American
0
0.0%
Hawaiian / Pacific
0
0.0%
Hispanic or Latino
0
0.0%
Native / Alaskan
0
0.0%
White / Caucasian
308
100.0%
Two or more Races
0
0.0%
Some other Race
0
0.0%
Total
308
100.0%
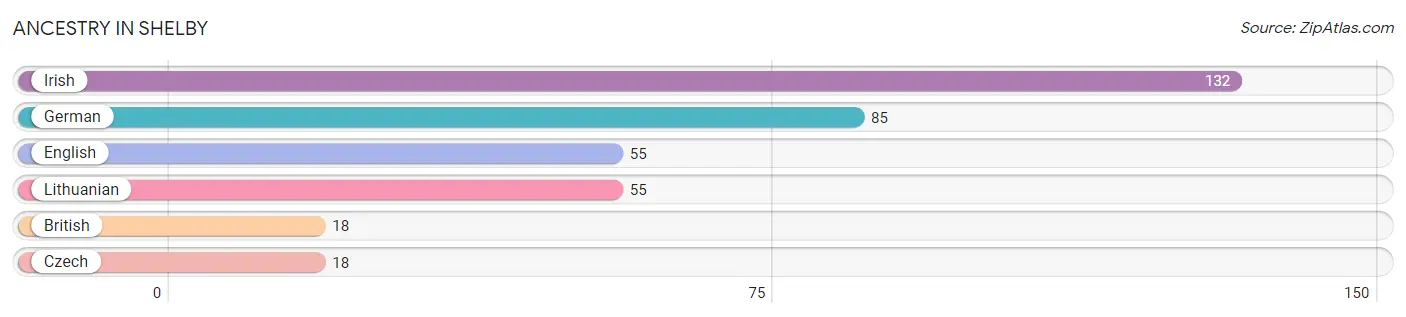
Ancestry in Shelby
The most populous ancestries reported in Shelby are Irish (132 | 42.9%), German (85 | 27.6%), English (55 | 17.9%), Lithuanian (55 | 17.9%), and British (18 | 5.8%), together accounting for 112.0% of all Shelby residents.
Ancestry
# Population
% Population
British
18
5.8%
Czech
18
5.8%
English
55
17.9%
German
85
27.6%
Irish
132
42.9%
Lithuanian
55
17.9%
View All 6 Rows
Immigrants in Shelby
Immigration Origin
# Population
% Population
View All 0 Rows
Sex and Age in Shelby
Sex and Age in Shelby
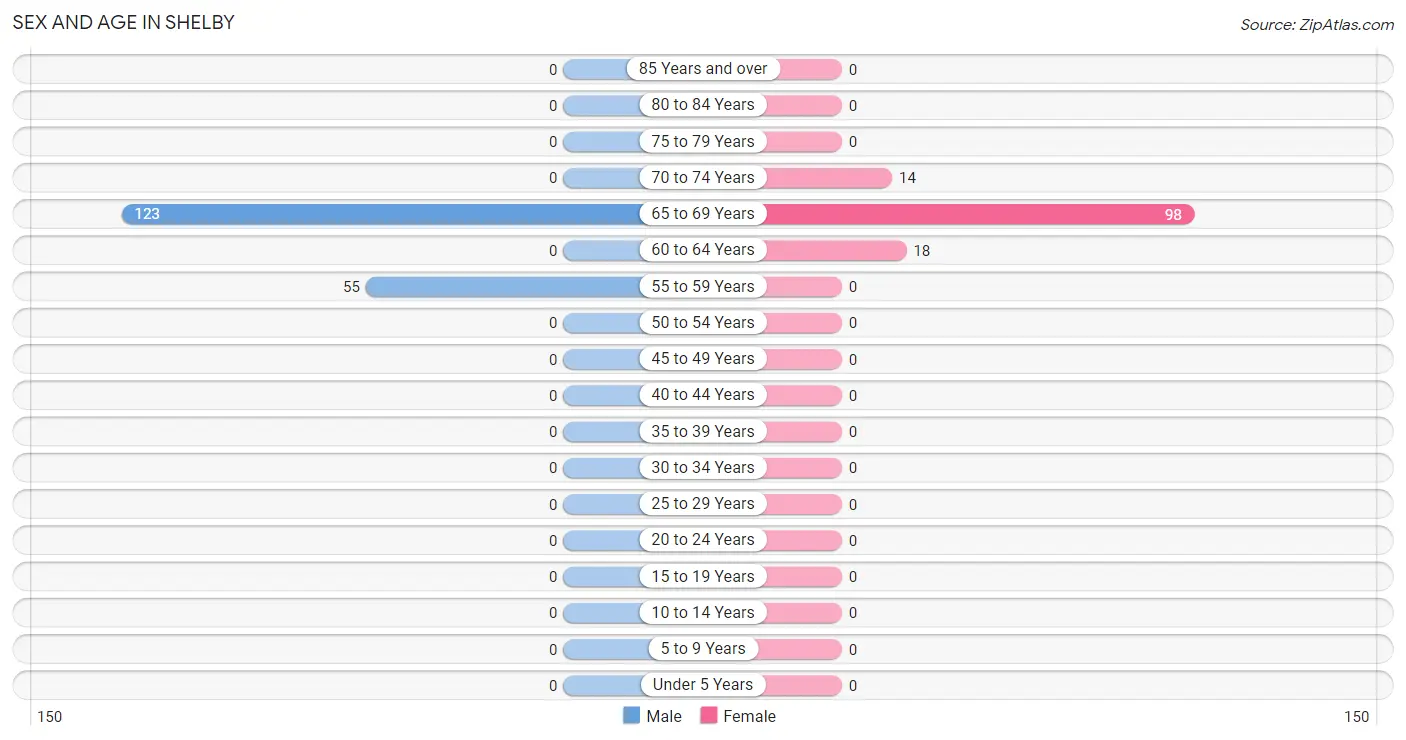
The most populous age groups in Shelby are 65 to 69 Years (123 | 69.1%) for men and 65 to 69 Years (98 | 75.4%) for women.
Age Bracket
Male
Female
Under 5 Years
0 (0.0%)
0 (0.0%)
5 to 9 Years
0 (0.0%)
0 (0.0%)
10 to 14 Years
0 (0.0%)
0 (0.0%)
15 to 19 Years
0 (0.0%)
0 (0.0%)
20 to 24 Years
0 (0.0%)
0 (0.0%)
25 to 29 Years
0 (0.0%)
0 (0.0%)
30 to 34 Years
0 (0.0%)
0 (0.0%)
35 to 39 Years
0 (0.0%)
0 (0.0%)
40 to 44 Years
0 (0.0%)
0 (0.0%)
45 to 49 Years
0 (0.0%)
0 (0.0%)
50 to 54 Years
0 (0.0%)
0 (0.0%)
55 to 59 Years
55 (30.9%)
0 (0.0%)
60 to 64 Years
0 (0.0%)
18 (13.9%)
65 to 69 Years
123 (69.1%)
98 (75.4%)
70 to 74 Years
0 (0.0%)
14 (10.8%)
75 to 79 Years
0 (0.0%)
0 (0.0%)
80 to 84 Years
0 (0.0%)
0 (0.0%)
85 Years and over
0 (0.0%)
0 (0.0%)
Total
178 (100.0%)
130 (100.0%)
Families and Households in Shelby
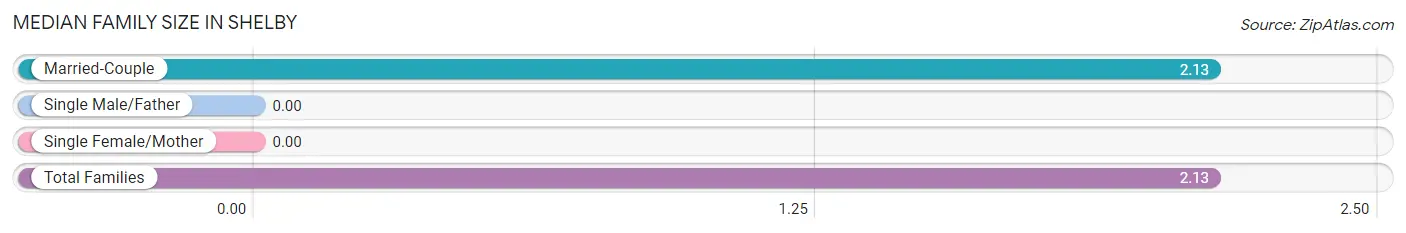
Median Family Size in Shelby
Family Type
# Families
Family Size
Married-Couple
87 (100.0%)
2.13
Single Male/Father
0 (0.0%)
-
Single Female/Mother
0 (0.0%)
-
Total Families
87 (100.0%)
2.13
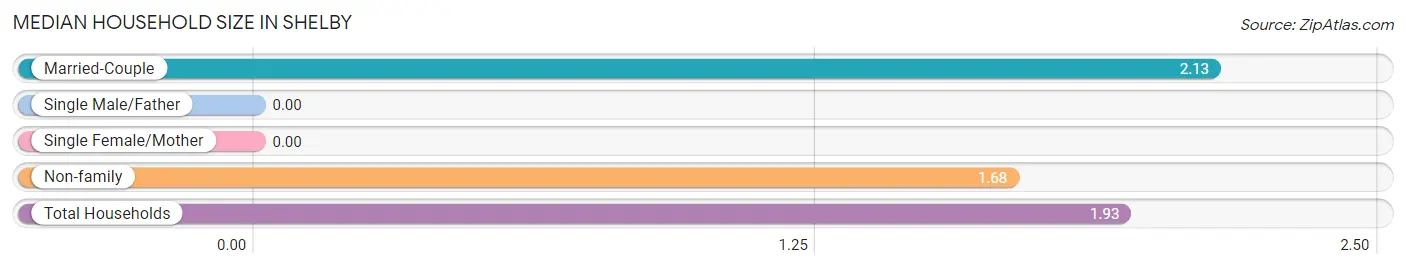
Median Household Size in Shelby
Household Type
# Households
Household Size
Married-Couple
87 (54.4%)
2.13
Single Male/Father
0 (0.0%)
-
Single Female/Mother
0 (0.0%)
-
Non-family
73 (45.6%)
1.68
Total Households
160 (100.0%)
1.93
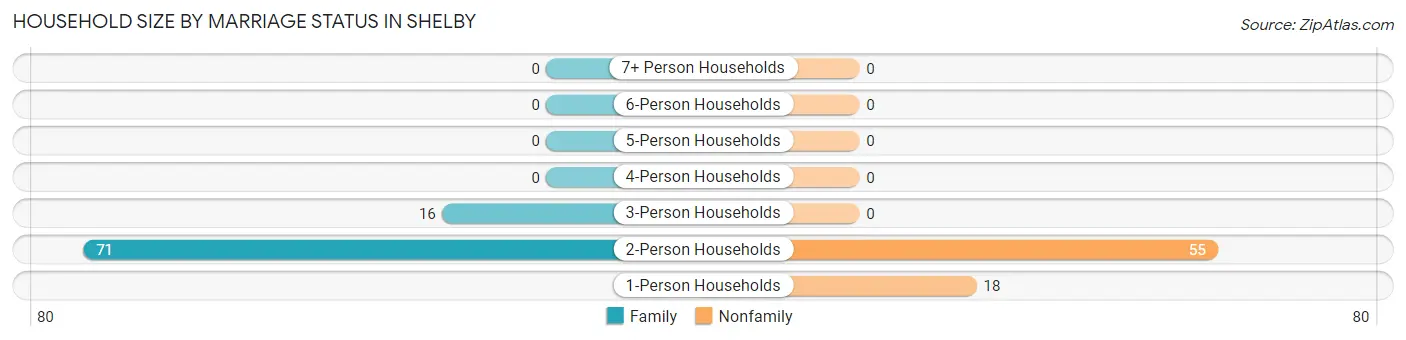
Household Size by Marriage Status in Shelby
Out of a total of 160 households in Shelby, 87 (54.4%) are family households, while 73 (45.6%) are nonfamily households. The most numerous type of family households are 2-person households, comprising 71, and the most common type of nonfamily households are 2-person households, comprising 55.
Household Size
Family Households
Nonfamily Households
1-Person Households
-
18 (11.3%)
2-Person Households
71 (44.4%)
55 (34.4%)
3-Person Households
16 (10.0%)
0 (0.0%)
4-Person Households
0 (0.0%)
0 (0.0%)
5-Person Households
0 (0.0%)
0 (0.0%)
6-Person Households
0 (0.0%)
0 (0.0%)
7+ Person Households
0 (0.0%)
0 (0.0%)
Total
87 (54.4%)
73 (45.6%)
Female Fertility in Shelby
Fertility by Age in Shelby
Age Bracket
Women with Births
Births / 1,000 Women
15 to 19 years
0 (0.0%)
0.0
20 to 34 years
0 (0.0%)
0.0
35 to 50 years
0 (0.0%)
0.0
Total
0 (0.0%)
0.0
Fertility by Age by Marriage Status in Shelby
Age Bracket
Married
Unmarried
15 to 19 years
0 (0.0%)
0 (0.0%)
20 to 34 years
0 (0.0%)
0 (0.0%)
35 to 50 years
0 (0.0%)
0 (0.0%)
Total
0 (0.0%)
0 (0.0%)
Fertility by Education in Shelby
Educational Attainment
Women with Births
Births / 1,000 Women
Less than High School
0 (0.0%)
0.0
High School Diploma
0 (0.0%)
0.0
College or Associate's Degree
0 (0.0%)
0.0
Bachelor's Degree
0 (0.0%)
0.0
Graduate Degree
0 (0.0%)
0.0
Total
0 (0.0%)
0.0
Fertility by Education by Marriage Status in Shelby
Educational Attainment
Married
Unmarried
Less than High School
0 (0.0%)
0 (0.0%)
High School Diploma
0 (0.0%)
0 (0.0%)
College or Associate's Degree
0 (0.0%)
0 (0.0%)
Bachelor's Degree
0 (0.0%)
0 (0.0%)
Graduate Degree
0 (0.0%)
0 (0.0%)
Total
0 (0.0%)
0 (0.0%)
Employment Characteristics in Shelby
Employment by Class of Employer in Shelby
Employer Class
# Employees
% Employees
Private Company Employees
0
0.0%
Self-Employed (Incorporated)
0
0.0%
Self-Employed (Not Incorporated)
0
0.0%
Not-for-profit Organizations
0
0.0%
Local Government Employees
0
0.0%
State Government Employees
0
0.0%
Federal Government Employees
0
0.0%
Unpaid Family Workers
0
0.0%
Total
0
0.0%
Employment Status by Age in Shelby
Age Bracket
In Labor Force
Unemployed
16 to 19 Years
0 (0.0%)
0 (0.0%)
20 to 24 Years
0 (0.0%)
0 (0.0%)
25 to 29 Years
0 (0.0%)
0 (0.0%)
30 to 34 Years
0 (0.0%)
0 (0.0%)
35 to 44 Years
0 (0.0%)
0 (0.0%)
45 to 54 Years
0 (0.0%)
0 (0.0%)
55 to 59 Years
0 (0.0%)
0 (0.0%)
60 to 64 Years
0 (0.0%)
0 (0.0%)
65 to 74 Years
0 (0.0%)
0 (0.0%)
75 Years and over
0 (0.0%)
0 (0.0%)
Total
0 (0.0%)
0 (0.0%)
Employment Status by Educational Attainment in Shelby
Educational Attainment
In Labor Force
Unemployed
Less than High School
0 (0.0%)
0 (0.0%)
High School Diploma
0 (0.0%)
0 (0.0%)
College / Associate Degree
0 (0.0%)
0 (0.0%)
Bachelor's Degree or higher
0 (0.0%)
0 (0.0%)
Total
0 (0.0%)
0 (0.0%)
Employment Occupations by Sex in Shelby
Management, Business, Science and Arts Occupations
Management, Business, Science and Arts Occupations by Sex
Occupation
Male
Female
Management
0 (0.0%)
0 (0.0%)
Business & Financial
0 (0.0%)
0 (0.0%)
Computers, Engineering & Science
0 (0.0%)
0 (0.0%)
Computers & Mathematics
0 (0.0%)
0 (0.0%)
Architecture & Engineering
0 (0.0%)
0 (0.0%)
Life, Physical & Social Science
0 (0.0%)
0 (0.0%)
Community & Social Service
0 (0.0%)
0 (0.0%)
Education, Arts & Media
0 (0.0%)
0 (0.0%)
Legal Services & Support
0 (0.0%)
0 (0.0%)
Education Instruction & Library
0 (0.0%)
0 (0.0%)
Arts, Media & Entertainment
0 (0.0%)
0 (0.0%)
Health Diagnosing & Treating
0 (0.0%)
0 (0.0%)
Health Technologists
0 (0.0%)
0 (0.0%)
Total (Category)
0 (0.0%)
0 (0.0%)
Total (Overall)
0 (0.0%)
0 (0.0%)
Services Occupations
Services Occupations by Sex
Occupation
Male
Female
Healthcare Support
0 (0.0%)
0 (0.0%)
Security & Protection
0 (0.0%)
0 (0.0%)
Firefighting & Prevention
0 (0.0%)
0 (0.0%)
Law Enforcement
0 (0.0%)
0 (0.0%)
Food Preparation & Serving
0 (0.0%)
0 (0.0%)
Cleaning & Maintenance
0 (0.0%)
0 (0.0%)
Personal Care & Service
0 (0.0%)
0 (0.0%)
Total (Category)
0 (0.0%)
0 (0.0%)
Total (Overall)
0 (0.0%)
0 (0.0%)
Sales and Office Occupations
Sales and Office Occupations by Sex
Occupation
Male
Female
Sales & Related
0 (0.0%)
0 (0.0%)
Office & Administration
0 (0.0%)
0 (0.0%)
Total (Category)
0 (0.0%)
0 (0.0%)
Total (Overall)
0 (0.0%)
0 (0.0%)
Natural Resources, Construction and Maintenance Occupations
Natural Resources, Construction and Maintenance Occupations by Sex
Occupation
Male
Female
Farming, Fishing & Forestry
0 (0.0%)
0 (0.0%)
Construction & Extraction
0 (0.0%)
0 (0.0%)
Installation, Maintenance & Repair
0 (0.0%)
0 (0.0%)
Total (Category)
0 (0.0%)
0 (0.0%)
Total (Overall)
0 (0.0%)
0 (0.0%)
Production, Transportation and Moving Occupations
Production, Transportation and Moving Occupations by Sex
Occupation
Male
Female
Production
0 (0.0%)
0 (0.0%)
Transportation
0 (0.0%)
0 (0.0%)
Material Moving
0 (0.0%)
0 (0.0%)
Total (Category)
0 (0.0%)
0 (0.0%)
Total (Overall)
0 (0.0%)
0 (0.0%)
Employment Industries by Sex in Shelby
Employment Industries in Shelby
Employment Industries by Sex in Shelby
Industry
Male
Female
Agriculture, Fishing & Hunting
0 (0.0%)
0 (0.0%)
Mining, Quarrying, & Extraction
0 (0.0%)
0 (0.0%)
Construction
0 (0.0%)
0 (0.0%)
Manufacturing
0 (0.0%)
0 (0.0%)
Wholesale Trade
0 (0.0%)
0 (0.0%)
Retail Trade
0 (0.0%)
0 (0.0%)
Transportation & Warehousing
0 (0.0%)
0 (0.0%)
Utilities
0 (0.0%)
0 (0.0%)
Information
0 (0.0%)
0 (0.0%)
Finance & Insurance
0 (0.0%)
0 (0.0%)
Real Estate, Rental & Leasing
0 (0.0%)
0 (0.0%)
Professional & Scientific
0 (0.0%)
0 (0.0%)
Enterprise Management
0 (0.0%)
0 (0.0%)
Administrative & Support
0 (0.0%)
0 (0.0%)
Educational Services
0 (0.0%)
0 (0.0%)
Health Care & Social Assistance
0 (0.0%)
0 (0.0%)
Arts, Entertainment & Recreation
0 (0.0%)
0 (0.0%)
Accommodation & Food Services
0 (0.0%)
0 (0.0%)
Public Administration
0 (0.0%)
0 (0.0%)
Total
0 (0.0%)
0 (0.0%)
Education in Shelby
School Enrollment in Shelby
School Level
# Students
% Students
Nursery / Preschool
0
0.0%
Kindergarten
0
0.0%
Elementary School
0
0.0%
Middle School
0
0.0%
High School
0
0.0%
College / Undergraduate
0
0.0%
Graduate / Professional
0
0.0%
Total
0
0.0%
School Enrollment by Age by Funding Source in Shelby
Age Bracket
Public School
Private School
3 to 4 Year Olds
0 (0.0%)
0 (0.0%)
5 to 9 Year Old
0 (0.0%)
0 (0.0%)
10 to 14 Year Olds
0 (0.0%)
0 (0.0%)
15 to 17 Year Olds
0 (0.0%)
0 (0.0%)
18 to 19 Year Olds
0 (0.0%)
0 (0.0%)
20 to 24 Year Olds
0 (0.0%)
0 (0.0%)
25 to 34 Year Olds
0 (0.0%)
0 (0.0%)
35 Years and over
0 (0.0%)
0 (0.0%)
Total
0 (0.0%)
0 (0.0%)
Educational Attainment by Field of Study in Shelby
Field of Study
# Graduates
% Graduates
Computers & Mathematics
0
0.0%
Bio, Nature & Agricultural
0
0.0%
Physical & Health Sciences
0
0.0%
Psychology
0
0.0%
Social Sciences
0
0.0%
Engineering
0
0.0%
Multidisciplinary Studies
0
0.0%
Science & Technology
0
0.0%
Business
0
0.0%
Education
0
0.0%
Literature & Languages
0
0.0%
Liberal Arts & History
0
0.0%
Visual & Performing Arts
0
0.0%
Communications
0
0.0%
Arts & Humanities
0
0.0%
Total
0
0.0%
Transportation & Commute in Shelby
Vehicle Availability by Sex in Shelby
Vehicles Available
Male
Female
No Vehicle
0 (0.0%)
0 (0.0%)
1 Vehicle
0 (0.0%)
0 (0.0%)
2 Vehicles
0 (0.0%)
0 (0.0%)
3 Vehicles
0 (0.0%)
0 (0.0%)
4 Vehicles
0 (0.0%)
0 (0.0%)
5 or more Vehicles
0 (0.0%)
0 (0.0%)
Total
0 (0.0%)
0 (0.0%)
Commute Time in Shelby
Commute Time
# Commuters
% Commuters
Less than 5 Minutes
0
0.0%
5 to 9 Minutes
0
0.0%
10 to 14 Minutes
0
0.0%
15 to 19 Minutes
0
0.0%
20 to 24 Minutes
0
0.0%
25 to 29 Minutes
0
0.0%
30 to 34 Minutes
0
0.0%
35 to 39 Minutes
0
0.0%
40 to 44 Minutes
0
0.0%
45 to 59 Minutes
0
0.0%
60 to 89 Minutes
0
0.0%
90 or more Minutes
0
0.0%
Commute Time by Sex in Shelby
Commute Time
Male
Female
Less than 5 Minutes
0 (0.0%)
0 (0.0%)
5 to 9 Minutes
0 (0.0%)
0 (0.0%)
10 to 14 Minutes
0 (0.0%)
0 (0.0%)
15 to 19 Minutes
0 (0.0%)
0 (0.0%)
20 to 24 Minutes
0 (0.0%)
0 (0.0%)
25 to 29 Minutes
0 (0.0%)
0 (0.0%)
30 to 34 Minutes
0 (0.0%)
0 (0.0%)
35 to 39 Minutes
0 (0.0%)
0 (0.0%)
40 to 44 Minutes
0 (0.0%)
0 (0.0%)
45 to 59 Minutes
0 (0.0%)
0 (0.0%)
60 to 89 Minutes
0 (0.0%)
0 (0.0%)
90 or more Minutes
0 (0.0%)
0 (0.0%)
Time of Departure to Work by Sex in Shelby
Time of Departure
Male
Female
12:00 AM to 4:59 AM
0 (0.0%)
0 (0.0%)
5:00 AM to 5:29 AM
0 (0.0%)
0 (0.0%)
5:30 AM to 5:59 AM
0 (0.0%)
0 (0.0%)
6:00 AM to 6:29 AM
0 (0.0%)
0 (0.0%)
6:30 AM to 6:59 AM
0 (0.0%)
0 (0.0%)
7:00 AM to 7:29 AM
0 (0.0%)
0 (0.0%)
7:30 AM to 7:59 AM
0 (0.0%)
0 (0.0%)
8:00 AM to 8:29 AM
0 (0.0%)
0 (0.0%)
8:30 AM to 8:59 AM
0 (0.0%)
0 (0.0%)
9:00 AM to 9:59 AM
0 (0.0%)
0 (0.0%)
10:00 AM to 10:59 AM
0 (0.0%)
0 (0.0%)
11:00 AM to 11:59 AM
0 (0.0%)
0 (0.0%)
12:00 PM to 3:59 PM
0 (0.0%)
0 (0.0%)
4:00 PM to 11:59 PM
0 (0.0%)
0 (0.0%)
Total
0 (0.0%)
0 (0.0%)
Housing Occupancy in Shelby
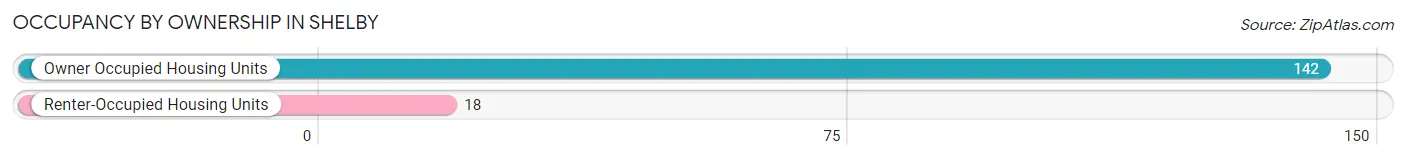
Occupancy by Ownership in Shelby
Of the total 160 dwellings in Shelby, owner-occupied units account for 142 (88.7%), while renter-occupied units make up 18 (11.3%).
Occupancy
# Housing Units
% Housing Units
Owner Occupied Housing Units
142
88.7%
Renter-Occupied Housing Units
18
11.3%
Total Occupied Housing Units
160
100.0%
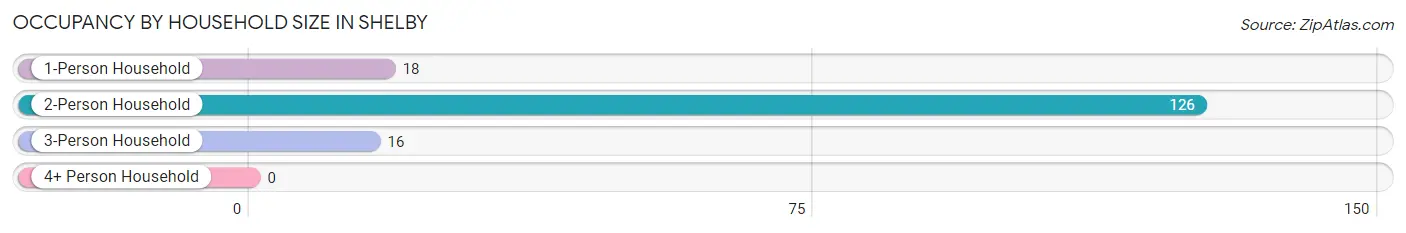
Occupancy by Household Size in Shelby
Household Size
# Housing Units
% Housing Units
1-Person Household
18
11.3%
2-Person Household
126
78.7%
3-Person Household
16
10.0%
4+ Person Household
0
0.0%
Total Housing Units
160
100.0%
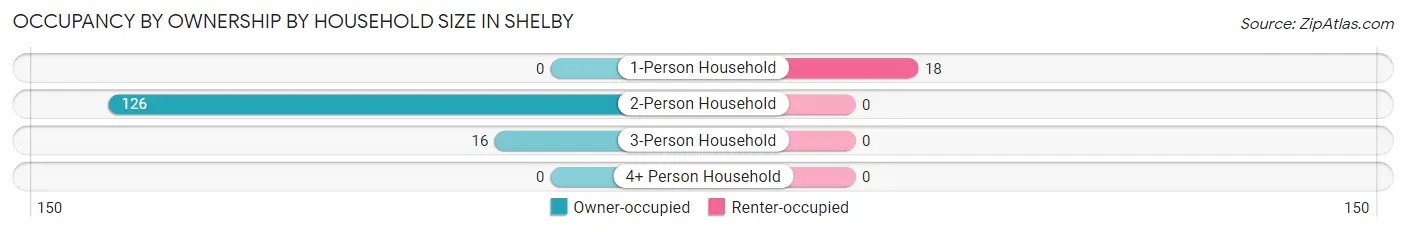
Occupancy by Ownership by Household Size in Shelby
Household Size
Owner-occupied
Renter-occupied
1-Person Household
0 (0.0%)
18 (100.0%)
2-Person Household
126 (100.0%)
0 (0.0%)
3-Person Household
16 (100.0%)
0 (0.0%)
4+ Person Household
0 (0.0%)
0 (0.0%)
Total Housing Units
142 (88.7%)
18 (11.3%)
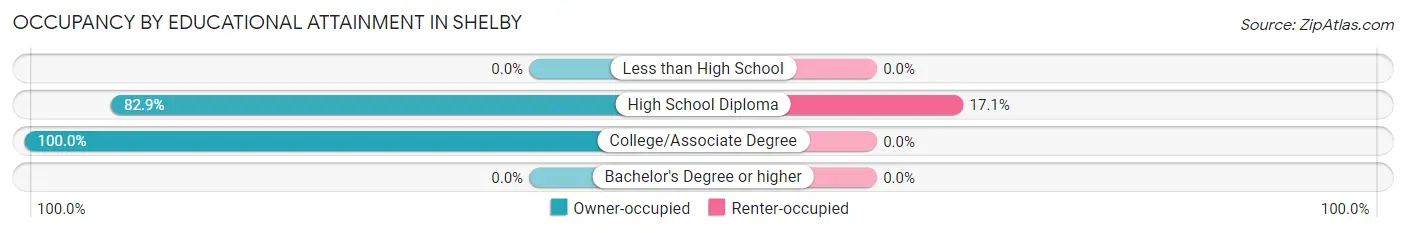
Occupancy by Educational Attainment in Shelby
Household Size
Owner-occupied
Renter-occupied
Less than High School
0 (0.0%)
0 (0.0%)
High School Diploma
87 (82.9%)
18 (17.1%)
College/Associate Degree
55 (100.0%)
0 (0.0%)
Bachelor's Degree or higher
0 (0.0%)
0 (0.0%)
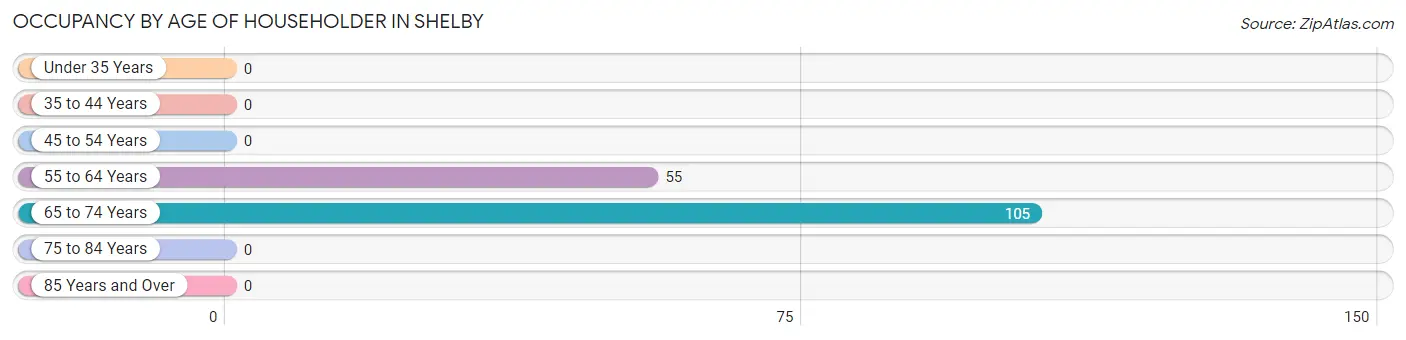
Occupancy by Age of Householder in Shelby
Age Bracket
# Households
% Households
Under 35 Years
0
0.0%
35 to 44 Years
0
0.0%
45 to 54 Years
0
0.0%
55 to 64 Years
55
34.4%
65 to 74 Years
105
65.6%
75 to 84 Years
0
0.0%
85 Years and Over
0
0.0%
Total
160
100.0%
Housing Finances in Shelby
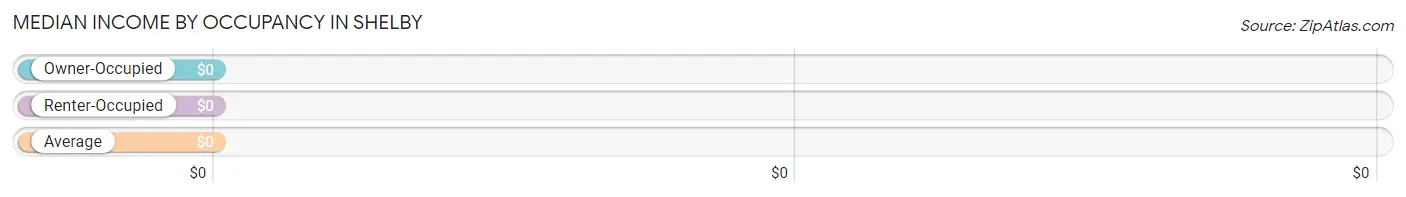
Median Income by Occupancy in Shelby
Occupancy Type
# Households
Median Income
Owner-Occupied
142 (88.7%)
$0
Renter-Occupied
18 (11.3%)
$0
Average
160 (100.0%)
$0
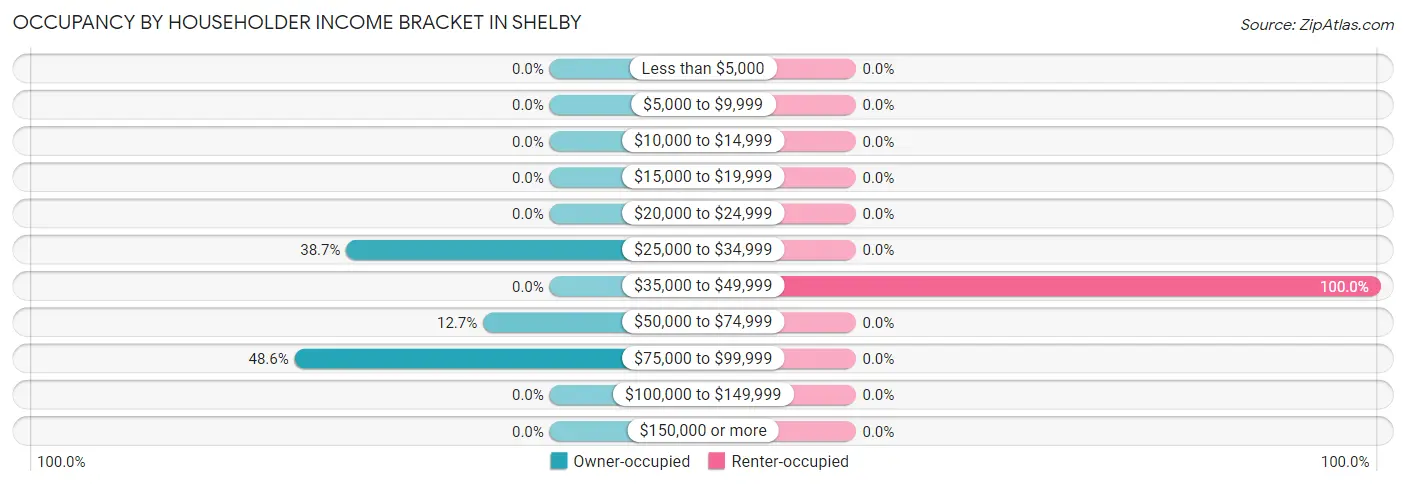
Occupancy by Householder Income Bracket in Shelby
Income Bracket
Owner-occupied
Renter-occupied
Less than $5,000
0 (0.0%)
0 (0.0%)
$5,000 to $9,999
0 (0.0%)
0 (0.0%)
$10,000 to $14,999
0 (0.0%)
0 (0.0%)
$15,000 to $19,999
0 (0.0%)
0 (0.0%)
$20,000 to $24,999
0 (0.0%)
0 (0.0%)
$25,000 to $34,999
55 (38.7%)
0 (0.0%)
$35,000 to $49,999
0 (0.0%)
18 (100.0%)
$50,000 to $74,999
18 (12.7%)
0 (0.0%)
$75,000 to $99,999
69 (48.6%)
0 (0.0%)
$100,000 to $149,999
0 (0.0%)
0 (0.0%)
$150,000 or more
0 (0.0%)
0 (0.0%)
Total
142 (100.0%)
18 (100.0%)
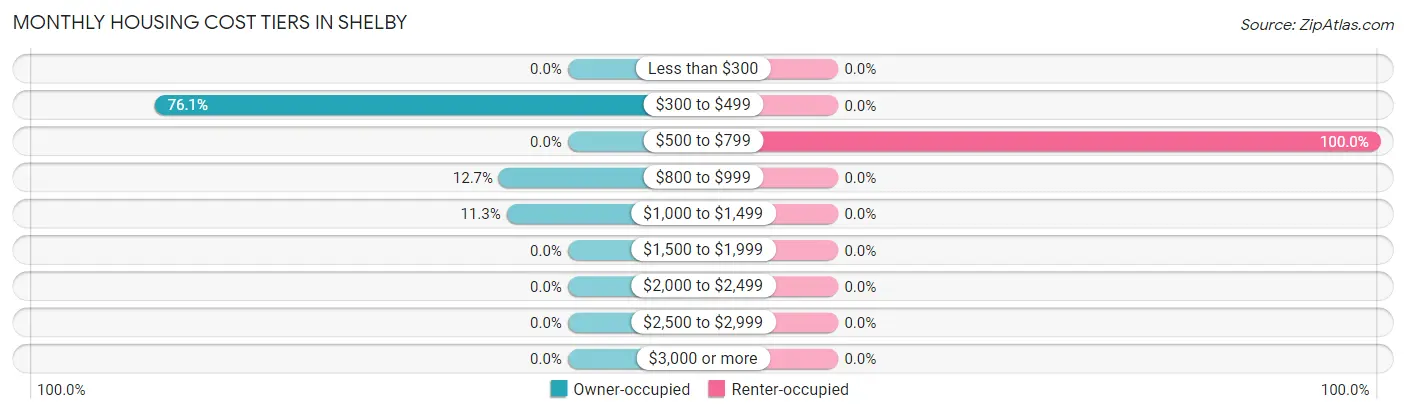
Monthly Housing Cost Tiers in Shelby
Monthly Cost
Owner-occupied
Renter-occupied
Less than $300
0 (0.0%)
0 (0.0%)
$300 to $499
108 (76.1%)
0 (0.0%)
$500 to $799
0 (0.0%)
18 (100.0%)
$800 to $999
18 (12.7%)
0 (0.0%)
$1,000 to $1,499
16 (11.3%)
0 (0.0%)
$1,500 to $1,999
0 (0.0%)
0 (0.0%)
$2,000 to $2,499
0 (0.0%)
0 (0.0%)
$2,500 to $2,999
0 (0.0%)
0 (0.0%)
$3,000 or more
0 (0.0%)
0 (0.0%)
Total
142 (100.0%)
18 (100.0%)
Physical Housing Characteristics in Shelby
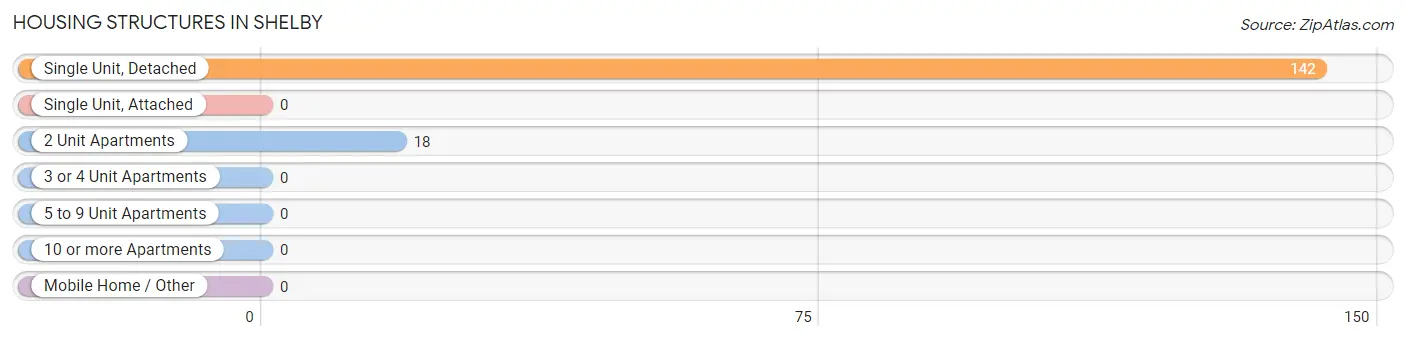
Housing Structures in Shelby
Structure Type
# Housing Units
% Housing Units
Single Unit, Detached
142
88.7%
Single Unit, Attached
0
0.0%
2 Unit Apartments
18
11.3%
3 or 4 Unit Apartments
0
0.0%
5 to 9 Unit Apartments
0
0.0%
10 or more Apartments
0
0.0%
Mobile Home / Other
0
0.0%
Total
160
100.0%
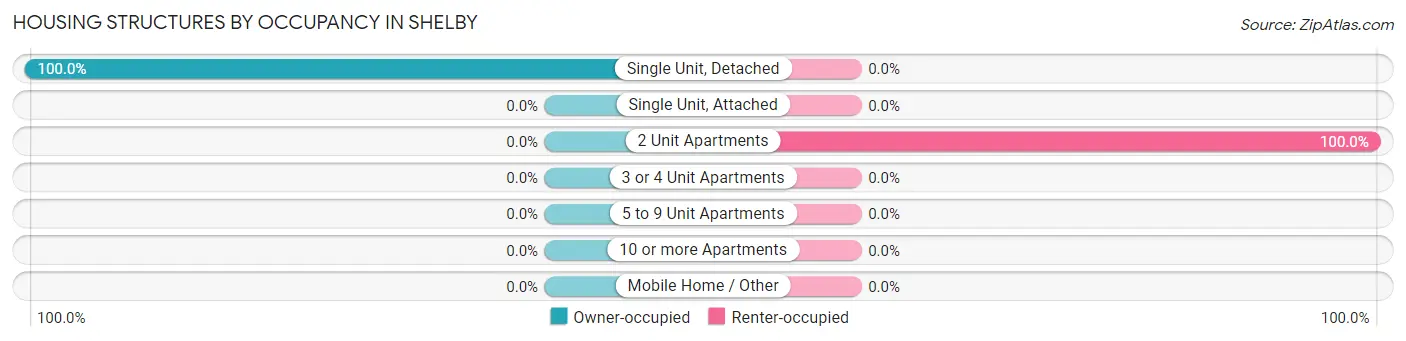
Housing Structures by Occupancy in Shelby
Structure Type
Owner-occupied
Renter-occupied
Single Unit, Detached
142 (100.0%)
0 (0.0%)
Single Unit, Attached
0 (0.0%)
0 (0.0%)
2 Unit Apartments
0 (0.0%)
18 (100.0%)
3 or 4 Unit Apartments
0 (0.0%)
0 (0.0%)
5 to 9 Unit Apartments
0 (0.0%)
0 (0.0%)
10 or more Apartments
0 (0.0%)
0 (0.0%)
Mobile Home / Other
0 (0.0%)
0 (0.0%)
Total
142 (88.7%)
18 (11.3%)
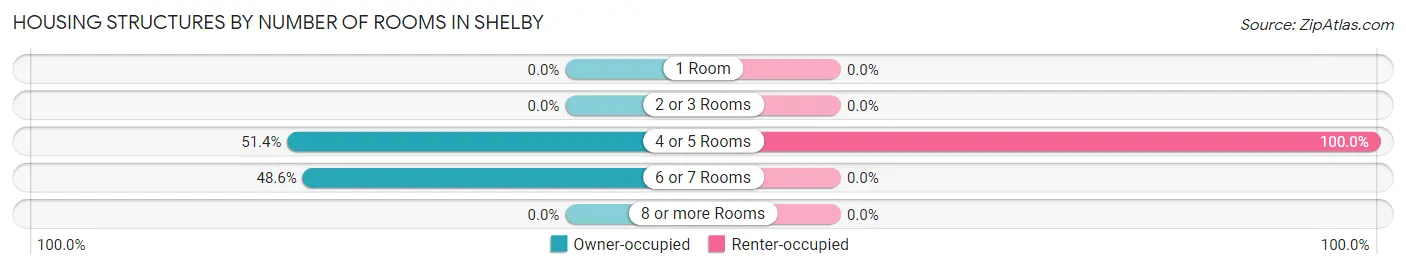
Housing Structures by Number of Rooms in Shelby
Number of Rooms
Owner-occupied
Renter-occupied
1 Room
0 (0.0%)
0 (0.0%)
2 or 3 Rooms
0 (0.0%)
0 (0.0%)
4 or 5 Rooms
73 (51.4%)
18 (100.0%)
6 or 7 Rooms
69 (48.6%)
0 (0.0%)
8 or more Rooms
0 (0.0%)
0 (0.0%)
Total
142 (100.0%)
18 (100.0%)
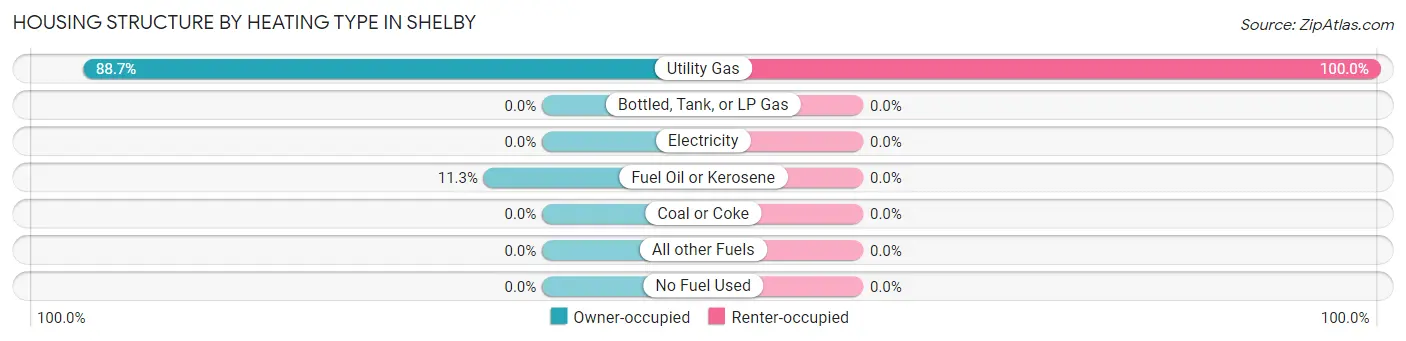
Housing Structure by Heating Type in Shelby
Heating Type
Owner-occupied
Renter-occupied
Utility Gas
126 (88.7%)
18 (100.0%)
Bottled, Tank, or LP Gas
0 (0.0%)
0 (0.0%)
Electricity
0 (0.0%)
0 (0.0%)
Fuel Oil or Kerosene
16 (11.3%)
0 (0.0%)
Coal or Coke
0 (0.0%)
0 (0.0%)
All other Fuels
0 (0.0%)
0 (0.0%)
No Fuel Used
0 (0.0%)
0 (0.0%)
Total
142 (100.0%)
18 (100.0%)
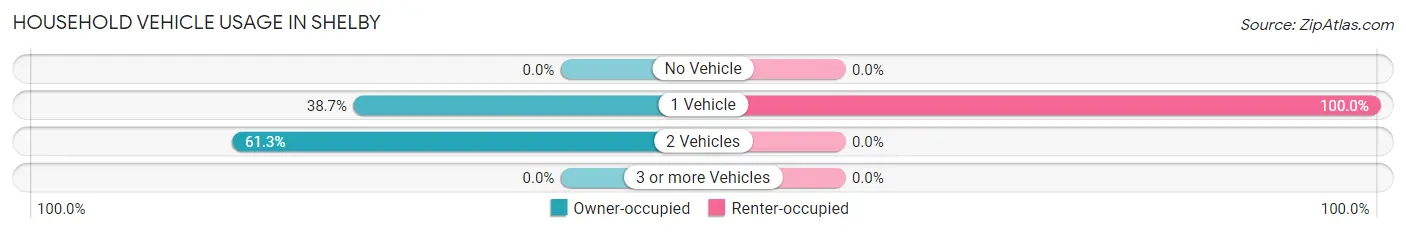
Household Vehicle Usage in Shelby
Vehicles per Household
Owner-occupied
Renter-occupied
No Vehicle
0 (0.0%)
0 (0.0%)
1 Vehicle
55 (38.7%)
18 (100.0%)
2 Vehicles
87 (61.3%)
0 (0.0%)
3 or more Vehicles
0 (0.0%)
0 (0.0%)
Total
142 (100.0%)
18 (100.0%)
Real Estate & Mortgages in Shelby
Real Estate and Mortgage Overview in Shelby
Characteristic
Without Mortgage
With Mortgage
Housing Units
108
34
Median Property Value
-
-
Median Household Income
-
-
Monthly Housing Costs
-
-
Real Estate Taxes
-
-
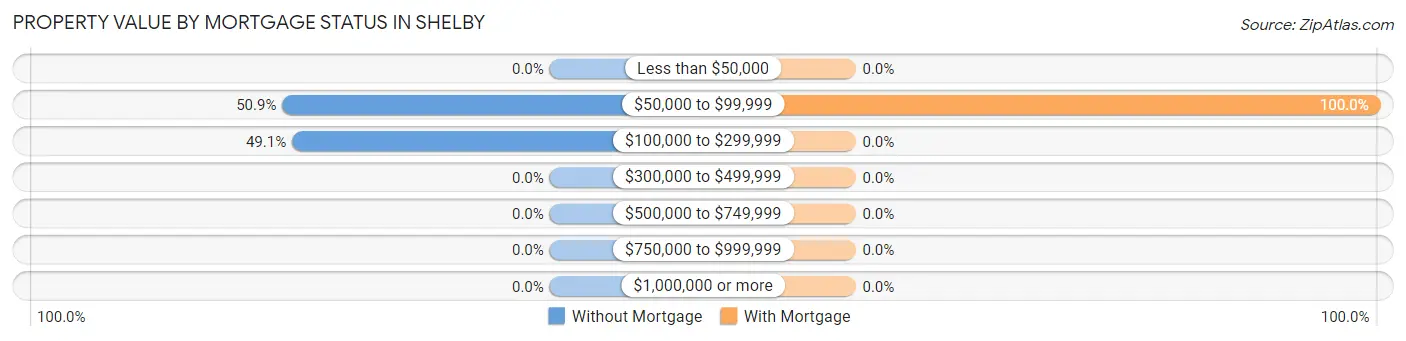
Property Value by Mortgage Status in Shelby
Property Value
Without Mortgage
With Mortgage
Less than $50,000
0 (0.0%)
0 (0.0%)
$50,000 to $99,999
55 (50.9%)
34 (100.0%)
$100,000 to $299,999
53 (49.1%)
0 (0.0%)
$300,000 to $499,999
0 (0.0%)
0 (0.0%)
$500,000 to $749,999
0 (0.0%)
0 (0.0%)
$750,000 to $999,999
0 (0.0%)
0 (0.0%)
$1,000,000 or more
0 (0.0%)
0 (0.0%)
Total
108 (100.0%)
34 (100.0%)
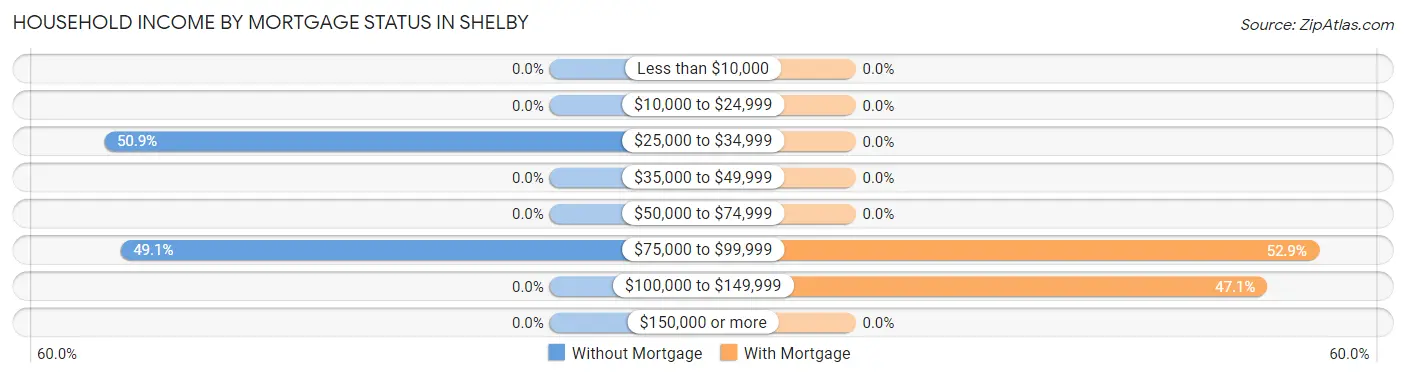
Household Income by Mortgage Status in Shelby
Household Income
Without Mortgage
With Mortgage
Less than $10,000
0 (0.0%)
0 (0.0%)
$10,000 to $24,999
0 (0.0%)
0 (0.0%)
$25,000 to $34,999
55 (50.9%)
0 (0.0%)
$35,000 to $49,999
0 (0.0%)
0 (0.0%)
$50,000 to $74,999
0 (0.0%)
0 (0.0%)
$75,000 to $99,999
53 (49.1%)
18 (52.9%)
$100,000 to $149,999
0 (0.0%)
16 (47.1%)
$150,000 or more
0 (0.0%)
0 (0.0%)
Total
108 (100.0%)
34 (100.0%)
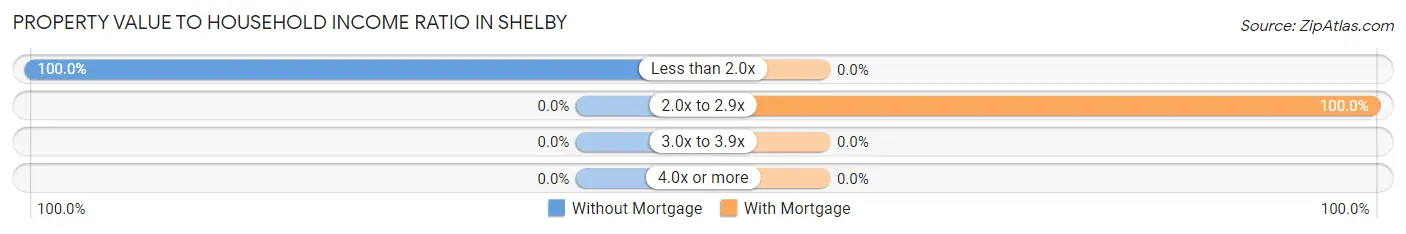
Property Value to Household Income Ratio in Shelby
Value-to-Income Ratio
Without Mortgage
With Mortgage
Less than 2.0x
108 (100.0%)
0 (0.0%)
2.0x to 2.9x
0 (0.0%)
34 (100.0%)
3.0x to 3.9x
0 (0.0%)
0 (0.0%)
4.0x or more
0 (0.0%)
0 (0.0%)
Total
108 (100.0%)
34 (100.0%)
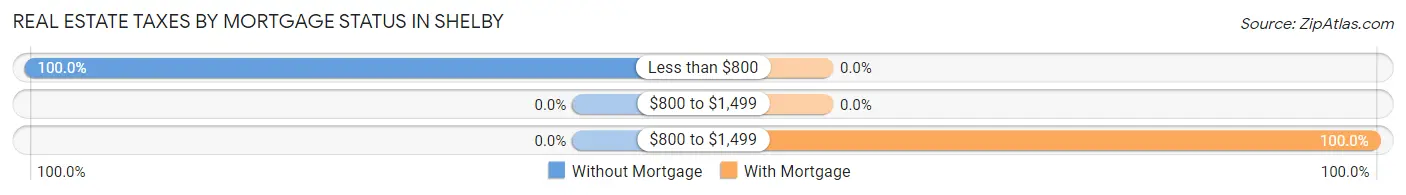
Real Estate Taxes by Mortgage Status in Shelby
Property Taxes
Without Mortgage
With Mortgage
Less than $800
108 (100.0%)
0 (0.0%)
$800 to $1,499
0 (0.0%)
0 (0.0%)
$800 to $1,499
0 (0.0%)
34 (100.0%)
Total
108 (100.0%)
34 (100.0%)
Health & Disability in Shelby
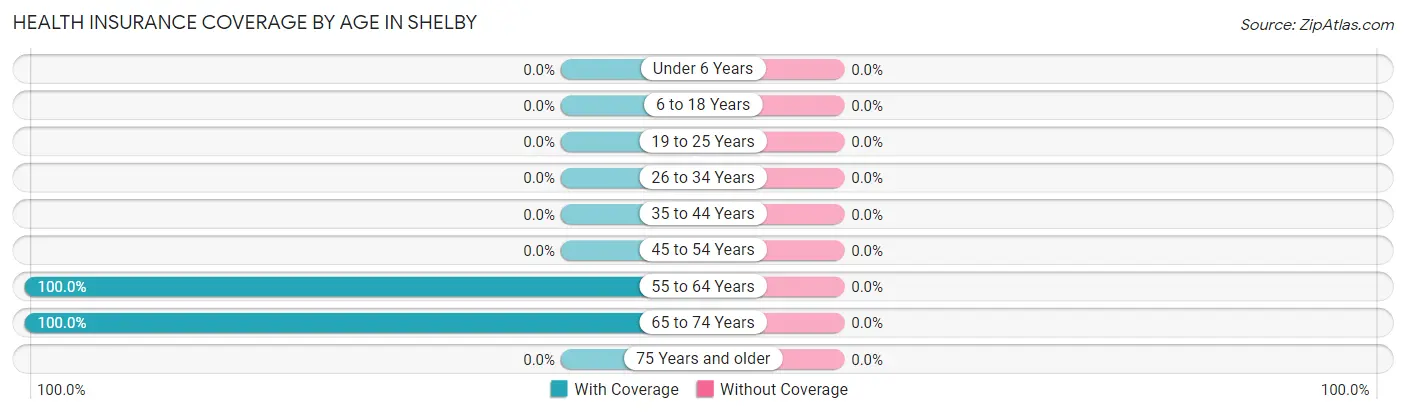
Health Insurance Coverage by Age in Shelby
Age Bracket
With Coverage
Without Coverage
Under 6 Years
0 (0.0%)
0 (0.0%)
6 to 18 Years
0 (0.0%)
0 (0.0%)
19 to 25 Years
0 (0.0%)
0 (0.0%)
26 to 34 Years
0 (0.0%)
0 (0.0%)
35 to 44 Years
0 (0.0%)
0 (0.0%)
45 to 54 Years
0 (0.0%)
0 (0.0%)
55 to 64 Years
73 (100.0%)
0 (0.0%)
65 to 74 Years
235 (100.0%)
0 (0.0%)
75 Years and older
0 (0.0%)
0 (0.0%)
Total
308 (100.0%)
0 (0.0%)
Health Insurance Coverage by Citizenship Status in Shelby
Citizenship Status
With Coverage
Without Coverage
Native Born
0 (0.0%)
0 (0.0%)
Foreign Born, Citizen
0 (0.0%)
0 (0.0%)
Foreign Born, not a Citizen
0 (0.0%)
0 (0.0%)
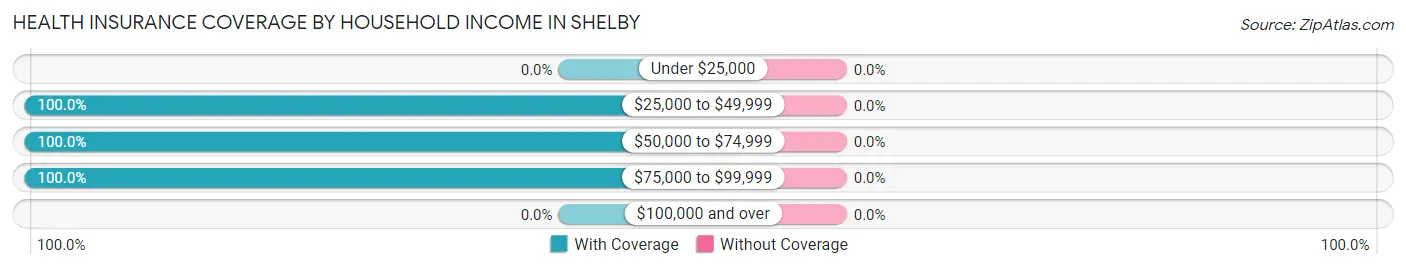
Health Insurance Coverage by Household Income in Shelby
Household Income
With Coverage
Without Coverage
Under $25,000
0 (0.0%)
0 (0.0%)
$25,000 to $49,999
123 (100.0%)
0 (0.0%)
$50,000 to $74,999
36 (100.0%)
0 (0.0%)
$75,000 to $99,999
149 (100.0%)
0 (0.0%)
$100,000 and over
0 (0.0%)
0 (0.0%)
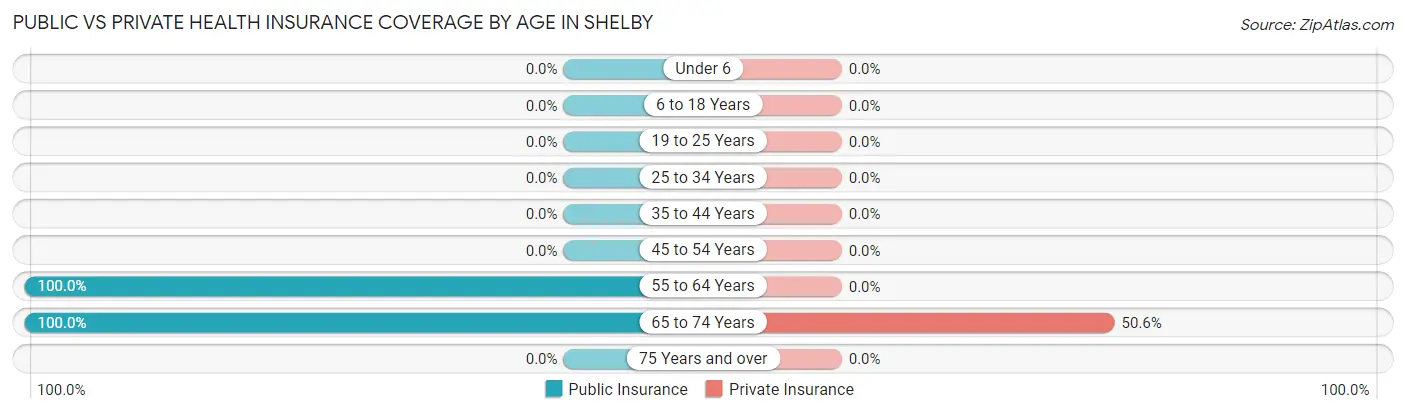
Public vs Private Health Insurance Coverage by Age in Shelby
Age Bracket
Public Insurance
Private Insurance
Under 6
0 (0.0%)
0 (0.0%)
6 to 18 Years
0 (0.0%)
0 (0.0%)
19 to 25 Years
0 (0.0%)
0 (0.0%)
25 to 34 Years
0 (0.0%)
0 (0.0%)
35 to 44 Years
0 (0.0%)
0 (0.0%)
45 to 54 Years
0 (0.0%)
0 (0.0%)
55 to 64 Years
73 (100.0%)
0 (0.0%)
65 to 74 Years
235 (100.0%)
119 (50.6%)
75 Years and over
0 (0.0%)
0 (0.0%)
Total
308 (100.0%)
119 (38.6%)
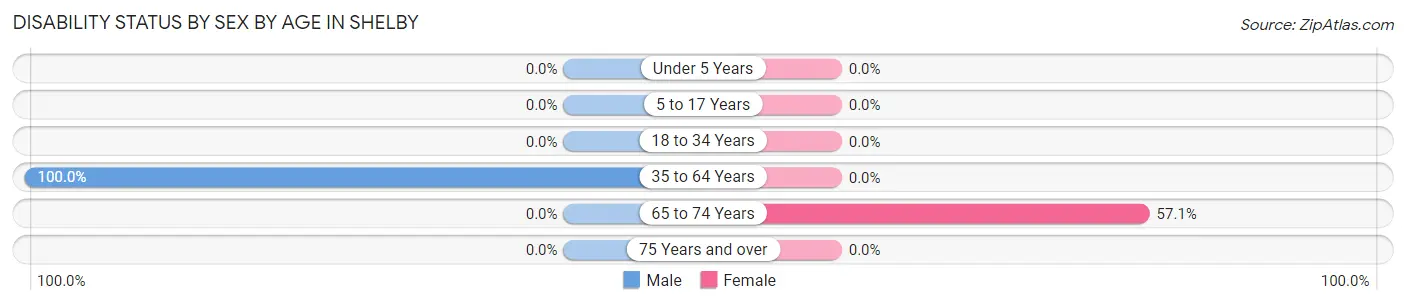
Disability Status by Sex by Age in Shelby
Age Bracket
Male
Female
Under 5 Years
0 (0.0%)
0 (0.0%)
5 to 17 Years
0 (0.0%)
0 (0.0%)
18 to 34 Years
0 (0.0%)
0 (0.0%)
35 to 64 Years
55 (100.0%)
0 (0.0%)
65 to 74 Years
0 (0.0%)
64 (57.1%)
75 Years and over
0 (0.0%)
0 (0.0%)
Disability Class by Sex by Age in Shelby
Disability Class: Hearing Difficulty
Age Bracket
Male
Female
Under 5 Years
0 (0.0%)
0 (0.0%)
5 to 17 Years
0 (0.0%)
0 (0.0%)
18 to 34 Years
0 (0.0%)
0 (0.0%)
35 to 64 Years
0 (0.0%)
0 (0.0%)
65 to 74 Years
0 (0.0%)
0 (0.0%)
75 Years and over
0 (0.0%)
0 (0.0%)
Disability Class: Vision Difficulty
Age Bracket
Male
Female
Under 5 Years
0 (0.0%)
0 (0.0%)
5 to 17 Years
0 (0.0%)
0 (0.0%)
18 to 34 Years
0 (0.0%)
0 (0.0%)
35 to 64 Years
0 (0.0%)
0 (0.0%)
65 to 74 Years
0 (0.0%)
0 (0.0%)
75 Years and over
0 (0.0%)
0 (0.0%)
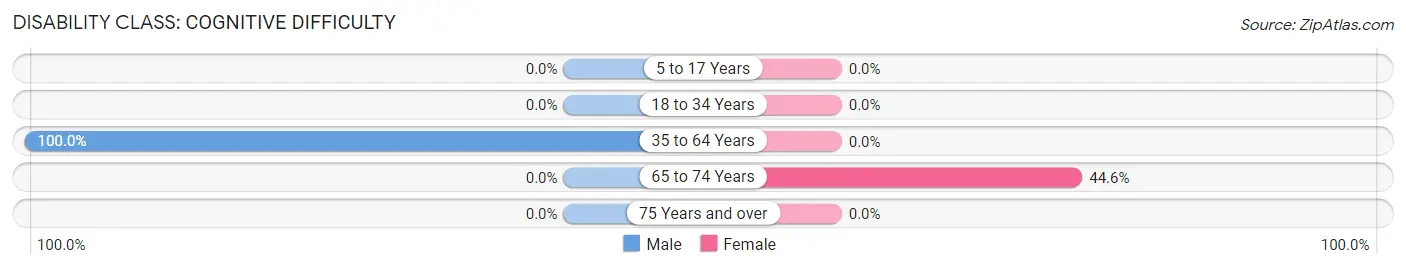
Disability Class: Cognitive Difficulty
Age Bracket
Male
Female
5 to 17 Years
0 (0.0%)
0 (0.0%)
18 to 34 Years
0 (0.0%)
0 (0.0%)
35 to 64 Years
55 (100.0%)
0 (0.0%)
65 to 74 Years
0 (0.0%)
50 (44.6%)
75 Years and over
0 (0.0%)
0 (0.0%)
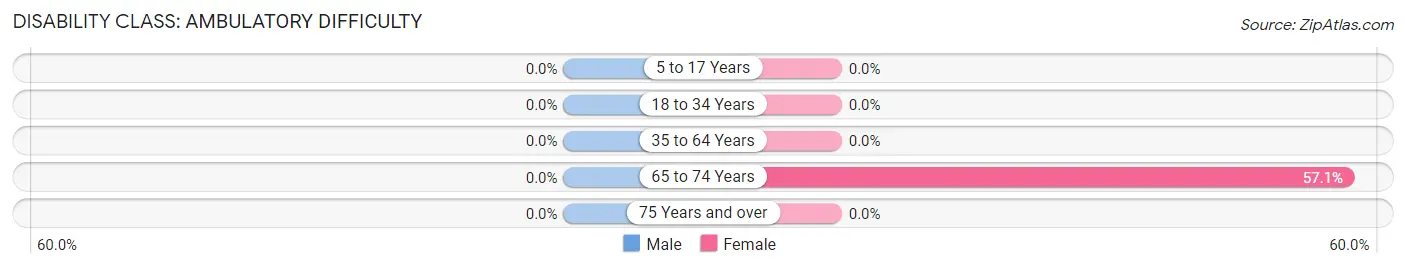
Disability Class: Ambulatory Difficulty
Age Bracket
Male
Female
5 to 17 Years
0 (0.0%)
0 (0.0%)
18 to 34 Years
0 (0.0%)
0 (0.0%)
35 to 64 Years
0 (0.0%)
0 (0.0%)
65 to 74 Years
0 (0.0%)
64 (57.1%)
75 Years and over
0 (0.0%)
0 (0.0%)
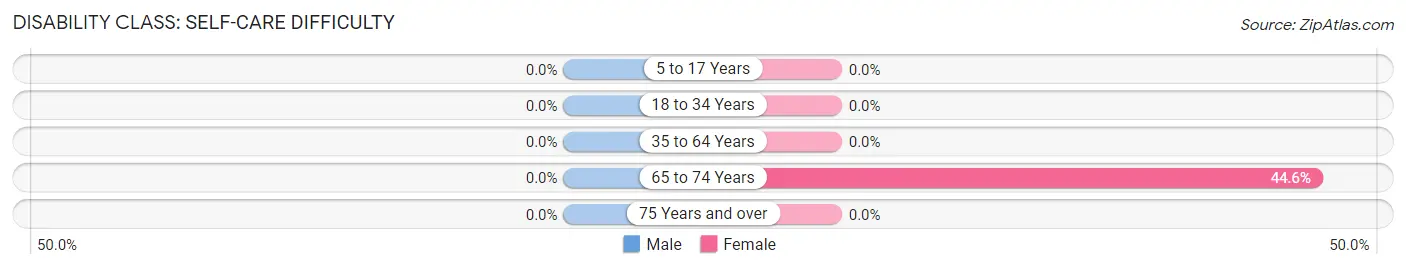
Disability Class: Self-Care Difficulty
Age Bracket
Male
Female
5 to 17 Years
0 (0.0%)
0 (0.0%)
18 to 34 Years
0 (0.0%)
0 (0.0%)
35 to 64 Years
0 (0.0%)
0 (0.0%)
65 to 74 Years
0 (0.0%)
50 (44.6%)
75 Years and over
0 (0.0%)
0 (0.0%)
Technology Access in Shelby
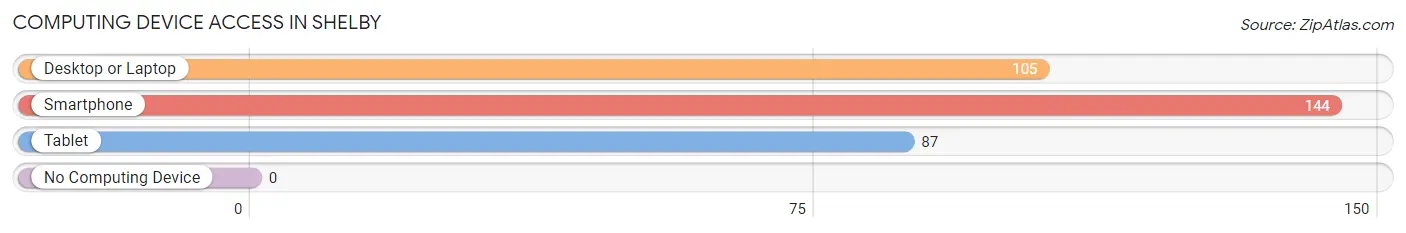
Computing Device Access in Shelby
Device Type
# Households
% Households
Desktop or Laptop
105
65.6%
Smartphone
144
90.0%
Tablet
87
54.4%
No Computing Device
0
0.0%
Total
160
100.0%
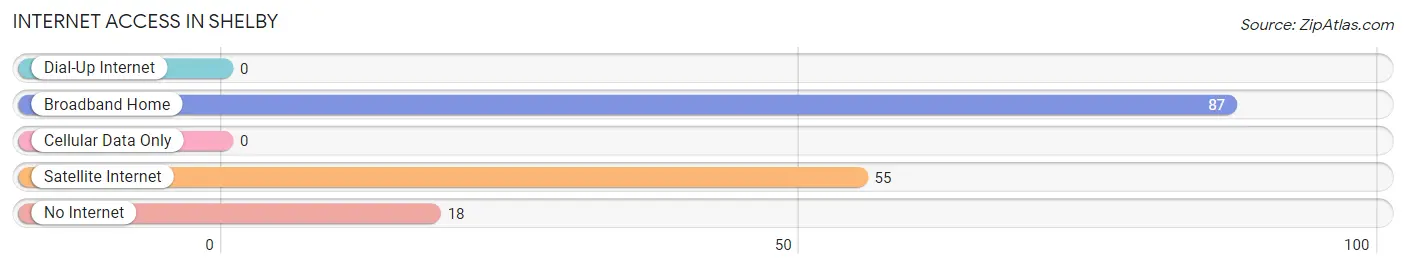
Internet Access in Shelby
Internet Type
# Households
% Households
Dial-Up Internet
0
0.0%
Broadband Home
87
54.4%
Cellular Data Only
0
0.0%
Satellite Internet
55
34.4%
No Internet
18
11.3%
Total
160
100.0%
Shelby Summary
Shelby, Indiana is a small town located in the northwest corner of Indiana, in the United States. It is part of the Chicago metropolitan area and is located in the county of Shelby. The town has a population of approximately 2,000 people and is located in the heart of the Midwest.
History
Shelby was founded in 1837 by a group of settlers from Ohio. The town was named after the nearby Shelby Creek, which was named after the Revolutionary War hero, Isaac Shelby. The town was originally a farming community, but it soon became a center for industry. In 1851, the first railroad line was built through Shelby, connecting it to the larger cities of Chicago and Indianapolis. This allowed for the growth of the town and the development of a variety of businesses.
In the late 19th century, Shelby became a popular tourist destination. The town was known for its beautiful scenery and its many attractions, such as the Shelby County Fairgrounds and the Shelby County Museum. The town also had a variety of hotels and restaurants, which attracted visitors from all over the Midwest.
Geography
Shelby is located in the northwest corner of Indiana, in the United States. It is part of the Chicago metropolitan area and is located in the county of Shelby. The town is situated on the banks of the Wabash River and is surrounded by rolling hills and farmland. The town is located approximately 50 miles from Indianapolis and is about a two-hour drive from Chicago.
Economy
Shelby’s economy is largely based on agriculture and manufacturing. The town is home to a variety of farms, which produce a variety of crops, including corn, soybeans, and wheat. The town also has a number of manufacturing plants, which produce a variety of products, including furniture, automotive parts, and medical supplies.
In addition to agriculture and manufacturing, Shelby also has a number of small businesses, such as restaurants, retail stores, and service providers. The town also has a number of tourist attractions, such as the Shelby County Fairgrounds and the Shelby County Museum.
Demographics
As of the 2010 census, the population of Shelby was 2,000 people. The town is predominantly white, with approximately 95% of the population being white. The town also has a small Hispanic population, with approximately 4% of the population being Hispanic. The median household income in Shelby is approximately $45,000, and the median home value is approximately $150,000.
Shelby is a small town with a rich history and a vibrant economy. The town is home to a variety of businesses, attractions, and services, and it is a great place to live and work. The town is also a great place to visit, with its beautiful scenery and its many attractions.
Common Questions
What is Per Capita Income in Shelby?
Per Capita income in Shelby is $27,298.
What is the Median Family Income in Shelby?
Median Family Income in Shelby is $78,703.
What is Inequality or Gini Index in Shelby?
Inequality or Gini Index in Shelby is 0.23.
What is the Total Population of Shelby?
Total Population of Shelby is 308.
What is the Total Male Population of Shelby?
Total Male Population of Shelby is 178.
What is the Total Female Population of Shelby?
Total Female Population of Shelby is 130.
What is the Ratio of Males per 100 Females in Shelby?
There are 136.92 Males per 100 Females in Shelby.
What is the Ratio of Females per 100 Males in Shelby?
There are 73.03 Females per 100 Males in Shelby.
What is the Median Population Age in Shelby?
Median Population Age in Shelby is 66.1 Years.
What is the Average Family Size in Shelby
Average Family Size in Shelby is 2.1 People.
What is the Average Household Size in Shelby
Average Household Size in Shelby is 1.9 People.
Report Title
Report Link
HTML Copy & Paste Link
Social Media
Copy and paste the folowing code into any webpage where you would like this interactive chart to display