San Pierre, IN Map & Demographics
San Pierre Map
San Pierre Overview
$22,969
PER CAPITA INCOME
$133,438
AVG FAMILY INCOME
$61,250
AVG HOUSEHOLD INCOME
0.37
INEQUALITY / GINI INDEX
436
TOTAL POPULATION
249
MALE POPULATION
187
FEMALE POPULATION
133.16
MALES / 100 FEMALES
75.10
FEMALES / 100 MALES
24.9
MEDIAN AGE
7.3
AVG FAMILY SIZE
4.2
AVG HOUSEHOLD SIZE
234
LABOR FORCE [ PEOPLE ]
74.8%
PERCENT IN LABOR FORCE
San Pierre Zip Codes
Income in San Pierre
Income Overview in San Pierre
Per Capita Income in San Pierre is $22,969, while median incomes of families and households are $133,438 and $61,250 respectively.
| Characteristic | Number | Measure |
| Per Capita Income | 436 | $22,969 |
| Median Family Income | 52 | $133,438 |
| Mean Family Income | 52 | $108,848 |
| Median Household Income | 103 | $61,250 |
| Mean Household Income | 103 | $77,066 |
| Income Deficit | 52 | $0 |
| Wage / Income Gap (%) | 436 | 0.00% |
| Wage / Income Gap ($) | 436 | 100.00¢ per $1 |
| Gini / Inequality Index | 436 | 0.37 |
Earnings by Sex in San Pierre
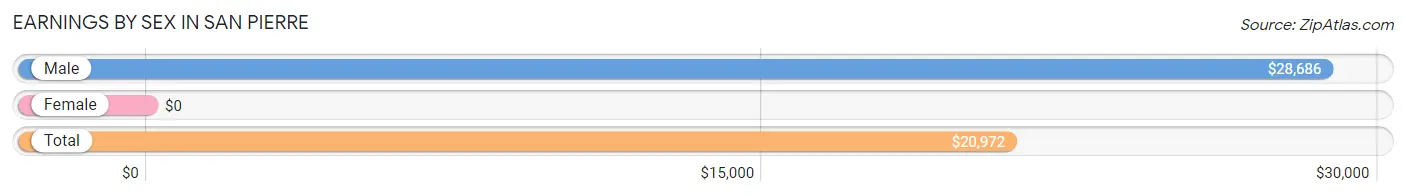
| Sex | Number | Average Earnings |
| Male | 133 (54.3%) | $28,686 |
| Female | 112 (45.7%) | $0 |
| Total | 245 (100.0%) | $20,972 |
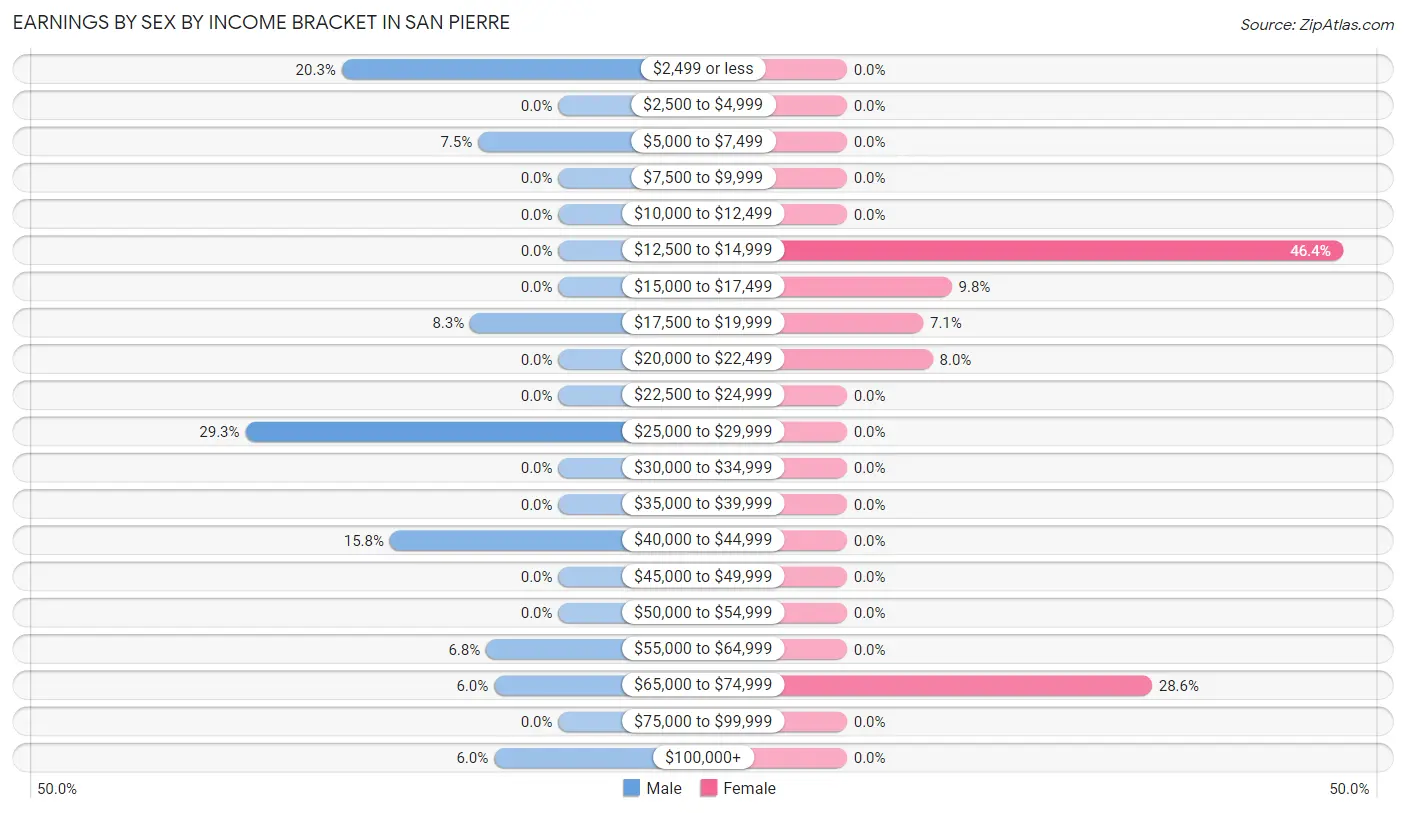
Earnings by Sex by Income Bracket in San Pierre
The most common earnings brackets in San Pierre are $25,000 to $29,999 for men (39 | 29.3%) and $12,500 to $14,999 for women (52 | 46.4%).
| Income | Male | Female |
| $2,499 or less | 27 (20.3%) | 0 (0.0%) |
| $2,500 to $4,999 | 0 (0.0%) | 0 (0.0%) |
| $5,000 to $7,499 | 10 (7.5%) | 0 (0.0%) |
| $7,500 to $9,999 | 0 (0.0%) | 0 (0.0%) |
| $10,000 to $12,499 | 0 (0.0%) | 0 (0.0%) |
| $12,500 to $14,999 | 0 (0.0%) | 52 (46.4%) |
| $15,000 to $17,499 | 0 (0.0%) | 11 (9.8%) |
| $17,500 to $19,999 | 11 (8.3%) | 8 (7.1%) |
| $20,000 to $22,499 | 0 (0.0%) | 9 (8.0%) |
| $22,500 to $24,999 | 0 (0.0%) | 0 (0.0%) |
| $25,000 to $29,999 | 39 (29.3%) | 0 (0.0%) |
| $30,000 to $34,999 | 0 (0.0%) | 0 (0.0%) |
| $35,000 to $39,999 | 0 (0.0%) | 0 (0.0%) |
| $40,000 to $44,999 | 21 (15.8%) | 0 (0.0%) |
| $45,000 to $49,999 | 0 (0.0%) | 0 (0.0%) |
| $50,000 to $54,999 | 0 (0.0%) | 0 (0.0%) |
| $55,000 to $64,999 | 9 (6.8%) | 0 (0.0%) |
| $65,000 to $74,999 | 8 (6.0%) | 32 (28.6%) |
| $75,000 to $99,999 | 0 (0.0%) | 0 (0.0%) |
| $100,000+ | 8 (6.0%) | 0 (0.0%) |
| Total | 133 (100.0%) | 112 (100.0%) |
Earnings by Sex by Educational Attainment in San Pierre
| Educational Attainment | Male Income | Female Income |
| Less than High School | - | - |
| High School Diploma | - | - |
| College or Associate's Degree | - | - |
| Bachelor's Degree | - | - |
| Graduate Degree | - | - |
| Total | $41,607 | $0 |
Family Income in San Pierre
Family Income Brackets in San Pierre
According to the San Pierre family income data, there are 21 families falling into the $150,000 to $199,999 income range, which is the most common income bracket and makes up 40.4% of all families.
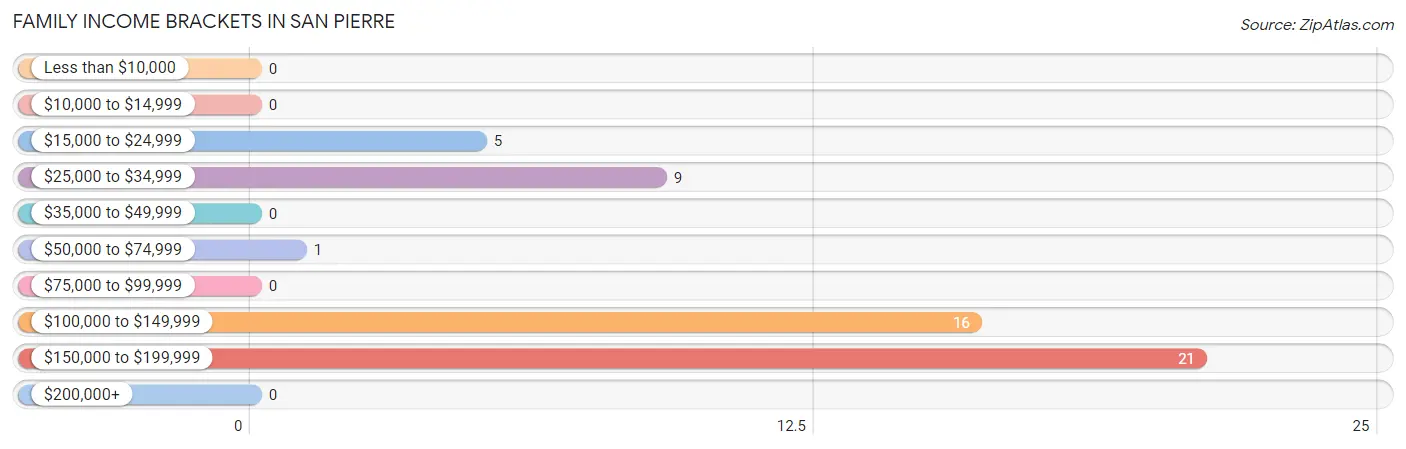
| Income Bracket | # Families | % Families |
| Less than $10,000 | 0 | 0.0% |
| $10,000 to $14,999 | 0 | 0.0% |
| $15,000 to $24,999 | 5 | 9.6% |
| $25,000 to $34,999 | 9 | 17.3% |
| $35,000 to $49,999 | 0 | 0.0% |
| $50,000 to $74,999 | 1 | 1.9% |
| $75,000 to $99,999 | 0 | 0.0% |
| $100,000 to $149,999 | 16 | 30.8% |
| $150,000 to $199,999 | 21 | 40.4% |
| $200,000+ | 0 | 0.0% |
Family Income by Famaliy Size in San Pierre
| Income Bracket | # Families | Median Income |
| 2-Person Families | 6 (11.5%) | $0 |
| 3-Person Families | 0 (0.0%) | $0 |
| 4-Person Families | 17 (32.7%) | $0 |
| 5-Person Families | 8 (15.4%) | $0 |
| 6-Person Families | 0 (0.0%) | $0 |
| 7+ Person Families | 21 (40.4%) | $0 |
| Total | 52 (100.0%) | $133,438 |
Family Income by Number of Earners in San Pierre
| Number of Earners | # Families | Median Income |
| No Earners | 6 (11.5%) | $0 |
| 1 Earner | 0 (0.0%) | $0 |
| 2 Earners | 17 (32.7%) | $0 |
| 3+ Earners | 29 (55.8%) | $0 |
| Total | 52 (100.0%) | $133,438 |
Household Income in San Pierre
Household Income Brackets in San Pierre
With 27 households falling in the category, the $35,000 to $49,999 income range is the most frequent in San Pierre, accounting for 26.2% of all households.
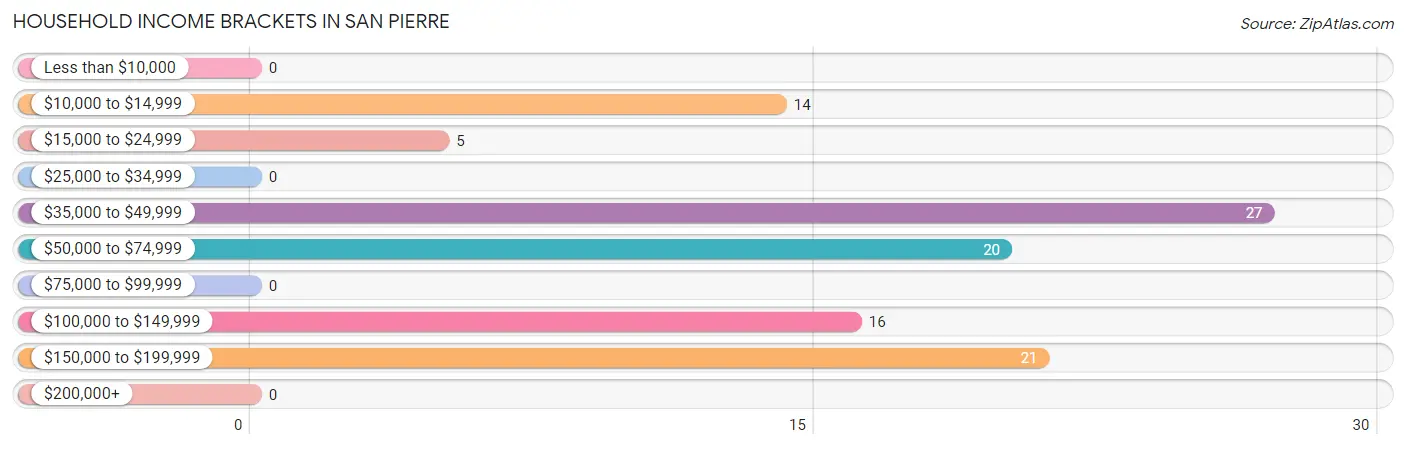
| Income Bracket | # Households | % Households |
| Less than $10,000 | 0 | 0.0% |
| $10,000 to $14,999 | 14 | 13.6% |
| $15,000 to $24,999 | 5 | 4.9% |
| $25,000 to $34,999 | 0 | 0.0% |
| $35,000 to $49,999 | 27 | 26.2% |
| $50,000 to $74,999 | 20 | 19.4% |
| $75,000 to $99,999 | 0 | 0.0% |
| $100,000 to $149,999 | 16 | 15.5% |
| $150,000 to $199,999 | 21 | 20.4% |
| $200,000+ | 0 | 0.0% |
Household Income by Householder Age in San Pierre
The median household income in San Pierre is $61,250, with the highest median household income of $49,444 found in the 45 to 64 years age bracket for the primary householder. A total of 42 households (40.8%) fall into this category. Meanwhile, the 15 to 24 years age bracket for the primary householder has the lowest median household income of $0, with 8 households (7.8%) in this group.
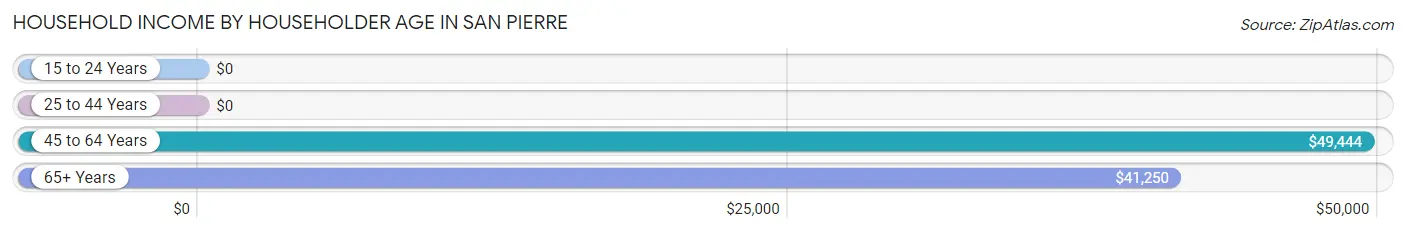
| Income Bracket | # Households | Median Income |
| 15 to 24 Years | 8 (7.8%) | $0 |
| 25 to 44 Years | 29 (28.2%) | $0 |
| 45 to 64 Years | 42 (40.8%) | $49,444 |
| 65+ Years | 24 (23.3%) | $41,250 |
| Total | 103 (100.0%) | $61,250 |
Poverty in San Pierre
Income Below Poverty by Sex and Age in San Pierre
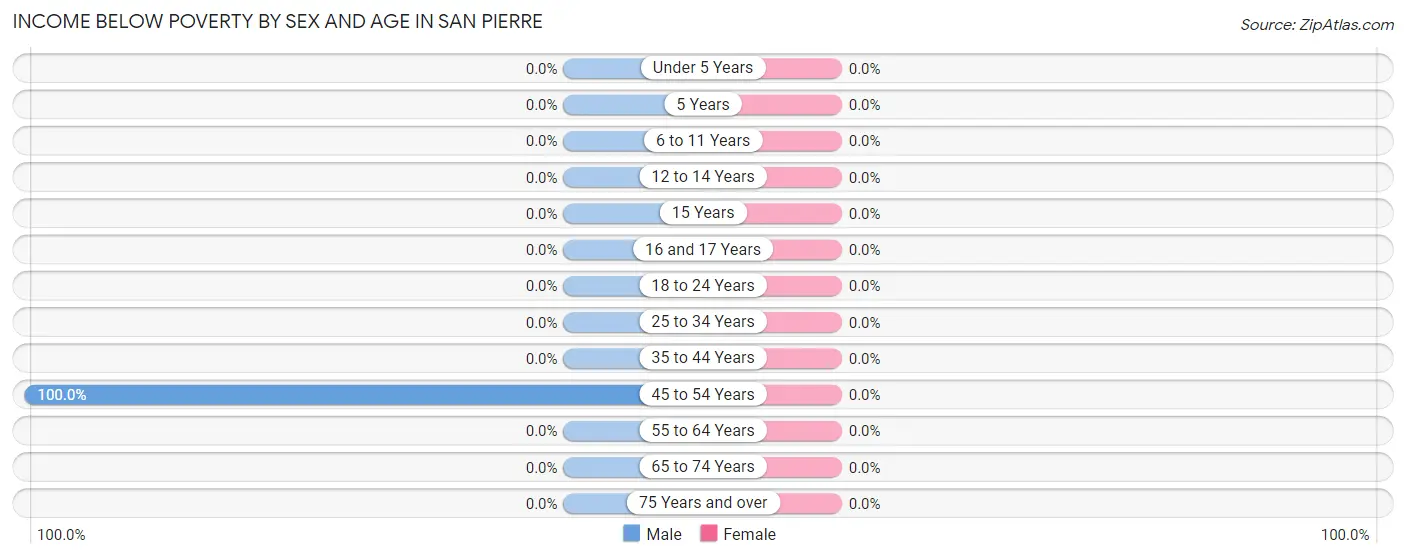
| Age Bracket | Male | Female |
| Under 5 Years | 0 (0.0%) | 0 (0.0%) |
| 5 Years | 0 (0.0%) | 0 (0.0%) |
| 6 to 11 Years | 0 (0.0%) | 0 (0.0%) |
| 12 to 14 Years | 0 (0.0%) | 0 (0.0%) |
| 15 Years | 0 (0.0%) | 0 (0.0%) |
| 16 and 17 Years | 0 (0.0%) | 0 (0.0%) |
| 18 to 24 Years | 0 (0.0%) | 0 (0.0%) |
| 25 to 34 Years | 0 (0.0%) | 0 (0.0%) |
| 35 to 44 Years | 0 (0.0%) | 0 (0.0%) |
| 45 to 54 Years | 14 (100.0%) | 0 (0.0%) |
| 55 to 64 Years | 0 (0.0%) | 0 (0.0%) |
| 65 to 74 Years | 0 (0.0%) | 0 (0.0%) |
| 75 Years and over | 0 (0.0%) | 0 (0.0%) |
| Total | 14 (5.6%) | 0 (0.0%) |
Income Above Poverty by Sex and Age in San Pierre
According to the poverty statistics in San Pierre, males aged under 5 years and females aged under 5 years are the age groups that are most secure financially, with 100.0% of males and 100.0% of females in these age groups living above the poverty line.
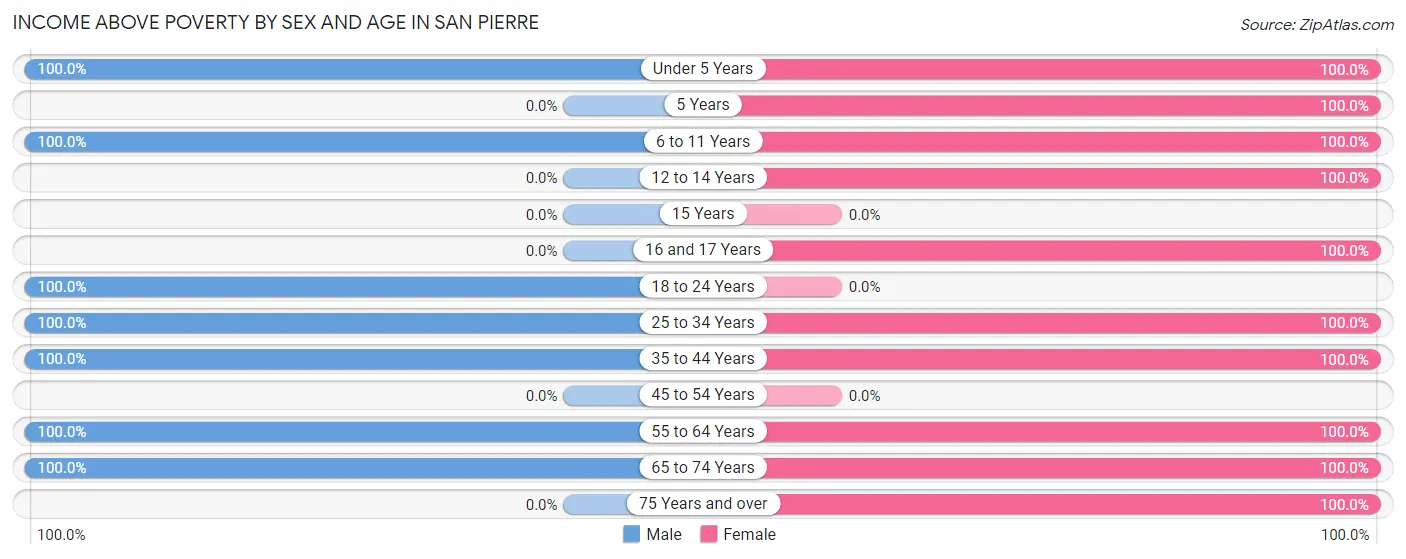
| Age Bracket | Male | Female |
| Under 5 Years | 26 (100.0%) | 6 (100.0%) |
| 5 Years | 0 (0.0%) | 13 (100.0%) |
| 6 to 11 Years | 46 (100.0%) | 13 (100.0%) |
| 12 to 14 Years | 0 (0.0%) | 19 (100.0%) |
| 15 Years | 0 (0.0%) | 0 (0.0%) |
| 16 and 17 Years | 0 (0.0%) | 13 (100.0%) |
| 18 to 24 Years | 84 (100.0%) | 0 (0.0%) |
| 25 to 34 Years | 8 (100.0%) | 52 (100.0%) |
| 35 to 44 Years | 21 (100.0%) | 43 (100.0%) |
| 45 to 54 Years | 0 (0.0%) | 0 (0.0%) |
| 55 to 64 Years | 20 (100.0%) | 17 (100.0%) |
| 65 to 74 Years | 30 (100.0%) | 5 (100.0%) |
| 75 Years and over | 0 (0.0%) | 6 (100.0%) |
| Total | 235 (94.4%) | 187 (100.0%) |
Income Below Poverty Among Married-Couple Families in San Pierre
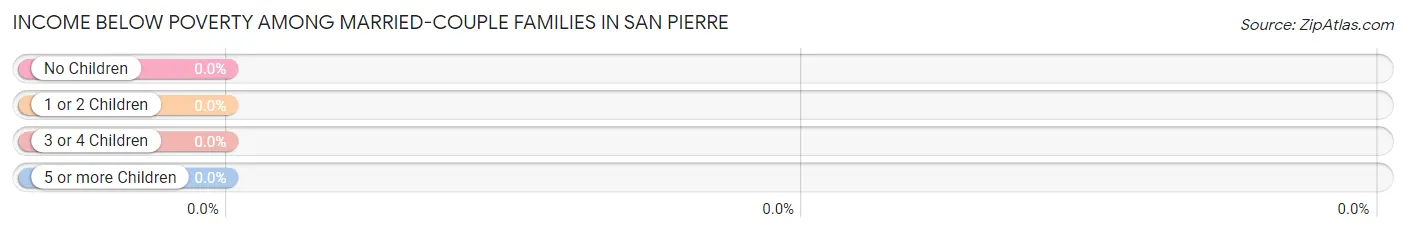
| Children | Above Poverty | Below Poverty |
| No Children | 6 (100.0%) | 0 (0.0%) |
| 1 or 2 Children | 8 (100.0%) | 0 (0.0%) |
| 3 or 4 Children | 29 (100.0%) | 0 (0.0%) |
| 5 or more Children | 0 (0.0%) | 0 (0.0%) |
| Total | 43 (100.0%) | 0 (0.0%) |
Income Below Poverty Among Single-Parent Households in San Pierre
| Children | Single Father | Single Mother |
| No Children | 0 (0.0%) | 0 (0.0%) |
| 1 or 2 Children | 0 (0.0%) | 0 (0.0%) |
| 3 or 4 Children | 0 (0.0%) | 0 (0.0%) |
| 5 or more Children | 0 (0.0%) | 0 (0.0%) |
| Total | 0 (0.0%) | 0 (0.0%) |
Income Below Poverty Among Married-Couple vs Single-Parent Households in San Pierre
| Children | Married-Couple Families | Single-Parent Households |
| No Children | 0 (0.0%) | 0 (0.0%) |
| 1 or 2 Children | 0 (0.0%) | 0 (0.0%) |
| 3 or 4 Children | 0 (0.0%) | 0 (0.0%) |
| 5 or more Children | 0 (0.0%) | 0 (0.0%) |
| Total | 0 (0.0%) | 0 (0.0%) |
Race in San Pierre
The most populous races in San Pierre are White / Caucasian (345 | 79.1%), Two or more Races (91 | 20.9%), and Hispanic or Latino (14 | 3.2%).
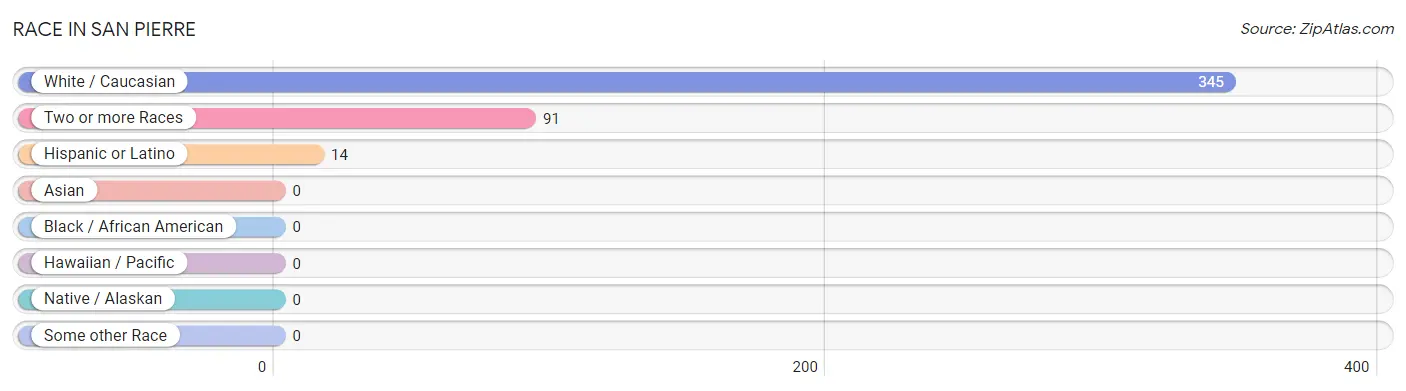
| Race | # Population | % Population |
| Asian | 0 | 0.0% |
| Black / African American | 0 | 0.0% |
| Hawaiian / Pacific | 0 | 0.0% |
| Hispanic or Latino | 14 | 3.2% |
| Native / Alaskan | 0 | 0.0% |
| White / Caucasian | 345 | 79.1% |
| Two or more Races | 91 | 20.9% |
| Some other Race | 0 | 0.0% |
| Total | 436 | 100.0% |
Ancestry in San Pierre
The most populous ancestries reported in San Pierre are German (128 | 29.4%), Dutch (119 | 27.3%), Welsh (91 | 20.9%), Irish (53 | 12.2%), and English (40 | 9.2%), together accounting for 98.9% of all San Pierre residents.
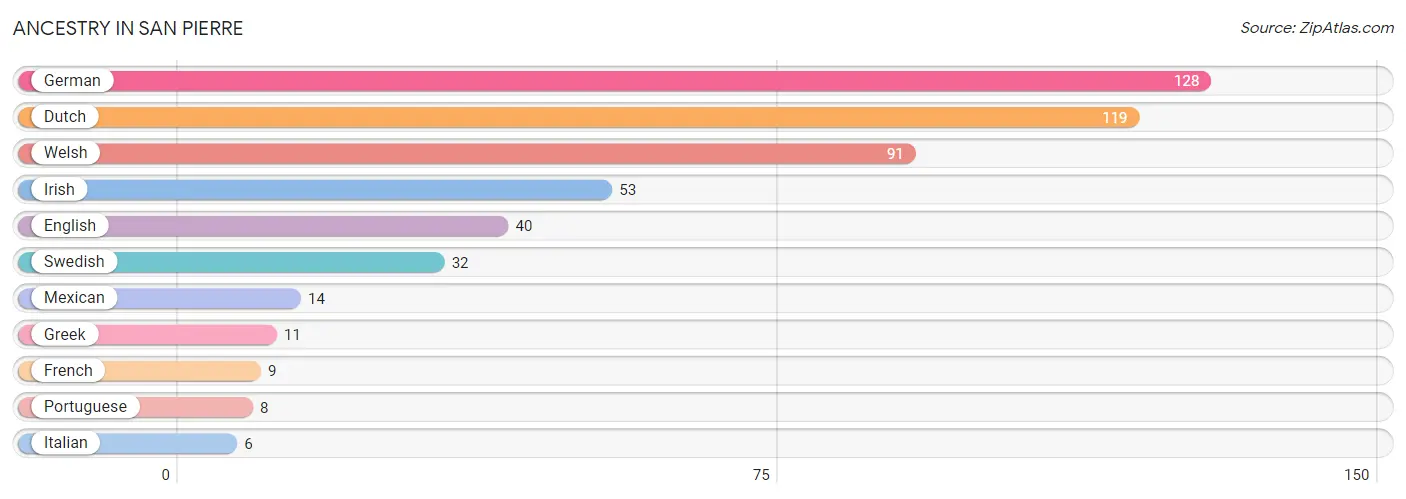
| Ancestry | # Population | % Population |
| Dutch | 119 | 27.3% |
| English | 40 | 9.2% |
| French | 9 | 2.1% |
| German | 128 | 29.4% |
| Greek | 11 | 2.5% |
| Irish | 53 | 12.2% |
| Italian | 6 | 1.4% |
| Mexican | 14 | 3.2% |
| Portuguese | 8 | 1.8% |
| Swedish | 32 | 7.3% |
| Welsh | 91 | 20.9% | View All 11 Rows |
Immigrants in San Pierre

| Immigration Origin | # Population | % Population | View All 0 Rows |
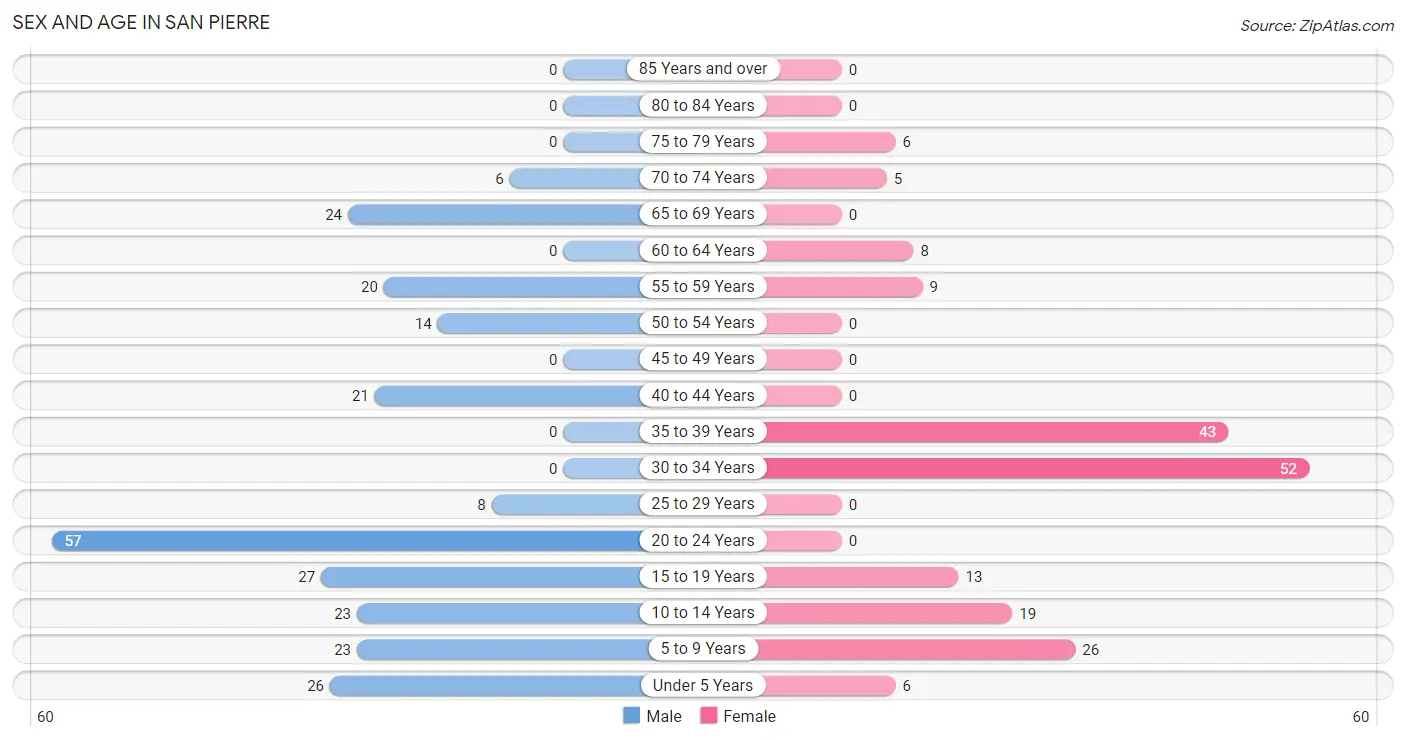
Sex and Age in San Pierre
Sex and Age in San Pierre
The most populous age groups in San Pierre are 20 to 24 Years (57 | 22.9%) for men and 30 to 34 Years (52 | 27.8%) for women.
| Age Bracket | Male | Female |
| Under 5 Years | 26 (10.4%) | 6 (3.2%) |
| 5 to 9 Years | 23 (9.2%) | 26 (13.9%) |
| 10 to 14 Years | 23 (9.2%) | 19 (10.2%) |
| 15 to 19 Years | 27 (10.8%) | 13 (7.0%) |
| 20 to 24 Years | 57 (22.9%) | 0 (0.0%) |
| 25 to 29 Years | 8 (3.2%) | 0 (0.0%) |
| 30 to 34 Years | 0 (0.0%) | 52 (27.8%) |
| 35 to 39 Years | 0 (0.0%) | 43 (23.0%) |
| 40 to 44 Years | 21 (8.4%) | 0 (0.0%) |
| 45 to 49 Years | 0 (0.0%) | 0 (0.0%) |
| 50 to 54 Years | 14 (5.6%) | 0 (0.0%) |
| 55 to 59 Years | 20 (8.0%) | 9 (4.8%) |
| 60 to 64 Years | 0 (0.0%) | 8 (4.3%) |
| 65 to 69 Years | 24 (9.6%) | 0 (0.0%) |
| 70 to 74 Years | 6 (2.4%) | 5 (2.7%) |
| 75 to 79 Years | 0 (0.0%) | 6 (3.2%) |
| 80 to 84 Years | 0 (0.0%) | 0 (0.0%) |
| 85 Years and over | 0 (0.0%) | 0 (0.0%) |
| Total | 249 (100.0%) | 187 (100.0%) |
Families and Households in San Pierre
Median Family Size in San Pierre
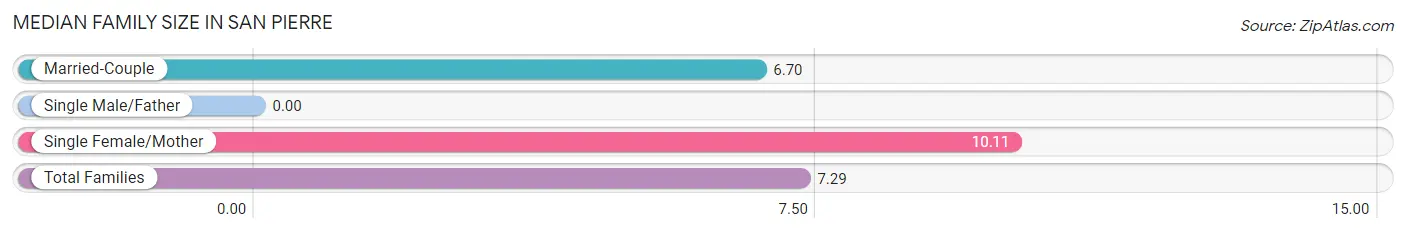
| Family Type | # Families | Family Size |
| Married-Couple | 43 (82.7%) | 6.70 |
| Single Male/Father | 0 (0.0%) | - |
| Single Female/Mother | 9 (17.3%) | 10.11 |
| Total Families | 52 (100.0%) | 7.29 |
Median Household Size in San Pierre
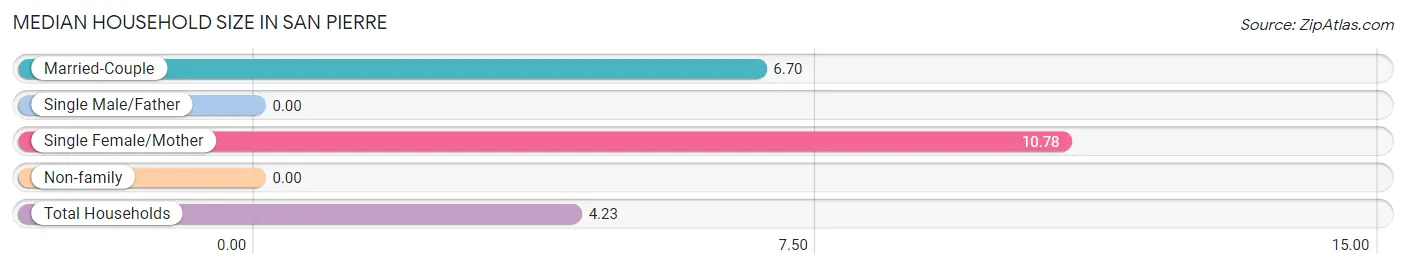
| Household Type | # Households | Household Size |
| Married-Couple | 43 (41.7%) | 6.70 |
| Single Male/Father | 0 (0.0%) | - |
| Single Female/Mother | 9 (8.7%) | 10.78 |
| Non-family | 51 (49.5%) | - |
| Total Households | 103 (100.0%) | 4.23 |
Household Size by Marriage Status in San Pierre
Out of a total of 103 households in San Pierre, 52 (50.5%) are family households, while 51 (49.5%) are nonfamily households. The most numerous type of family households are 7+ person households, comprising 21, and the most common type of nonfamily households are 1-person households, comprising 51.
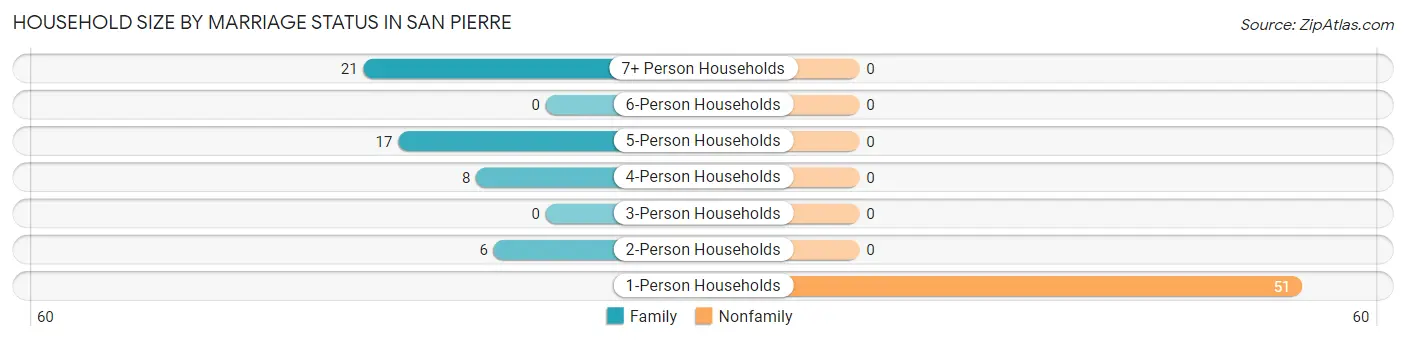
| Household Size | Family Households | Nonfamily Households |
| 1-Person Households | - | 51 (49.5%) |
| 2-Person Households | 6 (5.8%) | 0 (0.0%) |
| 3-Person Households | 0 (0.0%) | 0 (0.0%) |
| 4-Person Households | 8 (7.8%) | 0 (0.0%) |
| 5-Person Households | 17 (16.5%) | 0 (0.0%) |
| 6-Person Households | 0 (0.0%) | 0 (0.0%) |
| 7+ Person Households | 21 (20.4%) | 0 (0.0%) |
| Total | 52 (50.5%) | 51 (49.5%) |
Female Fertility in San Pierre
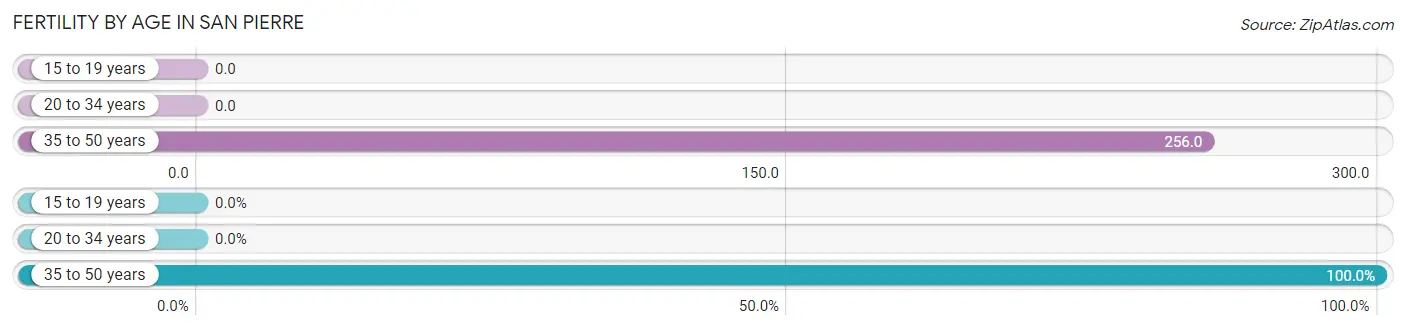
Fertility by Age in San Pierre
Average fertility rate in San Pierre is 102.0 births per 1,000 women. Women in the age bracket of 35 to 50 years have the highest fertility rate with 256.0 births per 1,000 women. Women in the age bracket of 35 to 50 years acount for 100.0% of all women with births.
| Age Bracket | Women with Births | Births / 1,000 Women |
| 15 to 19 years | 0 (0.0%) | 0.0 |
| 20 to 34 years | 0 (0.0%) | 0.0 |
| 35 to 50 years | 11 (100.0%) | 256.0 |
| Total | 11 (100.0%) | 102.0 |
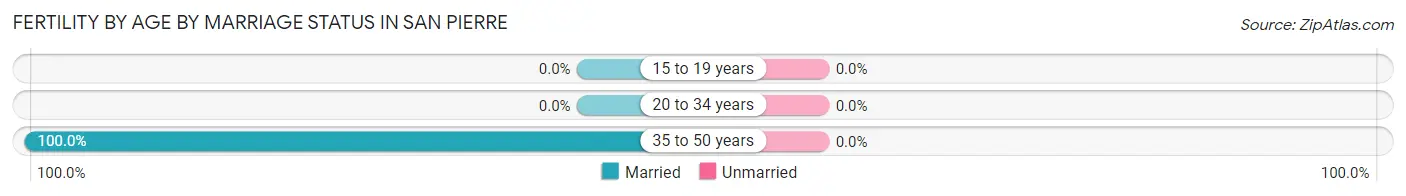
Fertility by Age by Marriage Status in San Pierre
| Age Bracket | Married | Unmarried |
| 15 to 19 years | 0 (0.0%) | 0 (0.0%) |
| 20 to 34 years | 0 (0.0%) | 0 (0.0%) |
| 35 to 50 years | 11 (100.0%) | 0 (0.0%) |
| Total | 11 (100.0%) | 0 (0.0%) |
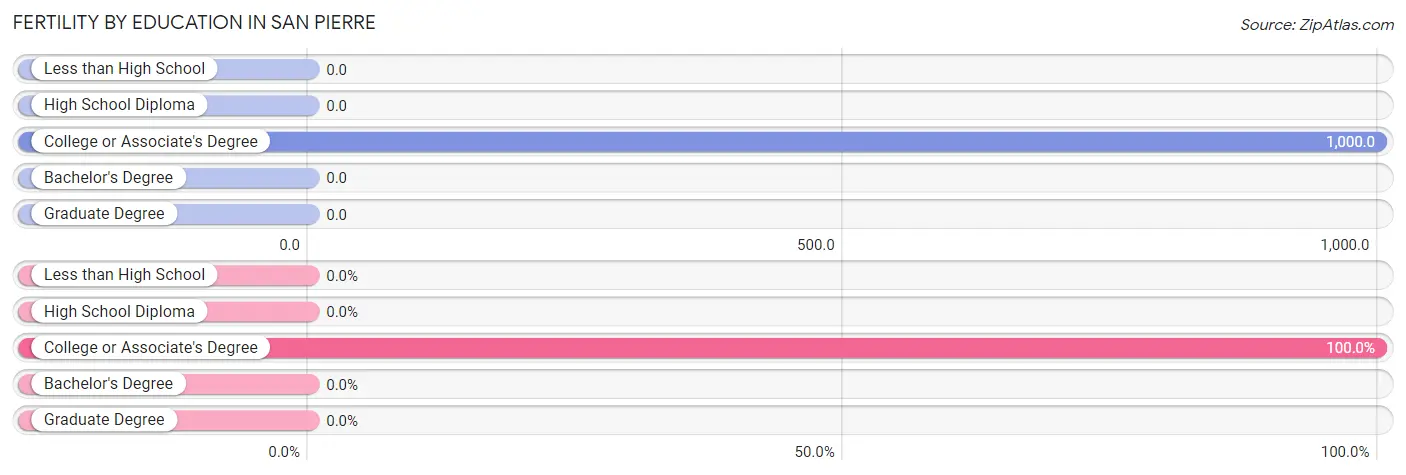
Fertility by Education in San Pierre
| Educational Attainment | Women with Births | Births / 1,000 Women |
| Less than High School | 0 (0.0%) | 0.0 |
| High School Diploma | 0 (0.0%) | 0.0 |
| College or Associate's Degree | 11 (100.0%) | 1,000.0 |
| Bachelor's Degree | 0 (0.0%) | 0.0 |
| Graduate Degree | 0 (0.0%) | 0.0 |
| Total | 11 (100.0%) | 102.0 |
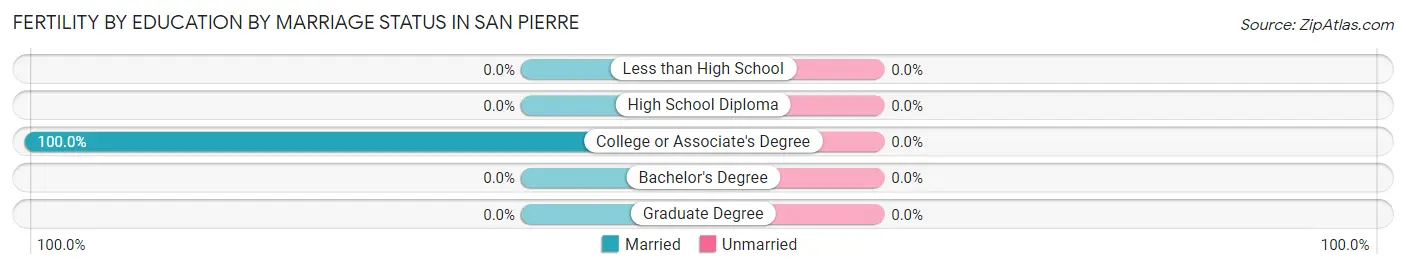
Fertility by Education by Marriage Status in San Pierre
| Educational Attainment | Married | Unmarried |
| Less than High School | 0 (0.0%) | 0 (0.0%) |
| High School Diploma | 0 (0.0%) | 0 (0.0%) |
| College or Associate's Degree | 11 (100.0%) | 0 (0.0%) |
| Bachelor's Degree | 0 (0.0%) | 0 (0.0%) |
| Graduate Degree | 0 (0.0%) | 0 (0.0%) |
| Total | 11 (100.0%) | 0 (0.0%) |
Employment Characteristics in San Pierre
Employment by Class of Employer in San Pierre
Among the 234 employed individuals in San Pierre, private company employees (194 | 82.9%), and not-for-profit organizations (40 | 17.1%) make up the most common classes of employment.
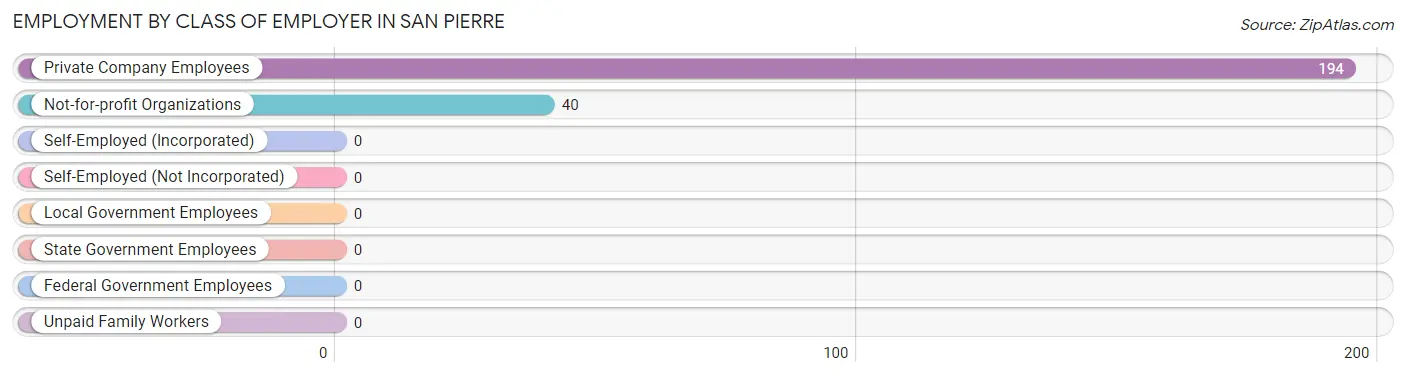
| Employer Class | # Employees | % Employees |
| Private Company Employees | 194 | 82.9% |
| Self-Employed (Incorporated) | 0 | 0.0% |
| Self-Employed (Not Incorporated) | 0 | 0.0% |
| Not-for-profit Organizations | 40 | 17.1% |
| Local Government Employees | 0 | 0.0% |
| State Government Employees | 0 | 0.0% |
| Federal Government Employees | 0 | 0.0% |
| Unpaid Family Workers | 0 | 0.0% |
| Total | 234 | 100.0% |
Employment Status by Age in San Pierre
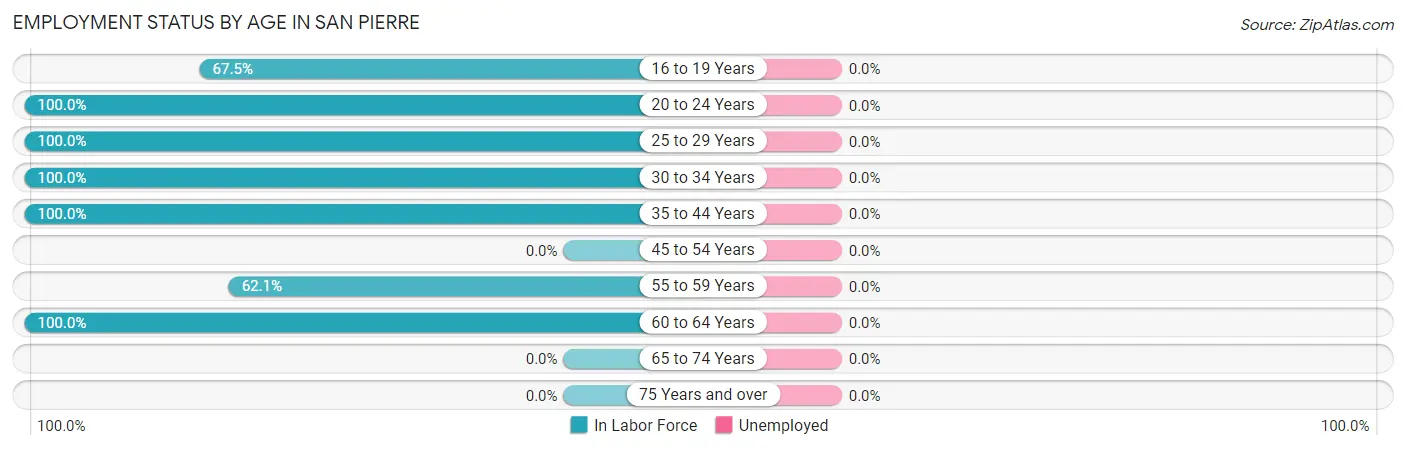
| Age Bracket | In Labor Force | Unemployed |
| 16 to 19 Years | 27 (67.5%) | 0 (0.0%) |
| 20 to 24 Years | 57 (100.0%) | 0 (0.0%) |
| 25 to 29 Years | 8 (100.0%) | 0 (0.0%) |
| 30 to 34 Years | 52 (100.0%) | 0 (0.0%) |
| 35 to 44 Years | 64 (100.0%) | 0 (0.0%) |
| 45 to 54 Years | 0 (0.0%) | 0 (0.0%) |
| 55 to 59 Years | 18 (62.1%) | 0 (0.0%) |
| 60 to 64 Years | 8 (100.0%) | 0 (0.0%) |
| 65 to 74 Years | 0 (0.0%) | 0 (0.0%) |
| 75 Years and over | 0 (0.0%) | 0 (0.0%) |
| Total | 234 (74.8%) | 0 (0.0%) |
Employment Status by Educational Attainment in San Pierre
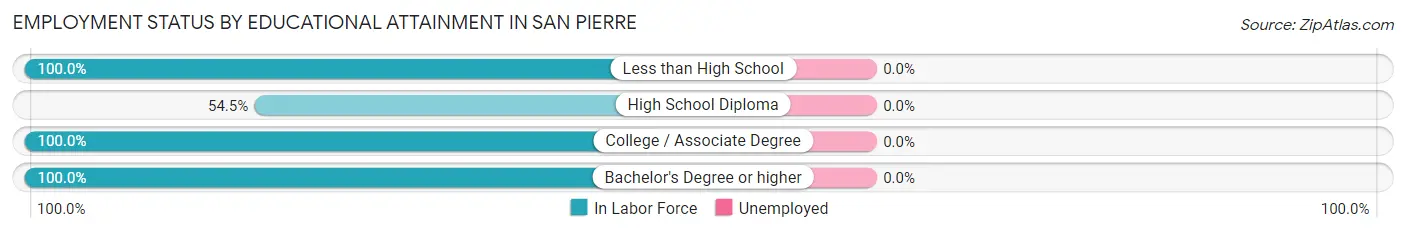
| Educational Attainment | In Labor Force | Unemployed |
| Less than High School | 52 (100.0%) | 0 (0.0%) |
| High School Diploma | 30 (54.5%) | 0 (0.0%) |
| College / Associate Degree | 36 (100.0%) | 0 (0.0%) |
| Bachelor's Degree or higher | 32 (100.0%) | 0 (0.0%) |
| Total | 150 (85.7%) | 0 (0.0%) |
Employment Occupations by Sex in San Pierre
Management, Business, Science and Arts Occupations
The most common Management, Business, Science and Arts occupations in San Pierre are Business & Financial (32 | 13.7%), Health Diagnosing & Treating (19 | 8.1%), Health Technologists (19 | 8.1%), Computers, Engineering & Science (8 | 3.4%), and Architecture & Engineering (8 | 3.4%).
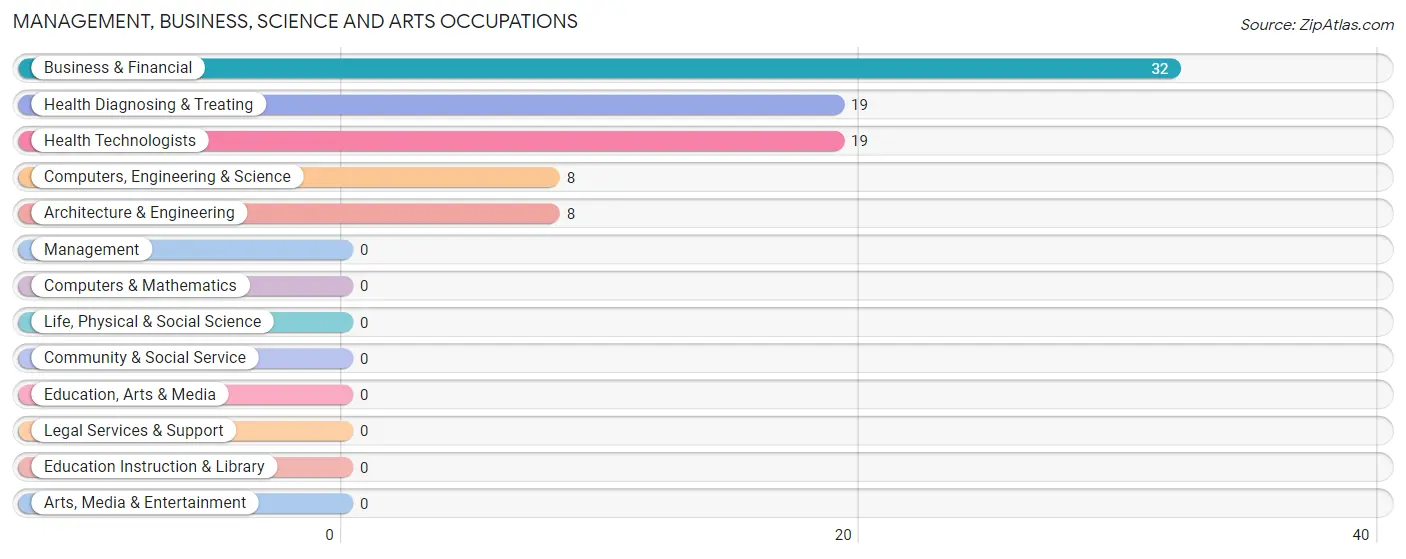
Management, Business, Science and Arts Occupations by Sex
Within the Management, Business, Science and Arts occupations in San Pierre, the most male-oriented occupations are Computers, Engineering & Science (100.0%), and Architecture & Engineering (100.0%), while the most female-oriented occupations are Business & Financial (100.0%), Health Diagnosing & Treating (100.0%), and Health Technologists (100.0%).
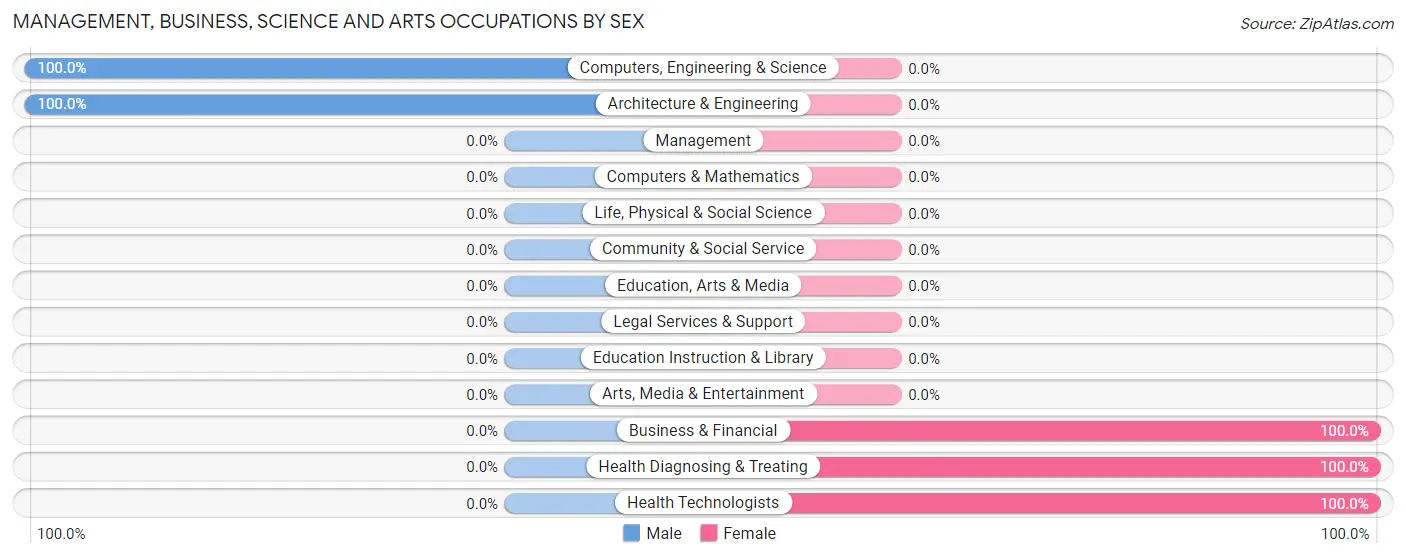
| Occupation | Male | Female |
| Management | 0 (0.0%) | 0 (0.0%) |
| Business & Financial | 0 (0.0%) | 32 (100.0%) |
| Computers, Engineering & Science | 8 (100.0%) | 0 (0.0%) |
| Computers & Mathematics | 0 (0.0%) | 0 (0.0%) |
| Architecture & Engineering | 8 (100.0%) | 0 (0.0%) |
| Life, Physical & Social Science | 0 (0.0%) | 0 (0.0%) |
| Community & Social Service | 0 (0.0%) | 0 (0.0%) |
| Education, Arts & Media | 0 (0.0%) | 0 (0.0%) |
| Legal Services & Support | 0 (0.0%) | 0 (0.0%) |
| Education Instruction & Library | 0 (0.0%) | 0 (0.0%) |
| Arts, Media & Entertainment | 0 (0.0%) | 0 (0.0%) |
| Health Diagnosing & Treating | 0 (0.0%) | 19 (100.0%) |
| Health Technologists | 0 (0.0%) | 19 (100.0%) |
| Total (Category) | 8 (13.6%) | 51 (86.4%) |
| Total (Overall) | 122 (52.1%) | 112 (47.9%) |
Services Occupations
The most common Services occupations in San Pierre are , and Food Preparation & Serving (61 | 26.1%).
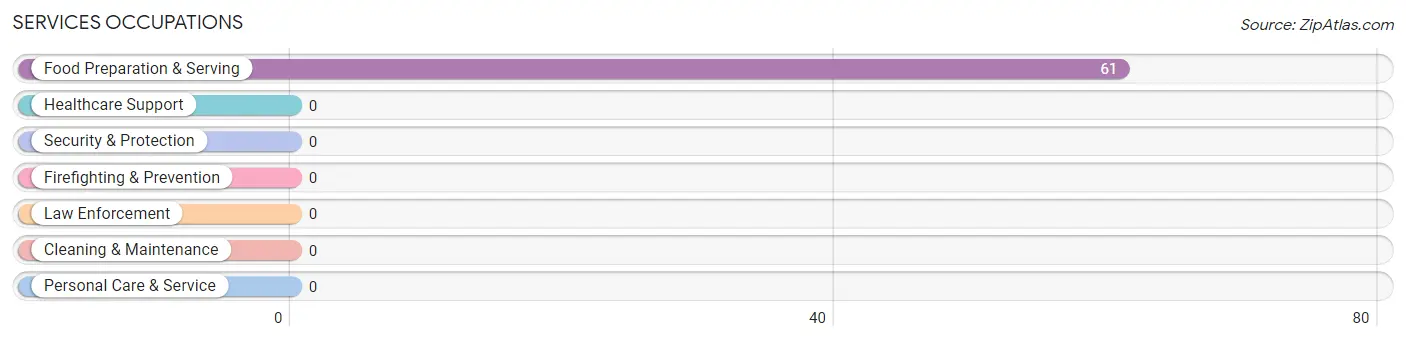
Services Occupations by Sex
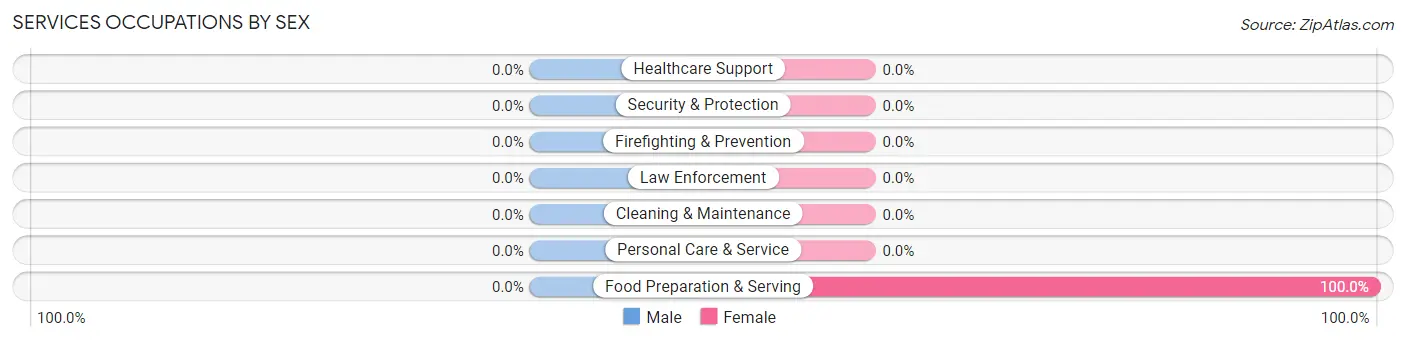
| Occupation | Male | Female |
| Healthcare Support | 0 (0.0%) | 0 (0.0%) |
| Security & Protection | 0 (0.0%) | 0 (0.0%) |
| Firefighting & Prevention | 0 (0.0%) | 0 (0.0%) |
| Law Enforcement | 0 (0.0%) | 0 (0.0%) |
| Food Preparation & Serving | 0 (0.0%) | 61 (100.0%) |
| Cleaning & Maintenance | 0 (0.0%) | 0 (0.0%) |
| Personal Care & Service | 0 (0.0%) | 0 (0.0%) |
| Total (Category) | 0 (0.0%) | 61 (100.0%) |
| Total (Overall) | 122 (52.1%) | 112 (47.9%) |
Sales and Office Occupations
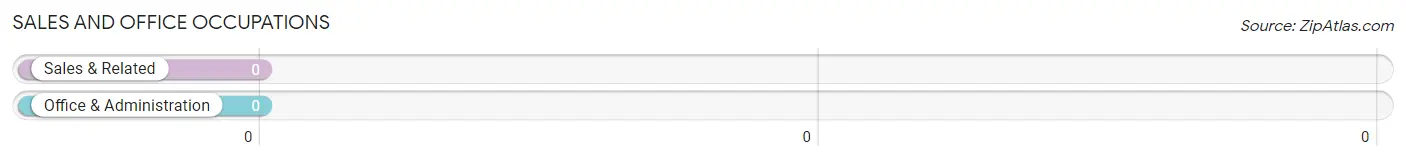
Sales and Office Occupations by Sex
| Occupation | Male | Female |
| Sales & Related | 0 (0.0%) | 0 (0.0%) |
| Office & Administration | 0 (0.0%) | 0 (0.0%) |
| Total (Category) | 0 (0.0%) | 0 (0.0%) |
| Total (Overall) | 122 (52.1%) | 112 (47.9%) |
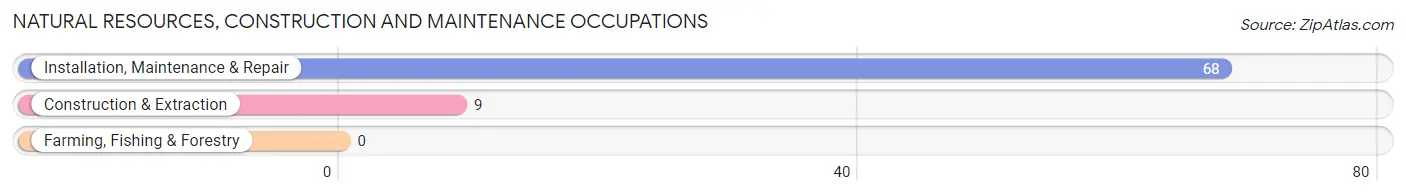
Natural Resources, Construction and Maintenance Occupations
The most common Natural Resources, Construction and Maintenance occupations in San Pierre are Installation, Maintenance & Repair (68 | 29.1%), and Construction & Extraction (9 | 3.8%).
Natural Resources, Construction and Maintenance Occupations by Sex
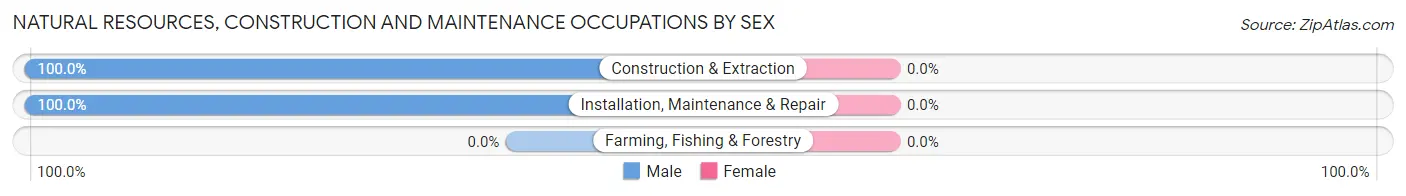
| Occupation | Male | Female |
| Farming, Fishing & Forestry | 0 (0.0%) | 0 (0.0%) |
| Construction & Extraction | 9 (100.0%) | 0 (0.0%) |
| Installation, Maintenance & Repair | 68 (100.0%) | 0 (0.0%) |
| Total (Category) | 77 (100.0%) | 0 (0.0%) |
| Total (Overall) | 122 (52.1%) | 112 (47.9%) |
Production, Transportation and Moving Occupations
The most common Production, Transportation and Moving occupations in San Pierre are , and Material Moving (37 | 15.8%).
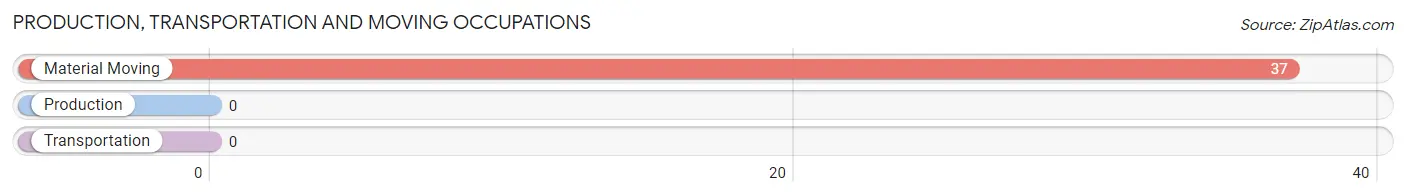
Production, Transportation and Moving Occupations by Sex
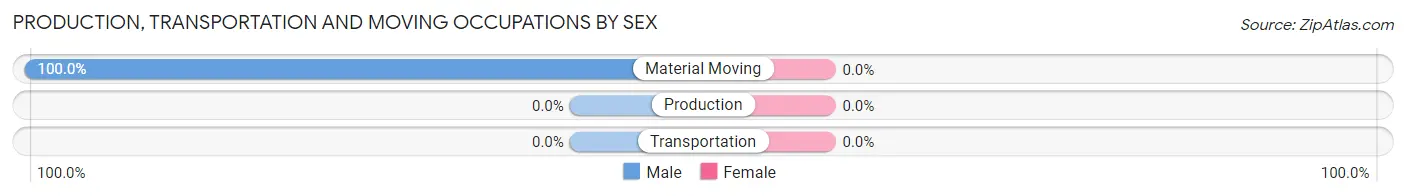
| Occupation | Male | Female |
| Production | 0 (0.0%) | 0 (0.0%) |
| Transportation | 0 (0.0%) | 0 (0.0%) |
| Material Moving | 37 (100.0%) | 0 (0.0%) |
| Total (Category) | 37 (100.0%) | 0 (0.0%) |
| Total (Overall) | 122 (52.1%) | 112 (47.9%) |
Employment Industries by Sex in San Pierre
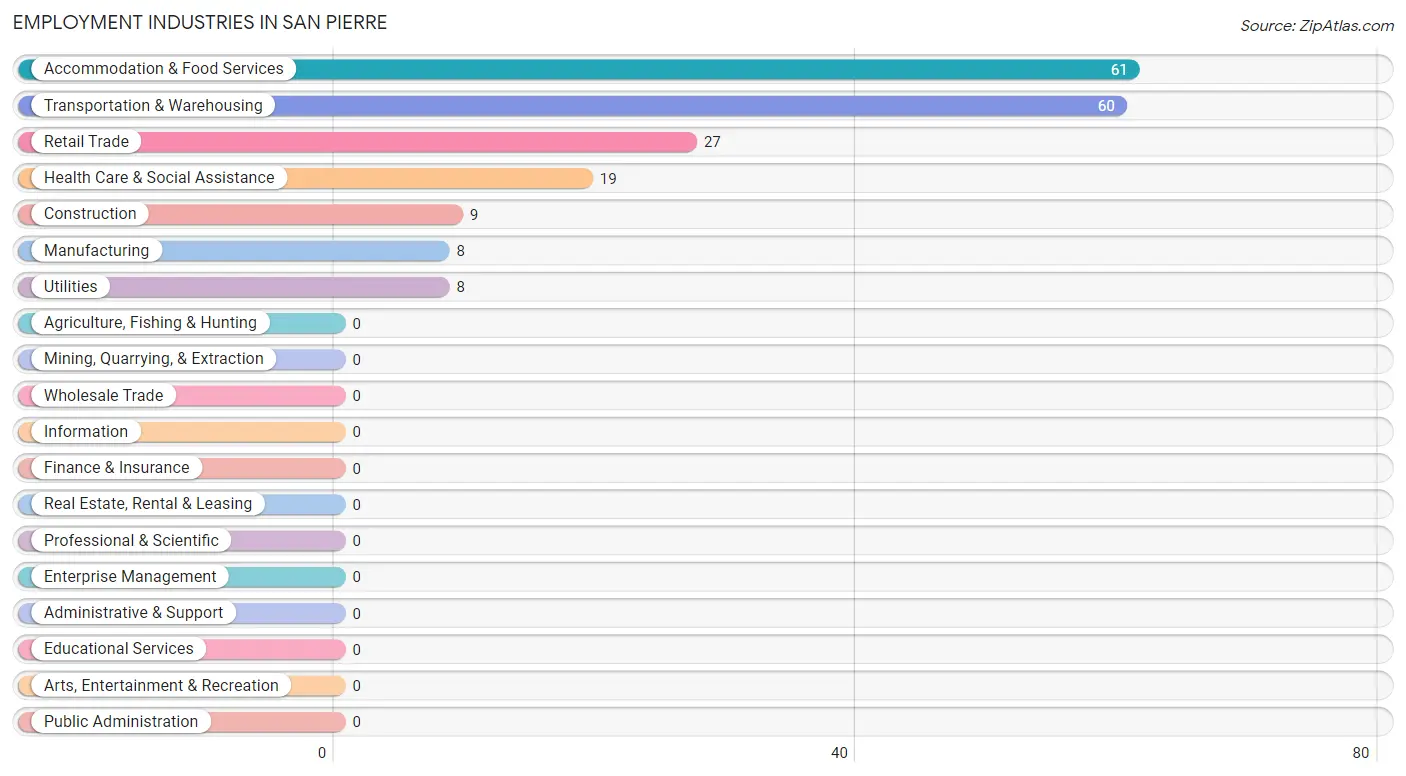
Employment Industries in San Pierre
The major employment industries in San Pierre include Accommodation & Food Services (61 | 26.1%), Transportation & Warehousing (60 | 25.6%), Retail Trade (27 | 11.5%), Health Care & Social Assistance (19 | 8.1%), and Construction (9 | 3.8%).
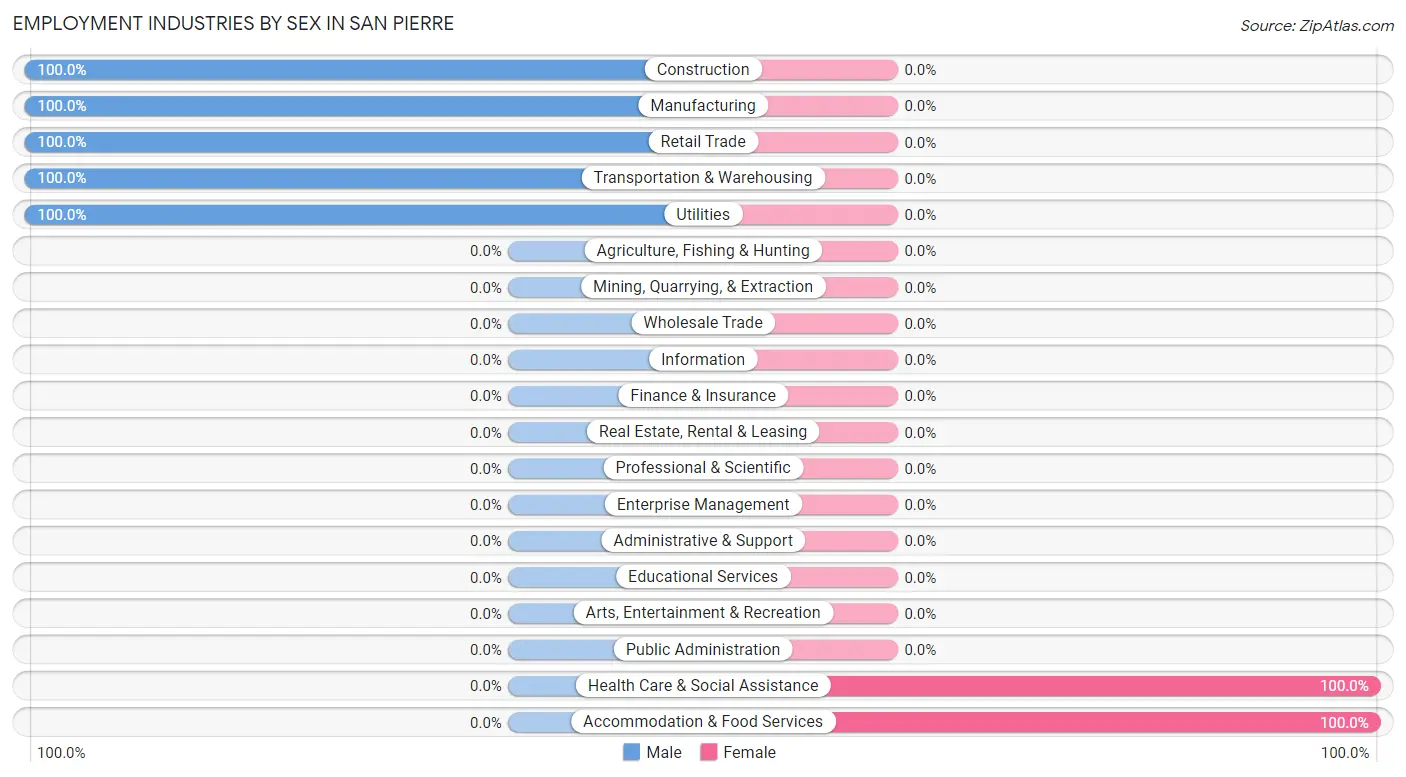
Employment Industries by Sex in San Pierre
The San Pierre industries that see more men than women are Construction (100.0%), Manufacturing (100.0%), and Retail Trade (100.0%), whereas the industries that tend to have a higher number of women are Health Care & Social Assistance (100.0%), and Accommodation & Food Services (100.0%).
| Industry | Male | Female |
| Agriculture, Fishing & Hunting | 0 (0.0%) | 0 (0.0%) |
| Mining, Quarrying, & Extraction | 0 (0.0%) | 0 (0.0%) |
| Construction | 9 (100.0%) | 0 (0.0%) |
| Manufacturing | 8 (100.0%) | 0 (0.0%) |
| Wholesale Trade | 0 (0.0%) | 0 (0.0%) |
| Retail Trade | 27 (100.0%) | 0 (0.0%) |
| Transportation & Warehousing | 60 (100.0%) | 0 (0.0%) |
| Utilities | 8 (100.0%) | 0 (0.0%) |
| Information | 0 (0.0%) | 0 (0.0%) |
| Finance & Insurance | 0 (0.0%) | 0 (0.0%) |
| Real Estate, Rental & Leasing | 0 (0.0%) | 0 (0.0%) |
| Professional & Scientific | 0 (0.0%) | 0 (0.0%) |
| Enterprise Management | 0 (0.0%) | 0 (0.0%) |
| Administrative & Support | 0 (0.0%) | 0 (0.0%) |
| Educational Services | 0 (0.0%) | 0 (0.0%) |
| Health Care & Social Assistance | 0 (0.0%) | 19 (100.0%) |
| Arts, Entertainment & Recreation | 0 (0.0%) | 0 (0.0%) |
| Accommodation & Food Services | 0 (0.0%) | 61 (100.0%) |
| Public Administration | 0 (0.0%) | 0 (0.0%) |
| Total | 122 (52.1%) | 112 (47.9%) |
Education in San Pierre
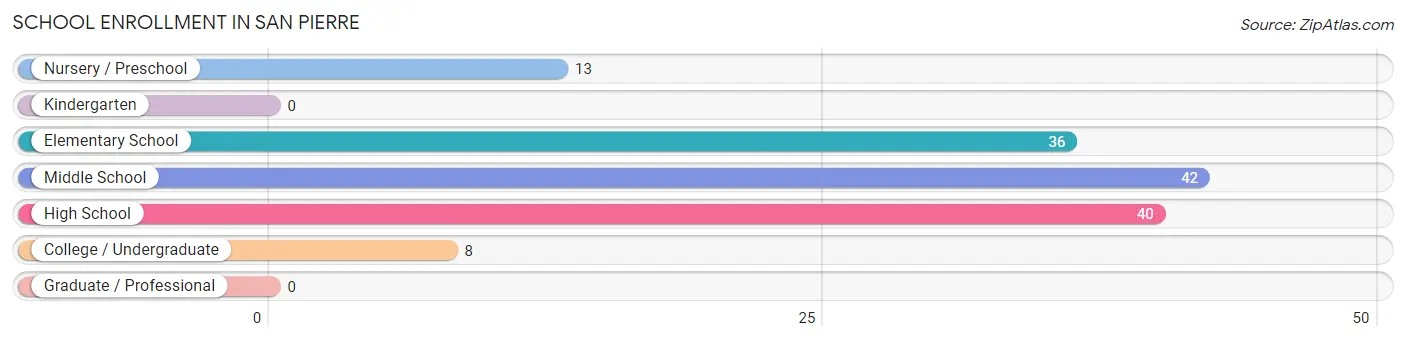
School Enrollment in San Pierre
The most common levels of schooling among the 139 students in San Pierre are middle school (42 | 30.2%), high school (40 | 28.8%), and elementary school (36 | 25.9%).
| School Level | # Students | % Students |
| Nursery / Preschool | 13 | 9.3% |
| Kindergarten | 0 | 0.0% |
| Elementary School | 36 | 25.9% |
| Middle School | 42 | 30.2% |
| High School | 40 | 28.8% |
| College / Undergraduate | 8 | 5.8% |
| Graduate / Professional | 0 | 0.0% |
| Total | 139 | 100.0% |
School Enrollment by Age by Funding Source in San Pierre
Out of a total of 139 students who are enrolled in schools in San Pierre, 23 (16.5%) attend a private institution, while the remaining 116 (83.5%) are enrolled in public schools. The age group of 5 to 9 year old has the highest likelihood of being enrolled in private schools, with 23 (46.9% in the age bracket) enrolled. Conversely, the age group of 10 to 14 year olds has the lowest likelihood of being enrolled in a private school, with 42 (100.0% in the age bracket) attending a public institution.
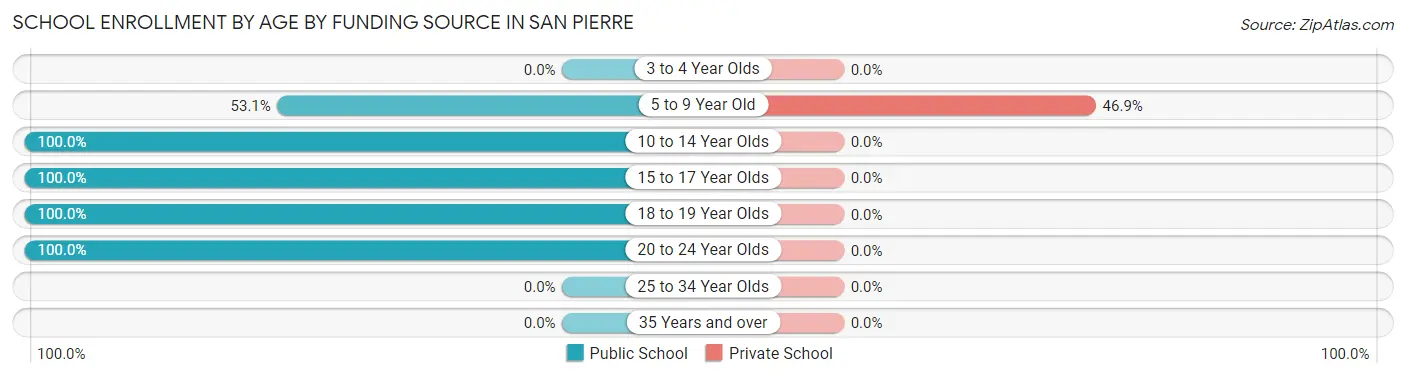
| Age Bracket | Public School | Private School |
| 3 to 4 Year Olds | 0 (0.0%) | 0 (0.0%) |
| 5 to 9 Year Old | 26 (53.1%) | 23 (46.9%) |
| 10 to 14 Year Olds | 42 (100.0%) | 0 (0.0%) |
| 15 to 17 Year Olds | 13 (100.0%) | 0 (0.0%) |
| 18 to 19 Year Olds | 27 (100.0%) | 0 (0.0%) |
| 20 to 24 Year Olds | 8 (100.0%) | 0 (0.0%) |
| 25 to 34 Year Olds | 0 (0.0%) | 0 (0.0%) |
| 35 Years and over | 0 (0.0%) | 0 (0.0%) |
| Total | 116 (83.5%) | 23 (16.5%) |
Educational Attainment by Field of Study in San Pierre
, and business (32 | 100.0%) are the most common fields of study among 32 individuals in San Pierre who have obtained a bachelor's degree or higher.
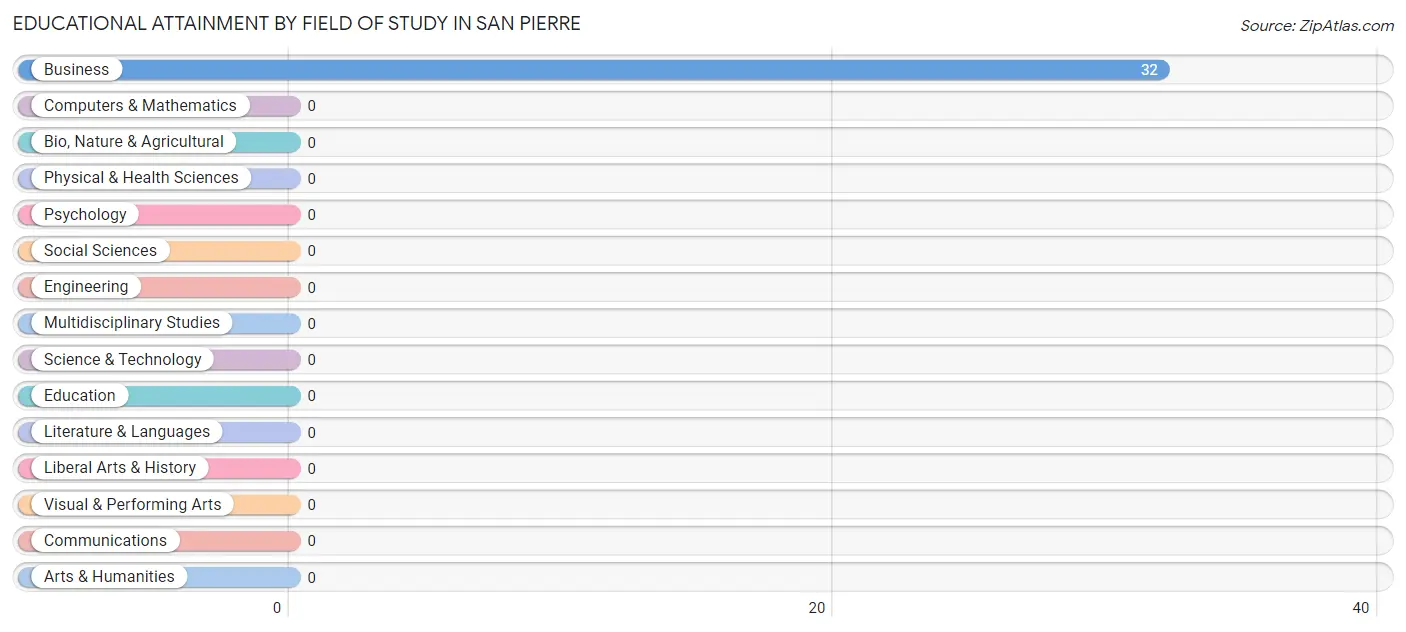
| Field of Study | # Graduates | % Graduates |
| Computers & Mathematics | 0 | 0.0% |
| Bio, Nature & Agricultural | 0 | 0.0% |
| Physical & Health Sciences | 0 | 0.0% |
| Psychology | 0 | 0.0% |
| Social Sciences | 0 | 0.0% |
| Engineering | 0 | 0.0% |
| Multidisciplinary Studies | 0 | 0.0% |
| Science & Technology | 0 | 0.0% |
| Business | 32 | 100.0% |
| Education | 0 | 0.0% |
| Literature & Languages | 0 | 0.0% |
| Liberal Arts & History | 0 | 0.0% |
| Visual & Performing Arts | 0 | 0.0% |
| Communications | 0 | 0.0% |
| Arts & Humanities | 0 | 0.0% |
| Total | 32 | 100.0% |
Transportation & Commute in San Pierre
Vehicle Availability by Sex in San Pierre
The most prevalent vehicle ownership categories in San Pierre are males with 5 or more vehicles (106, accounting for 86.9%) and females with 5 or more vehicles (40, making up 94.6%).
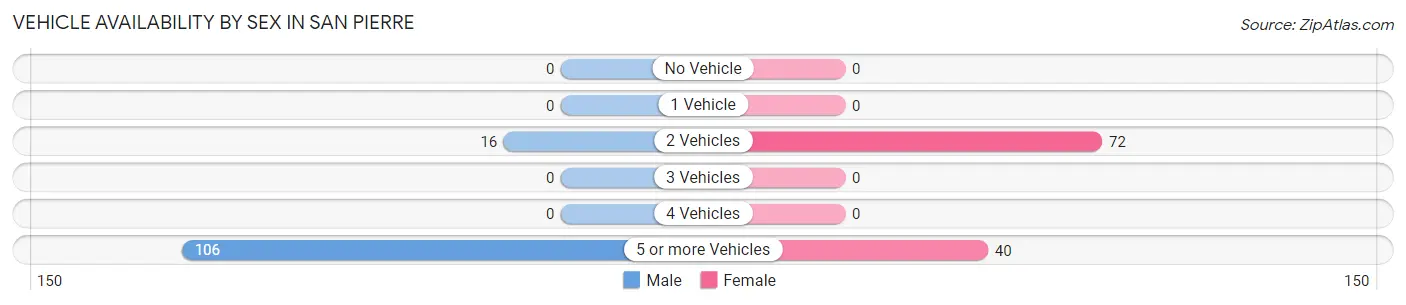
| Vehicles Available | Male | Female |
| No Vehicle | 0 (0.0%) | 0 (0.0%) |
| 1 Vehicle | 0 (0.0%) | 0 (0.0%) |
| 2 Vehicles | 16 (13.1%) | 72 (64.3%) |
| 3 Vehicles | 0 (0.0%) | 0 (0.0%) |
| 4 Vehicles | 0 (0.0%) | 0 (0.0%) |
| 5 or more Vehicles | 106 (86.9%) | 40 (35.7%) |
| Total | 122 (100.0%) | 112 (100.0%) |
Commute Time in San Pierre
The most frequently occuring commute durations in San Pierre are 30 to 34 minutes (102 commuters, 43.6%), 10 to 14 minutes (61 commuters, 26.1%), and 45 to 59 minutes (44 commuters, 18.8%).
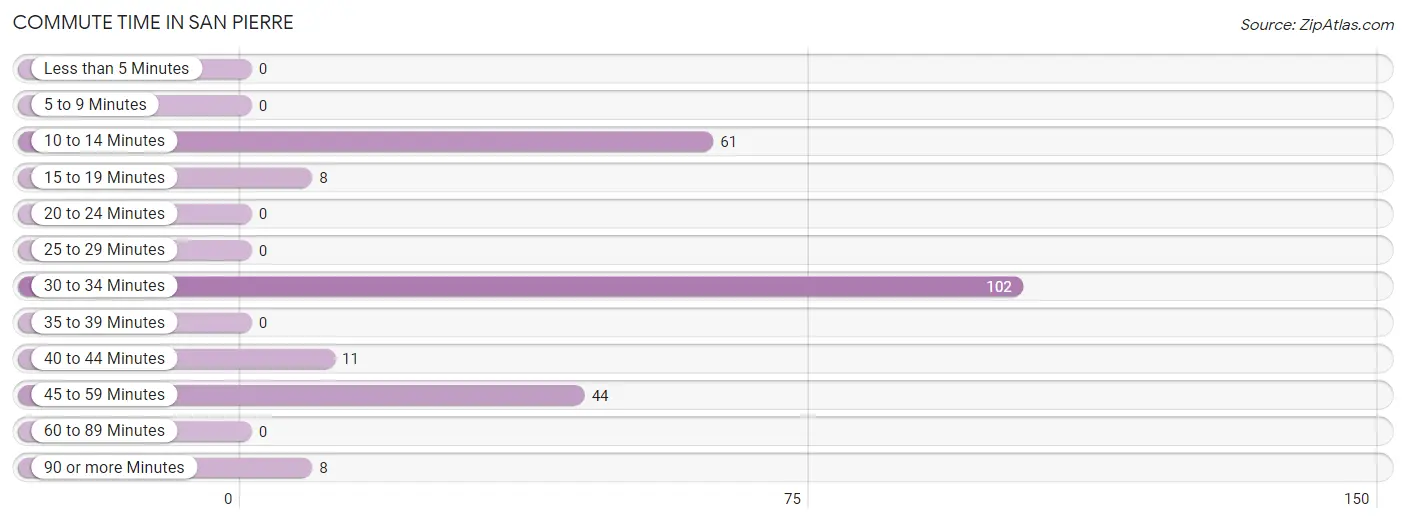
| Commute Time | # Commuters | % Commuters |
| Less than 5 Minutes | 0 | 0.0% |
| 5 to 9 Minutes | 0 | 0.0% |
| 10 to 14 Minutes | 61 | 26.1% |
| 15 to 19 Minutes | 8 | 3.4% |
| 20 to 24 Minutes | 0 | 0.0% |
| 25 to 29 Minutes | 0 | 0.0% |
| 30 to 34 Minutes | 102 | 43.6% |
| 35 to 39 Minutes | 0 | 0.0% |
| 40 to 44 Minutes | 11 | 4.7% |
| 45 to 59 Minutes | 44 | 18.8% |
| 60 to 89 Minutes | 0 | 0.0% |
| 90 or more Minutes | 8 | 3.4% |
Commute Time by Sex in San Pierre
The most common commute times in San Pierre are 30 to 34 minutes (70 commuters, 57.4%) for males and 10 to 14 minutes (61 commuters, 54.5%) for females.
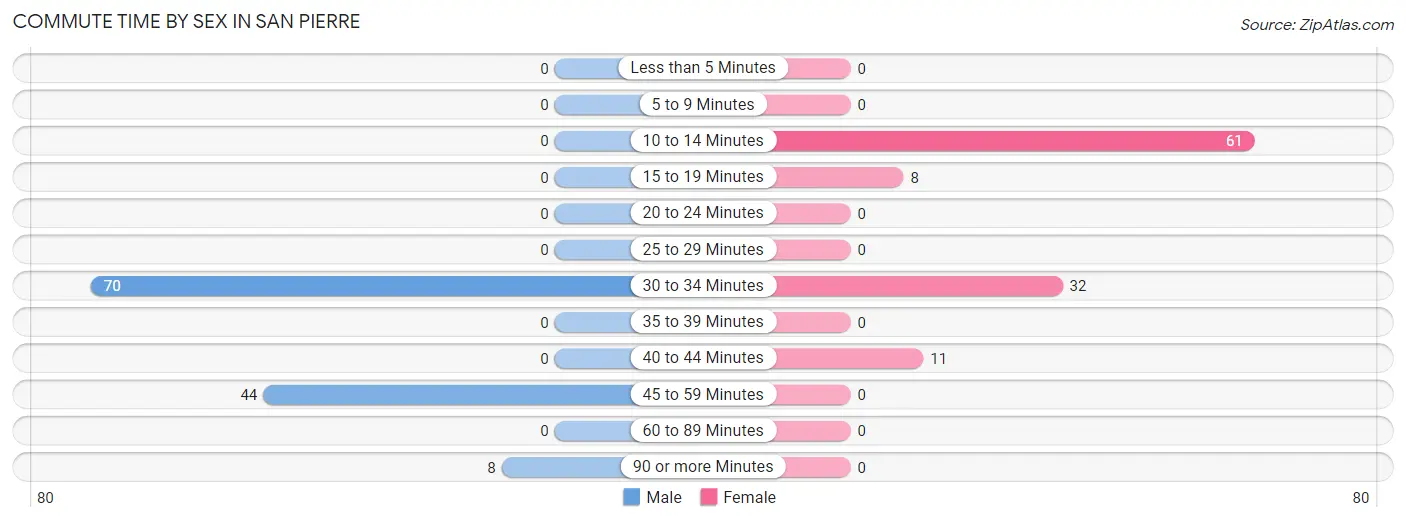
| Commute Time | Male | Female |
| Less than 5 Minutes | 0 (0.0%) | 0 (0.0%) |
| 5 to 9 Minutes | 0 (0.0%) | 0 (0.0%) |
| 10 to 14 Minutes | 0 (0.0%) | 61 (54.5%) |
| 15 to 19 Minutes | 0 (0.0%) | 8 (7.1%) |
| 20 to 24 Minutes | 0 (0.0%) | 0 (0.0%) |
| 25 to 29 Minutes | 0 (0.0%) | 0 (0.0%) |
| 30 to 34 Minutes | 70 (57.4%) | 32 (28.6%) |
| 35 to 39 Minutes | 0 (0.0%) | 0 (0.0%) |
| 40 to 44 Minutes | 0 (0.0%) | 11 (9.8%) |
| 45 to 59 Minutes | 44 (36.1%) | 0 (0.0%) |
| 60 to 89 Minutes | 0 (0.0%) | 0 (0.0%) |
| 90 or more Minutes | 8 (6.6%) | 0 (0.0%) |
Time of Departure to Work by Sex in San Pierre
The most frequent times of departure to work in San Pierre are 7:00 AM to 7:29 AM (49, 40.2%) for males and 12:00 PM to 3:59 PM (52, 46.4%) for females.
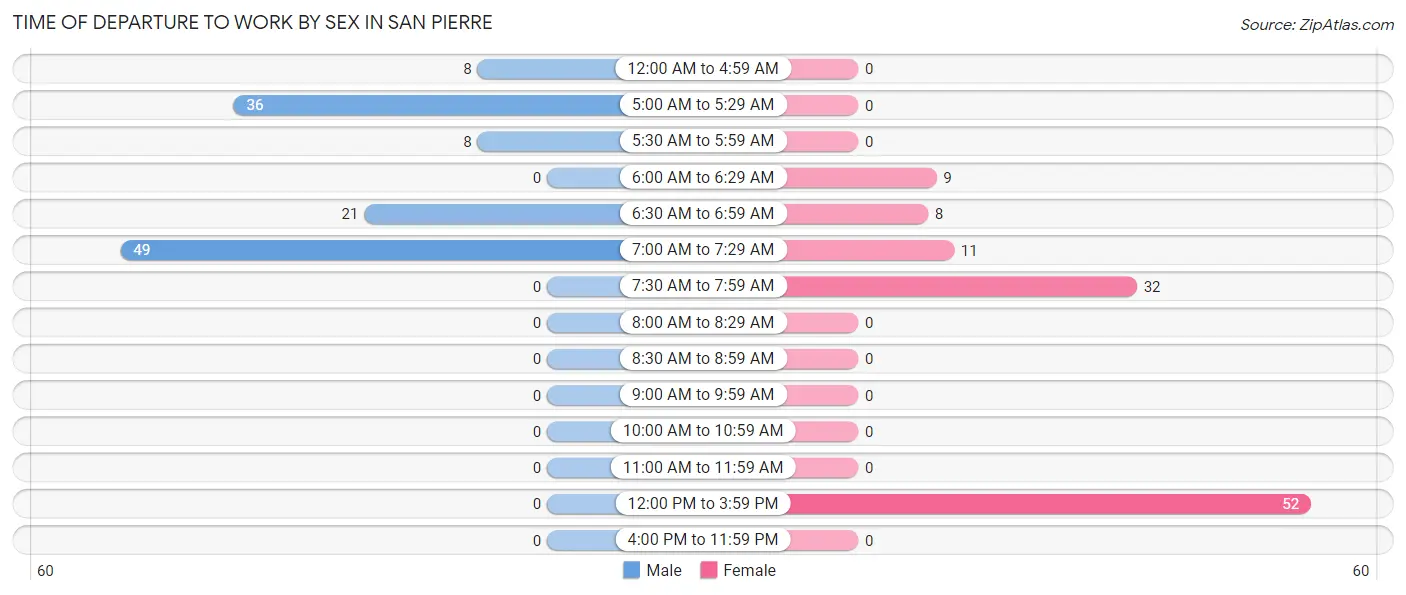
| Time of Departure | Male | Female |
| 12:00 AM to 4:59 AM | 8 (6.6%) | 0 (0.0%) |
| 5:00 AM to 5:29 AM | 36 (29.5%) | 0 (0.0%) |
| 5:30 AM to 5:59 AM | 8 (6.6%) | 0 (0.0%) |
| 6:00 AM to 6:29 AM | 0 (0.0%) | 9 (8.0%) |
| 6:30 AM to 6:59 AM | 21 (17.2%) | 8 (7.1%) |
| 7:00 AM to 7:29 AM | 49 (40.2%) | 11 (9.8%) |
| 7:30 AM to 7:59 AM | 0 (0.0%) | 32 (28.6%) |
| 8:00 AM to 8:29 AM | 0 (0.0%) | 0 (0.0%) |
| 8:30 AM to 8:59 AM | 0 (0.0%) | 0 (0.0%) |
| 9:00 AM to 9:59 AM | 0 (0.0%) | 0 (0.0%) |
| 10:00 AM to 10:59 AM | 0 (0.0%) | 0 (0.0%) |
| 11:00 AM to 11:59 AM | 0 (0.0%) | 0 (0.0%) |
| 12:00 PM to 3:59 PM | 0 (0.0%) | 52 (46.4%) |
| 4:00 PM to 11:59 PM | 0 (0.0%) | 0 (0.0%) |
| Total | 122 (100.0%) | 112 (100.0%) |
Housing Occupancy in San Pierre
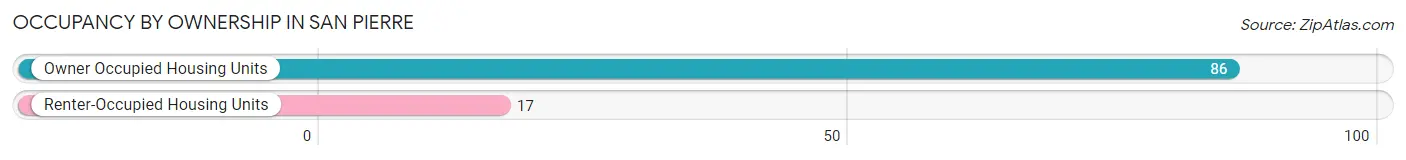
Occupancy by Ownership in San Pierre
Of the total 103 dwellings in San Pierre, owner-occupied units account for 86 (83.5%), while renter-occupied units make up 17 (16.5%).
| Occupancy | # Housing Units | % Housing Units |
| Owner Occupied Housing Units | 86 | 83.5% |
| Renter-Occupied Housing Units | 17 | 16.5% |
| Total Occupied Housing Units | 103 | 100.0% |
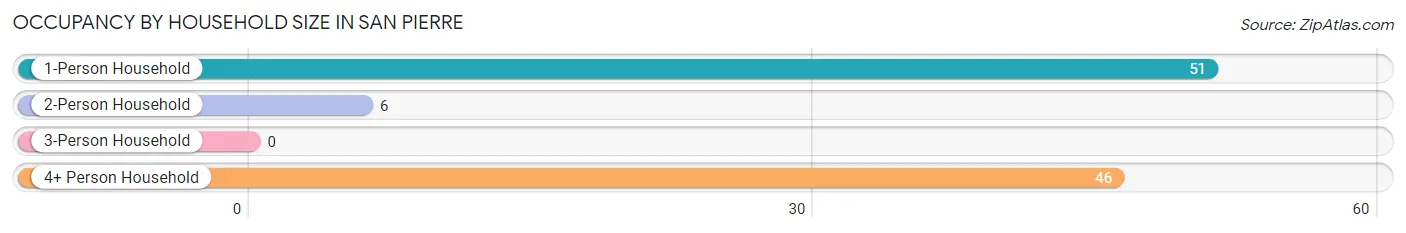
Occupancy by Household Size in San Pierre
| Household Size | # Housing Units | % Housing Units |
| 1-Person Household | 51 | 49.5% |
| 2-Person Household | 6 | 5.8% |
| 3-Person Household | 0 | 0.0% |
| 4+ Person Household | 46 | 44.7% |
| Total Housing Units | 103 | 100.0% |
Occupancy by Ownership by Household Size in San Pierre
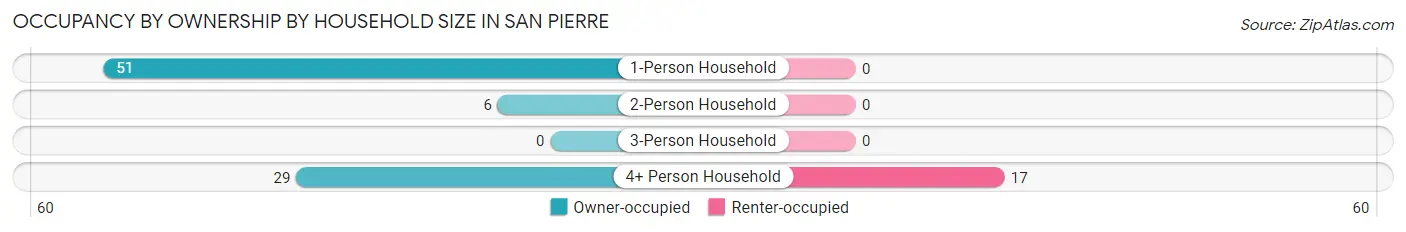
| Household Size | Owner-occupied | Renter-occupied |
| 1-Person Household | 51 (100.0%) | 0 (0.0%) |
| 2-Person Household | 6 (100.0%) | 0 (0.0%) |
| 3-Person Household | 0 (0.0%) | 0 (0.0%) |
| 4+ Person Household | 29 (63.0%) | 17 (37.0%) |
| Total Housing Units | 86 (83.5%) | 17 (16.5%) |
Occupancy by Educational Attainment in San Pierre
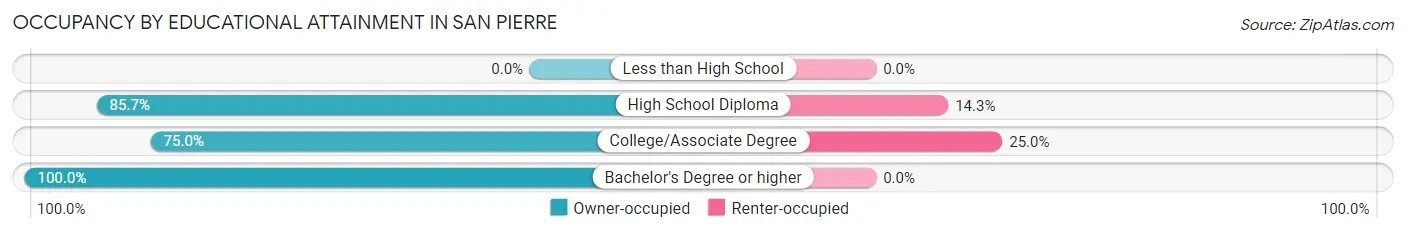
| Household Size | Owner-occupied | Renter-occupied |
| Less than High School | 0 (0.0%) | 0 (0.0%) |
| High School Diploma | 54 (85.7%) | 9 (14.3%) |
| College/Associate Degree | 24 (75.0%) | 8 (25.0%) |
| Bachelor's Degree or higher | 8 (100.0%) | 0 (0.0%) |
Occupancy by Age of Householder in San Pierre
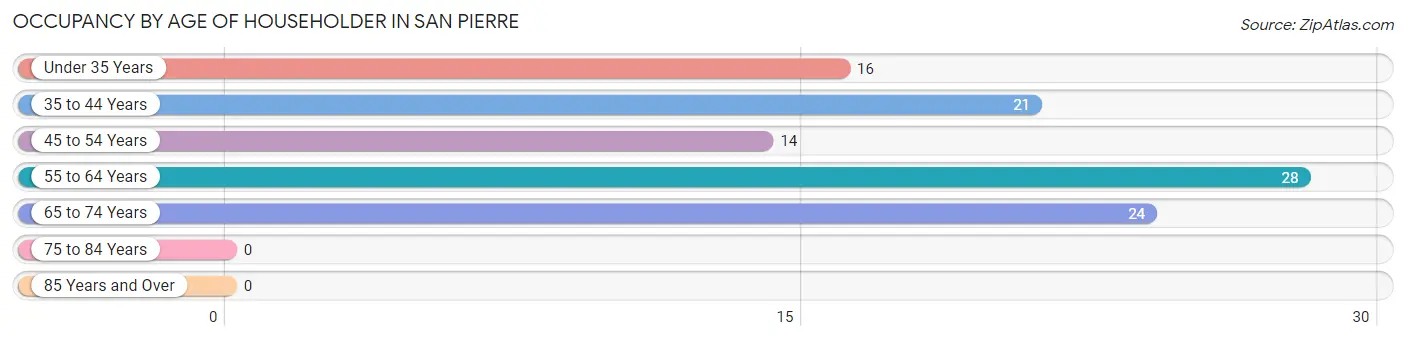
| Age Bracket | # Households | % Households |
| Under 35 Years | 16 | 15.5% |
| 35 to 44 Years | 21 | 20.4% |
| 45 to 54 Years | 14 | 13.6% |
| 55 to 64 Years | 28 | 27.2% |
| 65 to 74 Years | 24 | 23.3% |
| 75 to 84 Years | 0 | 0.0% |
| 85 Years and Over | 0 | 0.0% |
| Total | 103 | 100.0% |
Housing Finances in San Pierre
Median Income by Occupancy in San Pierre
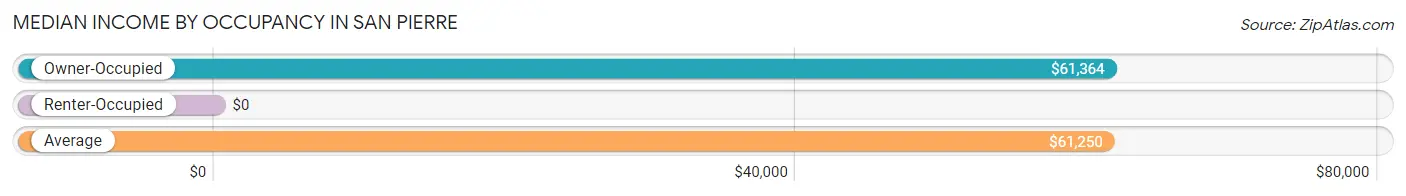
| Occupancy Type | # Households | Median Income |
| Owner-Occupied | 86 (83.5%) | $61,364 |
| Renter-Occupied | 17 (16.5%) | $0 |
| Average | 103 (100.0%) | $61,250 |
Occupancy by Householder Income Bracket in San Pierre
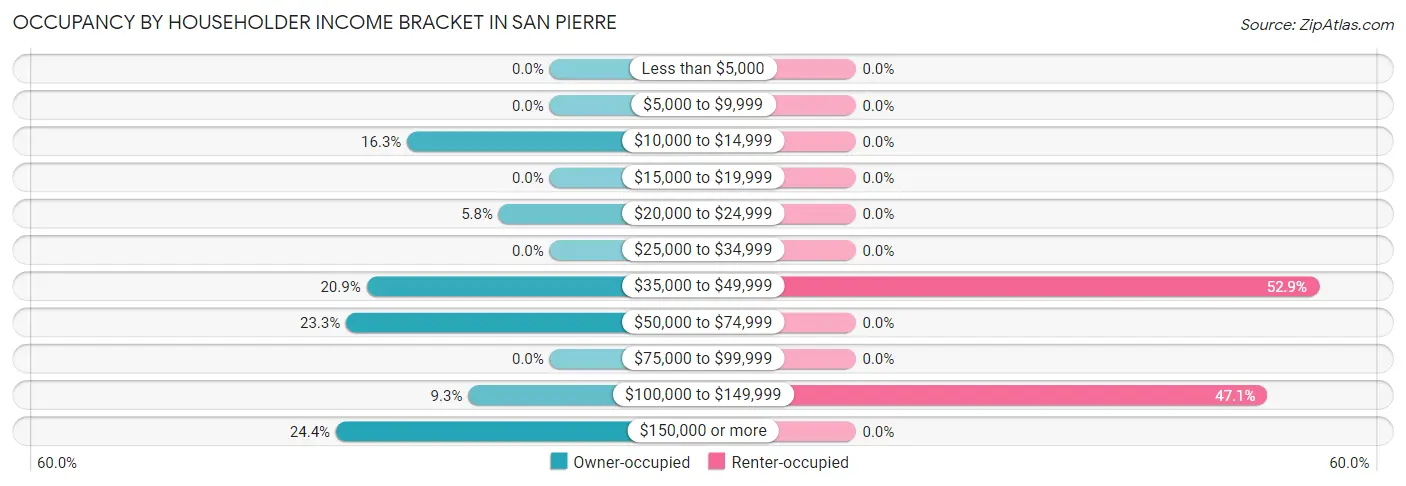
| Income Bracket | Owner-occupied | Renter-occupied |
| Less than $5,000 | 0 (0.0%) | 0 (0.0%) |
| $5,000 to $9,999 | 0 (0.0%) | 0 (0.0%) |
| $10,000 to $14,999 | 14 (16.3%) | 0 (0.0%) |
| $15,000 to $19,999 | 0 (0.0%) | 0 (0.0%) |
| $20,000 to $24,999 | 5 (5.8%) | 0 (0.0%) |
| $25,000 to $34,999 | 0 (0.0%) | 0 (0.0%) |
| $35,000 to $49,999 | 18 (20.9%) | 9 (52.9%) |
| $50,000 to $74,999 | 20 (23.3%) | 0 (0.0%) |
| $75,000 to $99,999 | 0 (0.0%) | 0 (0.0%) |
| $100,000 to $149,999 | 8 (9.3%) | 8 (47.1%) |
| $150,000 or more | 21 (24.4%) | 0 (0.0%) |
| Total | 86 (100.0%) | 17 (100.0%) |
Monthly Housing Cost Tiers in San Pierre
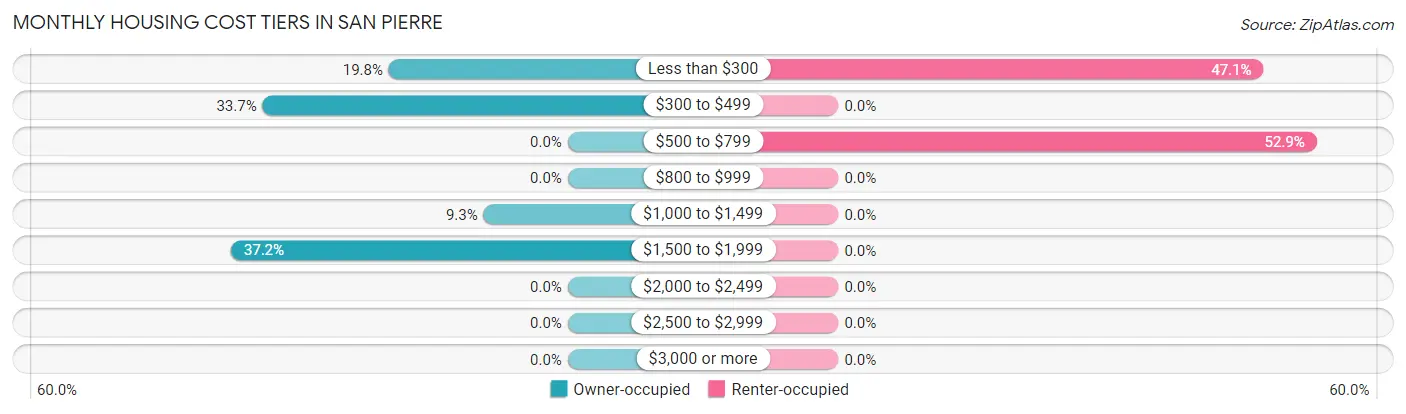
| Monthly Cost | Owner-occupied | Renter-occupied |
| Less than $300 | 17 (19.8%) | 8 (47.1%) |
| $300 to $499 | 29 (33.7%) | 0 (0.0%) |
| $500 to $799 | 0 (0.0%) | 9 (52.9%) |
| $800 to $999 | 0 (0.0%) | 0 (0.0%) |
| $1,000 to $1,499 | 8 (9.3%) | 0 (0.0%) |
| $1,500 to $1,999 | 32 (37.2%) | 0 (0.0%) |
| $2,000 to $2,499 | 0 (0.0%) | 0 (0.0%) |
| $2,500 to $2,999 | 0 (0.0%) | 0 (0.0%) |
| $3,000 or more | 0 (0.0%) | 0 (0.0%) |
| Total | 86 (100.0%) | 17 (100.0%) |
Physical Housing Characteristics in San Pierre
Housing Structures in San Pierre
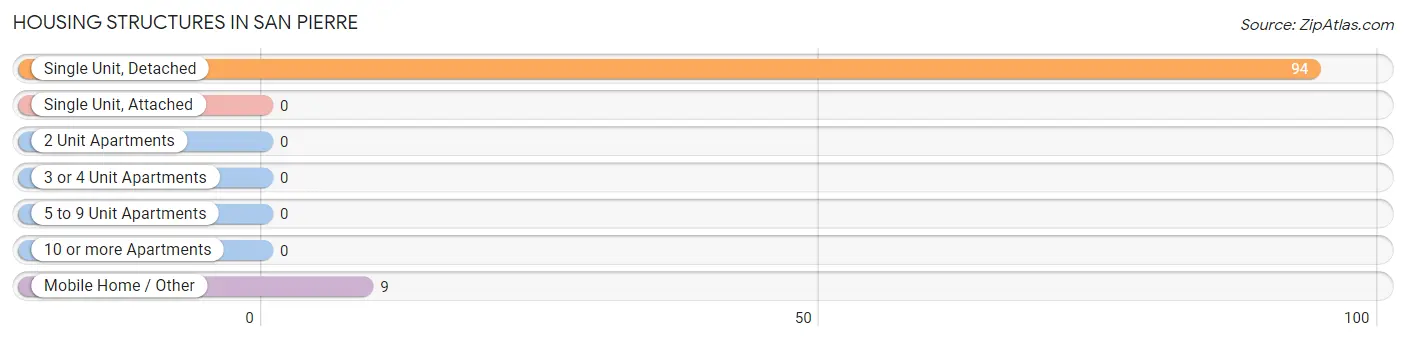
| Structure Type | # Housing Units | % Housing Units |
| Single Unit, Detached | 94 | 91.3% |
| Single Unit, Attached | 0 | 0.0% |
| 2 Unit Apartments | 0 | 0.0% |
| 3 or 4 Unit Apartments | 0 | 0.0% |
| 5 to 9 Unit Apartments | 0 | 0.0% |
| 10 or more Apartments | 0 | 0.0% |
| Mobile Home / Other | 9 | 8.7% |
| Total | 103 | 100.0% |
Housing Structures by Occupancy in San Pierre
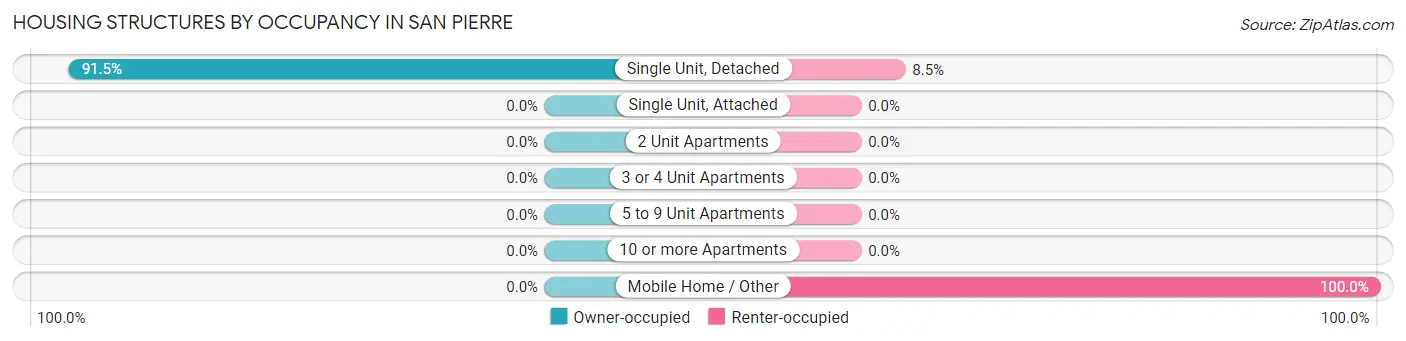
| Structure Type | Owner-occupied | Renter-occupied |
| Single Unit, Detached | 86 (91.5%) | 8 (8.5%) |
| Single Unit, Attached | 0 (0.0%) | 0 (0.0%) |
| 2 Unit Apartments | 0 (0.0%) | 0 (0.0%) |
| 3 or 4 Unit Apartments | 0 (0.0%) | 0 (0.0%) |
| 5 to 9 Unit Apartments | 0 (0.0%) | 0 (0.0%) |
| 10 or more Apartments | 0 (0.0%) | 0 (0.0%) |
| Mobile Home / Other | 0 (0.0%) | 9 (100.0%) |
| Total | 86 (83.5%) | 17 (16.5%) |
Housing Structures by Number of Rooms in San Pierre
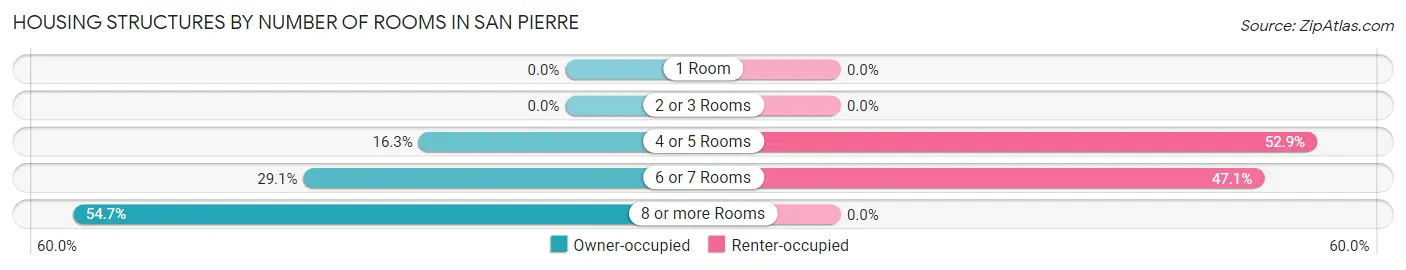
| Number of Rooms | Owner-occupied | Renter-occupied |
| 1 Room | 0 (0.0%) | 0 (0.0%) |
| 2 or 3 Rooms | 0 (0.0%) | 0 (0.0%) |
| 4 or 5 Rooms | 14 (16.3%) | 9 (52.9%) |
| 6 or 7 Rooms | 25 (29.1%) | 8 (47.1%) |
| 8 or more Rooms | 47 (54.6%) | 0 (0.0%) |
| Total | 86 (100.0%) | 17 (100.0%) |
Housing Structure by Heating Type in San Pierre
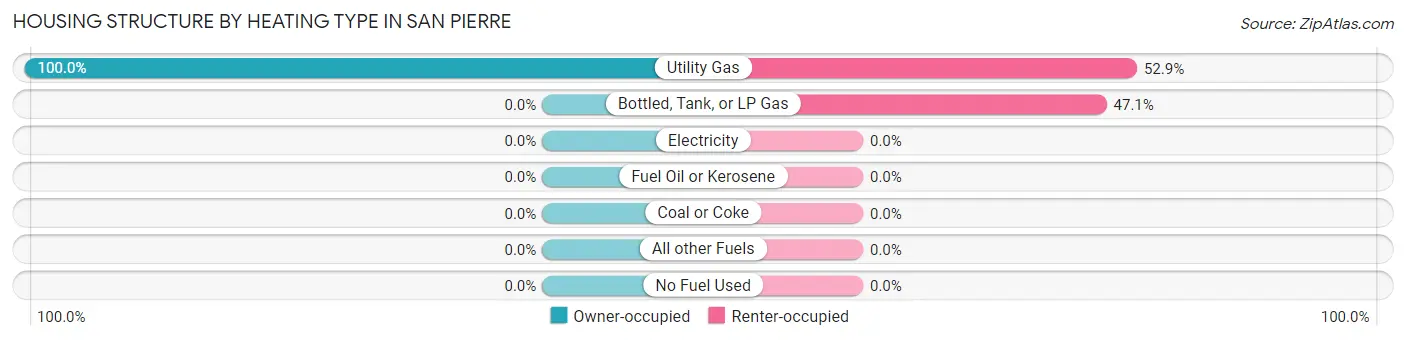
| Heating Type | Owner-occupied | Renter-occupied |
| Utility Gas | 86 (100.0%) | 9 (52.9%) |
| Bottled, Tank, or LP Gas | 0 (0.0%) | 8 (47.1%) |
| Electricity | 0 (0.0%) | 0 (0.0%) |
| Fuel Oil or Kerosene | 0 (0.0%) | 0 (0.0%) |
| Coal or Coke | 0 (0.0%) | 0 (0.0%) |
| All other Fuels | 0 (0.0%) | 0 (0.0%) |
| No Fuel Used | 0 (0.0%) | 0 (0.0%) |
| Total | 86 (100.0%) | 17 (100.0%) |
Household Vehicle Usage in San Pierre
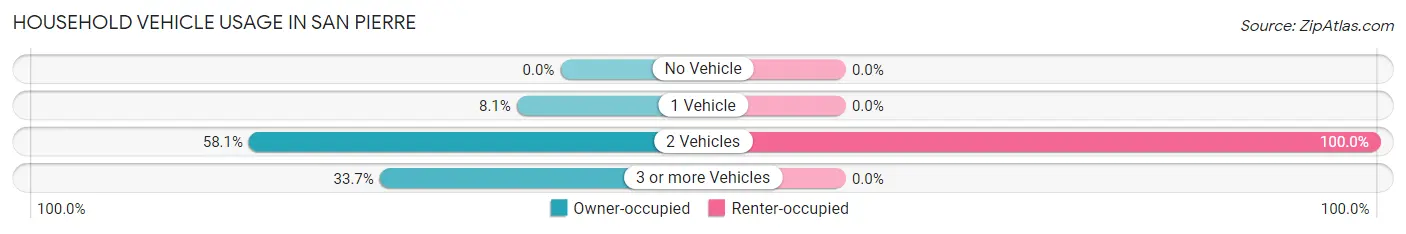
| Vehicles per Household | Owner-occupied | Renter-occupied |
| No Vehicle | 0 (0.0%) | 0 (0.0%) |
| 1 Vehicle | 7 (8.1%) | 0 (0.0%) |
| 2 Vehicles | 50 (58.1%) | 17 (100.0%) |
| 3 or more Vehicles | 29 (33.7%) | 0 (0.0%) |
| Total | 86 (100.0%) | 17 (100.0%) |
Real Estate & Mortgages in San Pierre
Real Estate and Mortgage Overview in San Pierre
| Characteristic | Without Mortgage | With Mortgage |
| Housing Units | 46 | 40 |
| Median Property Value | $111,300 | $252,400 |
| Median Household Income | - | - |
| Monthly Housing Costs | $314 | $0 |
| Real Estate Taxes | - | - |
Property Value by Mortgage Status in San Pierre
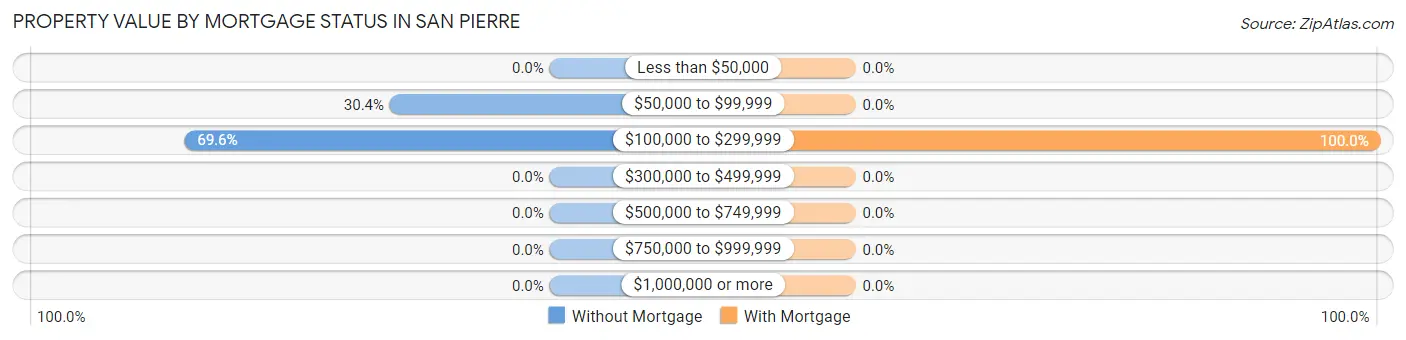
| Property Value | Without Mortgage | With Mortgage |
| Less than $50,000 | 0 (0.0%) | 0 (0.0%) |
| $50,000 to $99,999 | 14 (30.4%) | 0 (0.0%) |
| $100,000 to $299,999 | 32 (69.6%) | 40 (100.0%) |
| $300,000 to $499,999 | 0 (0.0%) | 0 (0.0%) |
| $500,000 to $749,999 | 0 (0.0%) | 0 (0.0%) |
| $750,000 to $999,999 | 0 (0.0%) | 0 (0.0%) |
| $1,000,000 or more | 0 (0.0%) | 0 (0.0%) |
| Total | 46 (100.0%) | 40 (100.0%) |
Household Income by Mortgage Status in San Pierre
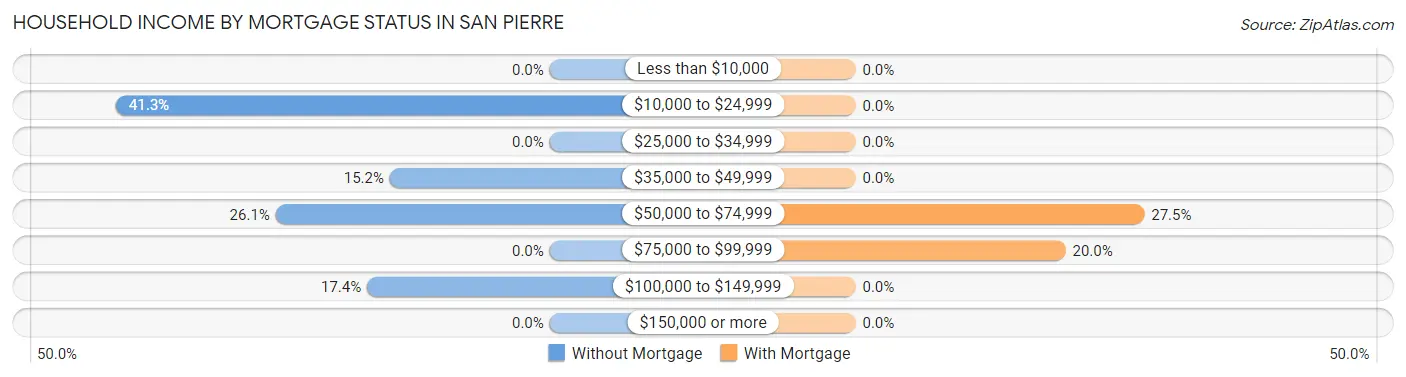
| Household Income | Without Mortgage | With Mortgage |
| Less than $10,000 | 0 (0.0%) | 0 (0.0%) |
| $10,000 to $24,999 | 19 (41.3%) | 0 (0.0%) |
| $25,000 to $34,999 | 0 (0.0%) | 0 (0.0%) |
| $35,000 to $49,999 | 7 (15.2%) | 0 (0.0%) |
| $50,000 to $74,999 | 12 (26.1%) | 11 (27.5%) |
| $75,000 to $99,999 | 0 (0.0%) | 8 (20.0%) |
| $100,000 to $149,999 | 8 (17.4%) | 0 (0.0%) |
| $150,000 or more | 0 (0.0%) | 0 (0.0%) |
| Total | 46 (100.0%) | 40 (100.0%) |
Property Value to Household Income Ratio in San Pierre
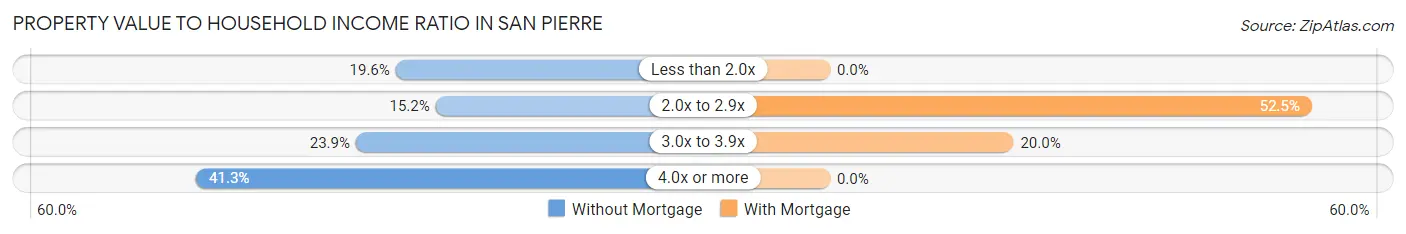
| Value-to-Income Ratio | Without Mortgage | With Mortgage |
| Less than 2.0x | 9 (19.6%) | 0 (0.0%) |
| 2.0x to 2.9x | 7 (15.2%) | 21 (52.5%) |
| 3.0x to 3.9x | 11 (23.9%) | 8 (20.0%) |
| 4.0x or more | 19 (41.3%) | 0 (0.0%) |
| Total | 46 (100.0%) | 40 (100.0%) |
Real Estate Taxes by Mortgage Status in San Pierre
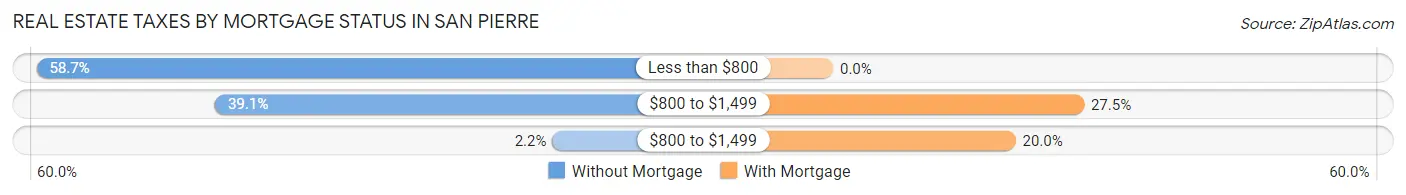
| Property Taxes | Without Mortgage | With Mortgage |
| Less than $800 | 27 (58.7%) | 0 (0.0%) |
| $800 to $1,499 | 18 (39.1%) | 11 (27.5%) |
| $800 to $1,499 | 1 (2.2%) | 8 (20.0%) |
| Total | 46 (100.0%) | 40 (100.0%) |
Health & Disability in San Pierre
Health Insurance Coverage by Age in San Pierre
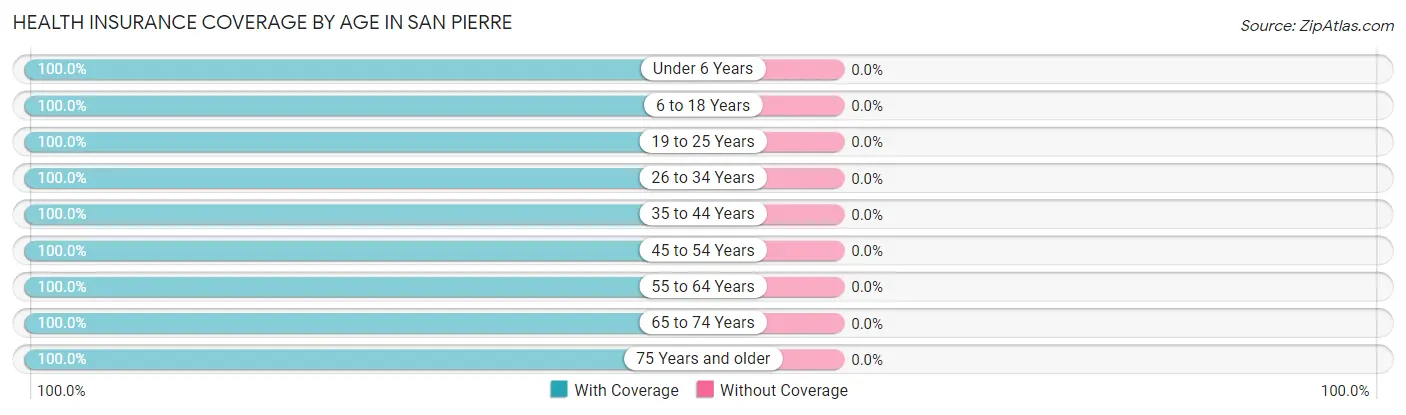
| Age Bracket | With Coverage | Without Coverage |
| Under 6 Years | 45 (100.0%) | 0 (0.0%) |
| 6 to 18 Years | 118 (100.0%) | 0 (0.0%) |
| 19 to 25 Years | 57 (100.0%) | 0 (0.0%) |
| 26 to 34 Years | 60 (100.0%) | 0 (0.0%) |
| 35 to 44 Years | 64 (100.0%) | 0 (0.0%) |
| 45 to 54 Years | 14 (100.0%) | 0 (0.0%) |
| 55 to 64 Years | 37 (100.0%) | 0 (0.0%) |
| 65 to 74 Years | 35 (100.0%) | 0 (0.0%) |
| 75 Years and older | 6 (100.0%) | 0 (0.0%) |
| Total | 436 (100.0%) | 0 (0.0%) |
Health Insurance Coverage by Citizenship Status in San Pierre
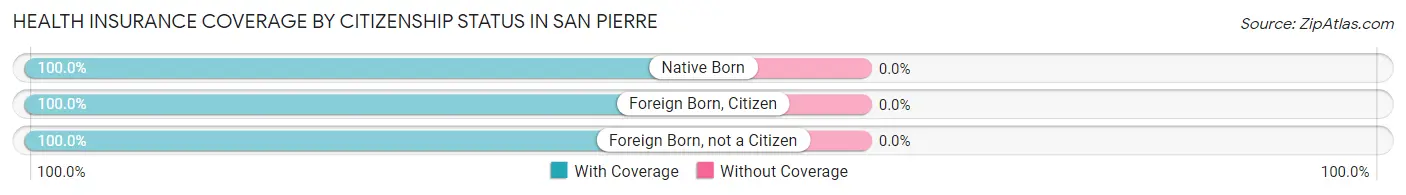
| Citizenship Status | With Coverage | Without Coverage |
| Native Born | 45 (100.0%) | 0 (0.0%) |
| Foreign Born, Citizen | 118 (100.0%) | 0 (0.0%) |
| Foreign Born, not a Citizen | 57 (100.0%) | 0 (0.0%) |
Health Insurance Coverage by Household Income in San Pierre
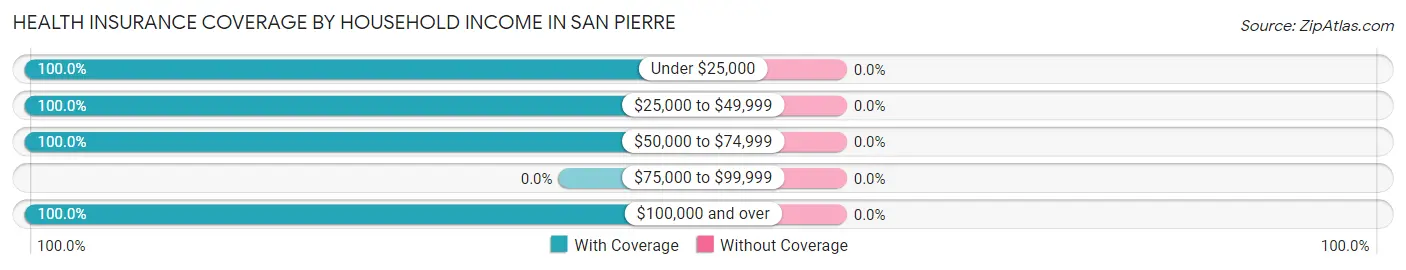
| Household Income | With Coverage | Without Coverage |
| Under $25,000 | 24 (100.0%) | 0 (0.0%) |
| $25,000 to $49,999 | 115 (100.0%) | 0 (0.0%) |
| $50,000 to $74,999 | 26 (100.0%) | 0 (0.0%) |
| $75,000 to $99,999 | 0 (0.0%) | 0 (0.0%) |
| $100,000 and over | 271 (100.0%) | 0 (0.0%) |
Public vs Private Health Insurance Coverage by Age in San Pierre
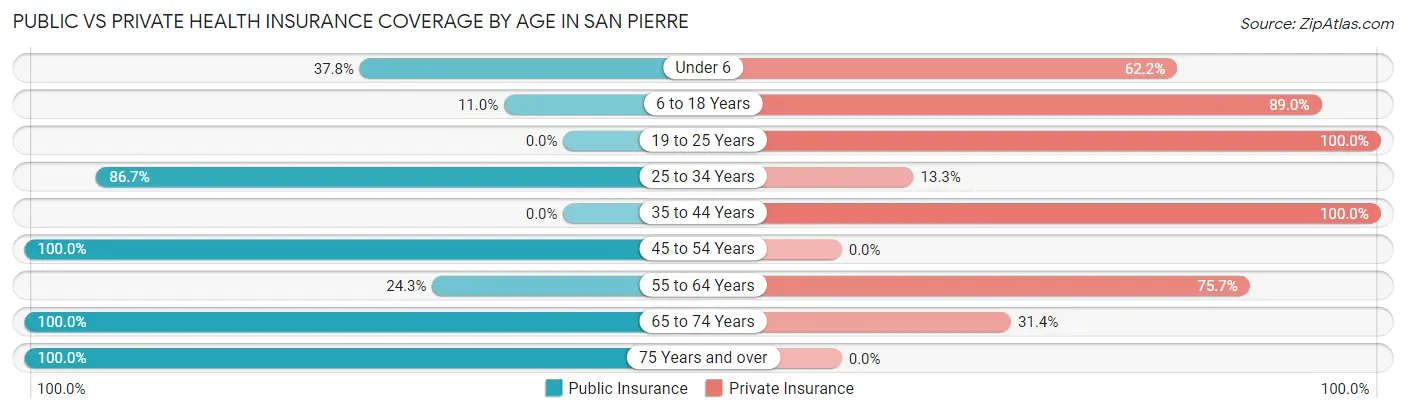
| Age Bracket | Public Insurance | Private Insurance |
| Under 6 | 17 (37.8%) | 28 (62.2%) |
| 6 to 18 Years | 13 (11.0%) | 105 (89.0%) |
| 19 to 25 Years | 0 (0.0%) | 57 (100.0%) |
| 25 to 34 Years | 52 (86.7%) | 8 (13.3%) |
| 35 to 44 Years | 0 (0.0%) | 64 (100.0%) |
| 45 to 54 Years | 14 (100.0%) | 0 (0.0%) |
| 55 to 64 Years | 9 (24.3%) | 28 (75.7%) |
| 65 to 74 Years | 35 (100.0%) | 11 (31.4%) |
| 75 Years and over | 6 (100.0%) | 0 (0.0%) |
| Total | 146 (33.5%) | 301 (69.0%) |
Disability Status by Sex by Age in San Pierre
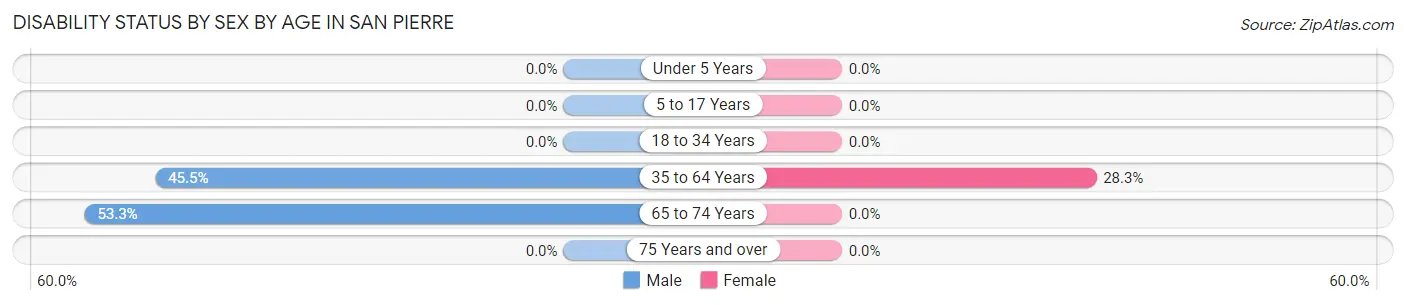
| Age Bracket | Male | Female |
| Under 5 Years | 0 (0.0%) | 0 (0.0%) |
| 5 to 17 Years | 0 (0.0%) | 0 (0.0%) |
| 18 to 34 Years | 0 (0.0%) | 0 (0.0%) |
| 35 to 64 Years | 25 (45.5%) | 17 (28.3%) |
| 65 to 74 Years | 16 (53.3%) | 0 (0.0%) |
| 75 Years and over | 0 (0.0%) | 0 (0.0%) |
Disability Class by Sex by Age in San Pierre
Disability Class: Hearing Difficulty
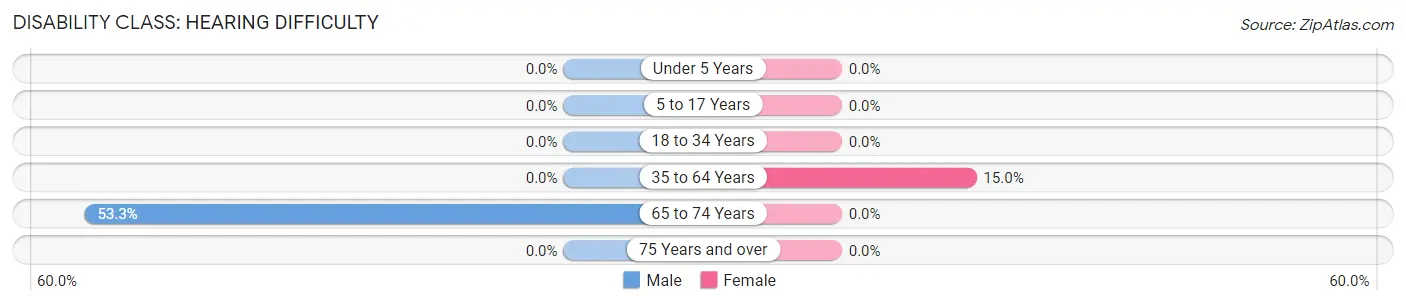
| Age Bracket | Male | Female |
| Under 5 Years | 0 (0.0%) | 0 (0.0%) |
| 5 to 17 Years | 0 (0.0%) | 0 (0.0%) |
| 18 to 34 Years | 0 (0.0%) | 0 (0.0%) |
| 35 to 64 Years | 0 (0.0%) | 9 (15.0%) |
| 65 to 74 Years | 16 (53.3%) | 0 (0.0%) |
| 75 Years and over | 0 (0.0%) | 0 (0.0%) |
Disability Class: Vision Difficulty
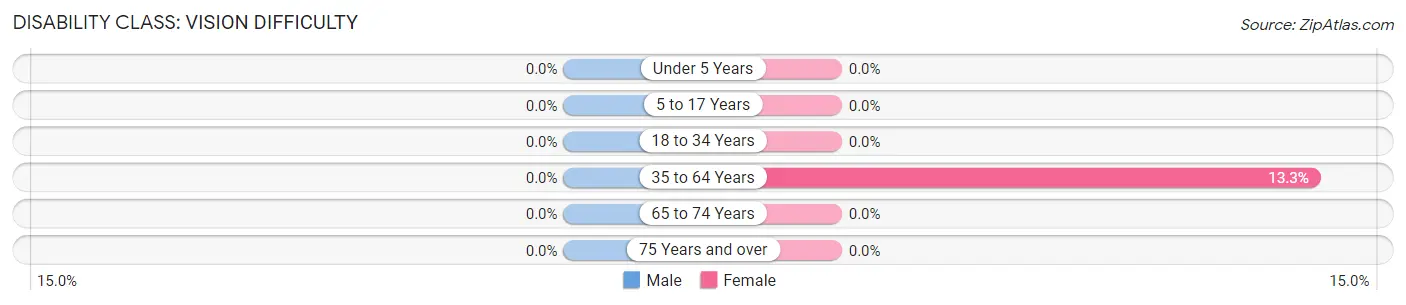
| Age Bracket | Male | Female |
| Under 5 Years | 0 (0.0%) | 0 (0.0%) |
| 5 to 17 Years | 0 (0.0%) | 0 (0.0%) |
| 18 to 34 Years | 0 (0.0%) | 0 (0.0%) |
| 35 to 64 Years | 0 (0.0%) | 8 (13.3%) |
| 65 to 74 Years | 0 (0.0%) | 0 (0.0%) |
| 75 Years and over | 0 (0.0%) | 0 (0.0%) |
Disability Class: Cognitive Difficulty
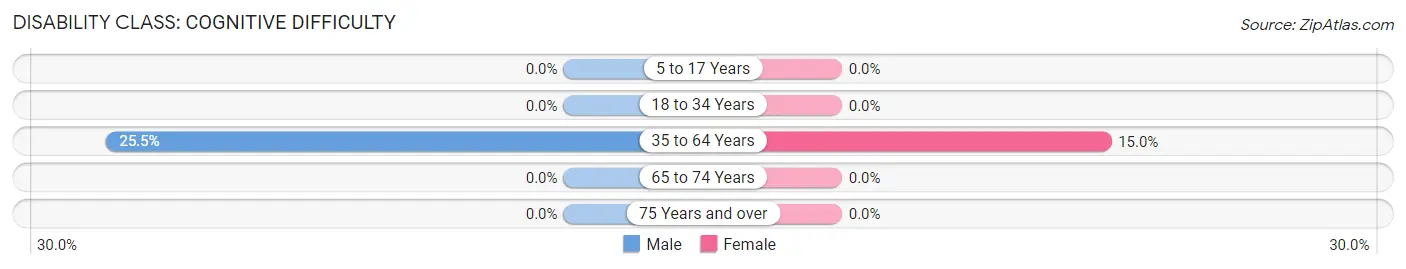
| Age Bracket | Male | Female |
| 5 to 17 Years | 0 (0.0%) | 0 (0.0%) |
| 18 to 34 Years | 0 (0.0%) | 0 (0.0%) |
| 35 to 64 Years | 14 (25.5%) | 9 (15.0%) |
| 65 to 74 Years | 0 (0.0%) | 0 (0.0%) |
| 75 Years and over | 0 (0.0%) | 0 (0.0%) |
Disability Class: Ambulatory Difficulty
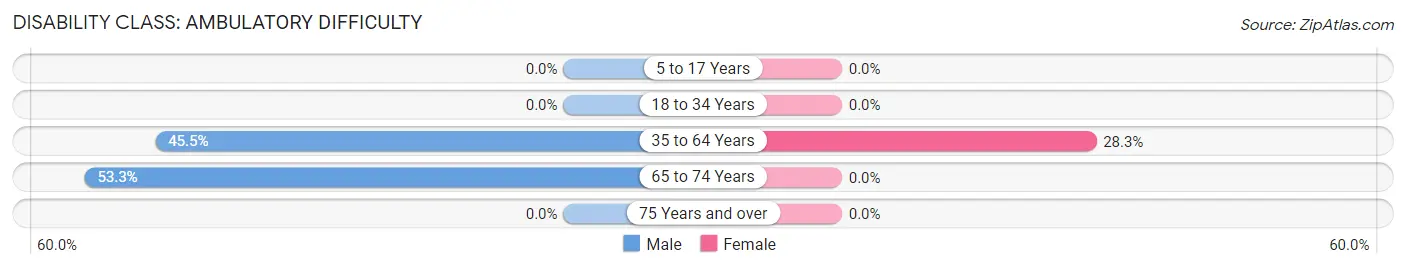
| Age Bracket | Male | Female |
| 5 to 17 Years | 0 (0.0%) | 0 (0.0%) |
| 18 to 34 Years | 0 (0.0%) | 0 (0.0%) |
| 35 to 64 Years | 25 (45.5%) | 17 (28.3%) |
| 65 to 74 Years | 16 (53.3%) | 0 (0.0%) |
| 75 Years and over | 0 (0.0%) | 0 (0.0%) |
Disability Class: Self-Care Difficulty
| Age Bracket | Male | Female |
| 5 to 17 Years | 0 (0.0%) | 0 (0.0%) |
| 18 to 34 Years | 0 (0.0%) | 0 (0.0%) |
| 35 to 64 Years | 0 (0.0%) | 0 (0.0%) |
| 65 to 74 Years | 0 (0.0%) | 0 (0.0%) |
| 75 Years and over | 0 (0.0%) | 0 (0.0%) |
Technology Access in San Pierre
Computing Device Access in San Pierre
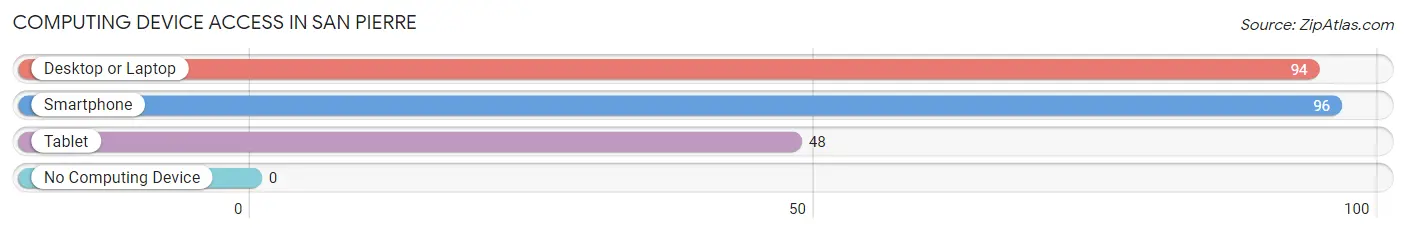
| Device Type | # Households | % Households |
| Desktop or Laptop | 94 | 91.3% |
| Smartphone | 96 | 93.2% |
| Tablet | 48 | 46.6% |
| No Computing Device | 0 | 0.0% |
| Total | 103 | 100.0% |
Internet Access in San Pierre
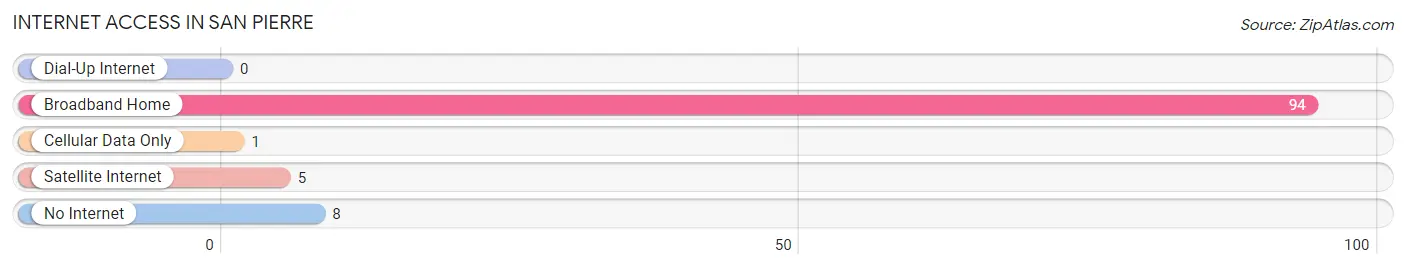
| Internet Type | # Households | % Households |
| Dial-Up Internet | 0 | 0.0% |
| Broadband Home | 94 | 91.3% |
| Cellular Data Only | 1 | 1.0% |
| Satellite Internet | 5 | 4.9% |
| No Internet | 8 | 7.8% |
| Total | 103 | 100.0% |
San Pierre Summary
Introduction
San Pierre is a small town located in Starke County, Indiana. It is situated in the northwest corner of the state, near the Illinois border. The town has a population of just over 500 people, and is known for its rural charm and small-town atmosphere. San Pierre is a great place to live, work, and raise a family.
History
San Pierre was founded in 1836 by a group of settlers from Ohio. The town was named after Pierre LaPorte, a French-Canadian fur trader who had settled in the area in the early 1800s. The town was originally a farming community, and the first settlers built a grist mill and a sawmill.
In 1851, the first railroad line was built through San Pierre, connecting it to the larger cities of Chicago and South Bend. This allowed the town to become a major shipping center for the surrounding area.
In the late 1800s, San Pierre began to grow and develop. The town was incorporated in 1891, and the first mayor was elected in 1892. The town continued to grow and develop throughout the 20th century, and today it is a thriving community.
Geography
San Pierre is located in the northwest corner of Indiana, near the Illinois border. The town is situated in the Kankakee River Valley, and is surrounded by rolling hills and farmland. The town is located about 40 miles from South Bend, and about 60 miles from Chicago.
The climate in San Pierre is typical of the Midwest, with hot summers and cold winters. The average temperature in the summer is around 75 degrees Fahrenheit, and the average temperature in the winter is around 25 degrees Fahrenheit.
Economy
San Pierre is a small town, and the economy is largely based on agriculture. The town is home to several farms, and the surrounding area is known for its production of corn, soybeans, and wheat.
In addition to agriculture, San Pierre is home to several small businesses. These include a grocery store, a hardware store, a restaurant, and a few other small shops.
Demographics
As of the 2010 census, the population of San Pierre was 514. The racial makeup of the town was 97.3% White, 0.6% African American, 0.2% Native American, 0.4% Asian, and 1.5% from other races.
The median household income in San Pierre was $41,250, and the median family income was $50,000. The per capita income was $20,845.
Conclusion
San Pierre is a small town located in the northwest corner of Indiana. It is a great place to live, work, and raise a family, and is known for its rural charm and small-town atmosphere. The town has a population of just over 500 people, and the economy is largely based on agriculture. San Pierre is a great place to call home, and is a great example of small-town America.
Common Questions
What is Per Capita Income in San Pierre?
Per Capita income in San Pierre is $22,969.
What is the Median Family Income in San Pierre?
Median Family Income in San Pierre is $133,438.
What is the Median Household income in San Pierre?
Median Household Income in San Pierre is $61,250.
What is Inequality or Gini Index in San Pierre?
Inequality or Gini Index in San Pierre is 0.37.
What is the Total Population of San Pierre?
Total Population of San Pierre is 436.
What is the Total Male Population of San Pierre?
Total Male Population of San Pierre is 249.
What is the Total Female Population of San Pierre?
Total Female Population of San Pierre is 187.
What is the Ratio of Males per 100 Females in San Pierre?
There are 133.16 Males per 100 Females in San Pierre.
What is the Ratio of Females per 100 Males in San Pierre?
There are 75.10 Females per 100 Males in San Pierre.
What is the Median Population Age in San Pierre?
Median Population Age in San Pierre is 24.9 Years.
What is the Average Family Size in San Pierre
Average Family Size in San Pierre is 7.3 People.
What is the Average Household Size in San Pierre
Average Household Size in San Pierre is 4.2 People.
How Large is the Labor Force in San Pierre?
There are 234 People in the Labor Forcein in San Pierre.
What is the Percentage of People in the Labor Force in San Pierre?
74.8% of People are in the Labor Force in San Pierre.