Russellville, IN Map & Demographics
Russellville Map
Russellville Overview
$24,277
PER CAPITA INCOME
$68,462
AVG HOUSEHOLD INCOME
49.5%
WAGE / INCOME GAP [ % ]
50.5¢/ $1
WAGE / INCOME GAP [ $ ]
$9,252
FAMILY INCOME DEFICIT
0.36
INEQUALITY / GINI INDEX
391
TOTAL POPULATION
151
MALE POPULATION
240
FEMALE POPULATION
62.92
MALES / 100 FEMALES
158.94
FEMALES / 100 MALES
33.8
MEDIAN AGE
3.1
AVG FAMILY SIZE
2.8
AVG HOUSEHOLD SIZE
197
LABOR FORCE [ PEOPLE ]
66.3%
PERCENT IN LABOR FORCE
Russellville Zip Codes
Russellville Area Codes
Income in Russellville
Income Overview in Russellville
| Characteristic | Number | Measure |
| Per Capita Income | 391 | $24,277 |
| Median Family Income | 110 | $0 |
| Mean Family Income | 110 | $65,505 |
| Median Household Income | 142 | $68,462 |
| Mean Household Income | 142 | $65,217 |
| Income Deficit | 110 | $9,252 |
| Wage / Income Gap (%) | 391 | 49.47% |
| Wage / Income Gap ($) | 391 | 50.53¢ per $1 |
| Gini / Inequality Index | 391 | 0.36 |
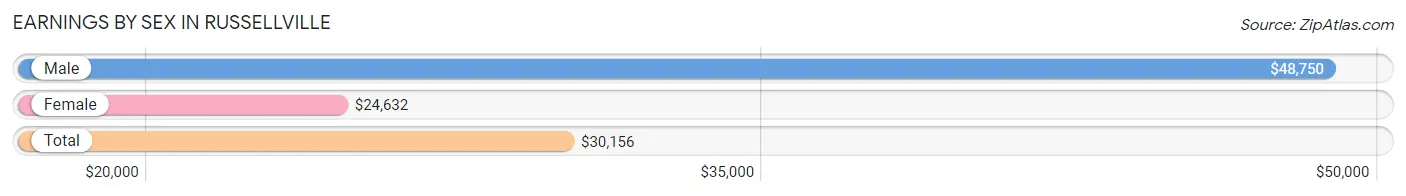
Earnings by Sex in Russellville
Average Earnings in Russellville are $30,156, $48,750 for men and $24,632 for women, a difference of 49.5%.
| Sex | Number | Average Earnings |
| Male | 89 (41.6%) | $48,750 |
| Female | 125 (58.4%) | $24,632 |
| Total | 214 (100.0%) | $30,156 |
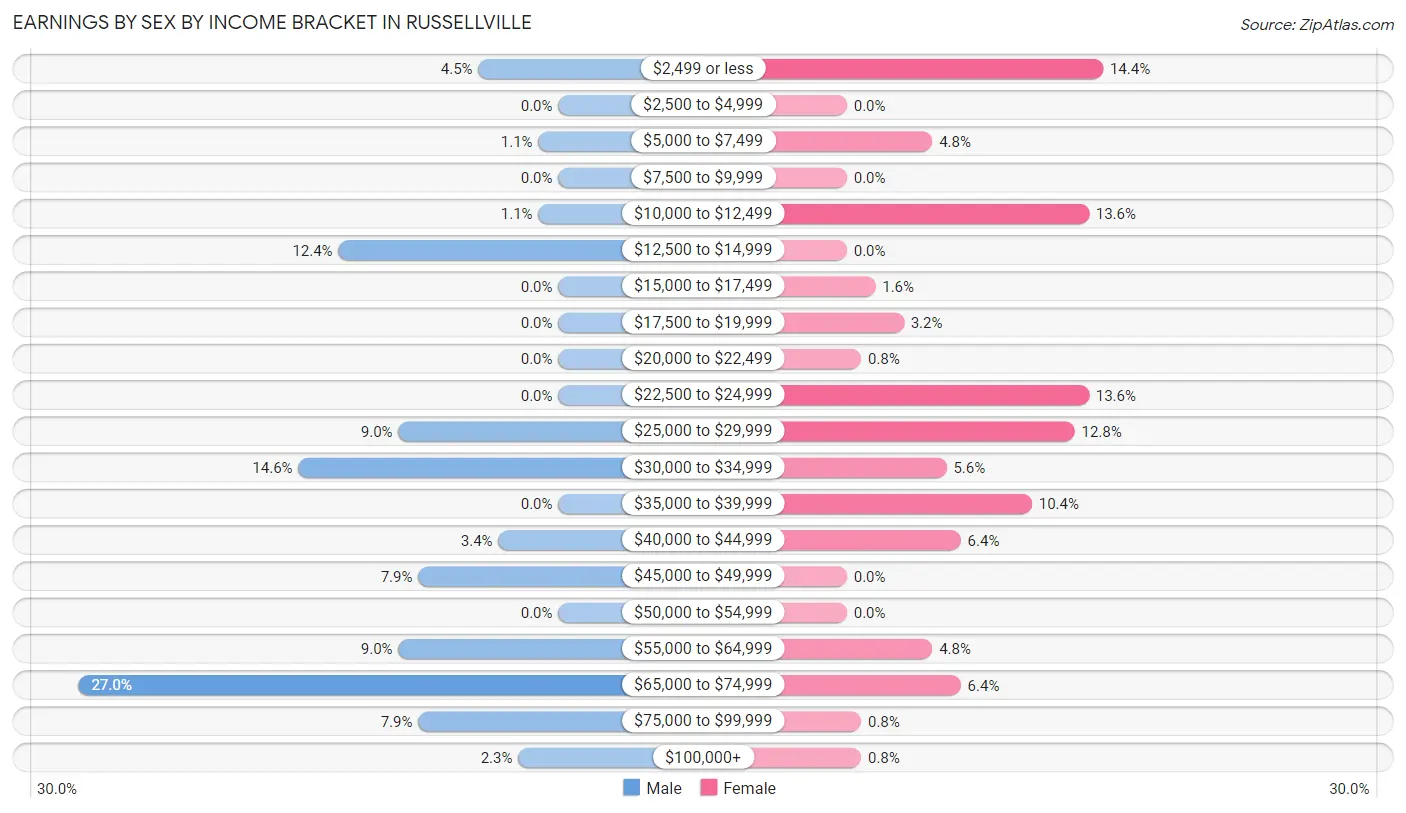
Earnings by Sex by Income Bracket in Russellville
The most common earnings brackets in Russellville are $65,000 to $74,999 for men (24 | 27.0%) and $2,499 or less for women (18 | 14.4%).
| Income | Male | Female |
| $2,499 or less | 4 (4.5%) | 18 (14.4%) |
| $2,500 to $4,999 | 0 (0.0%) | 0 (0.0%) |
| $5,000 to $7,499 | 1 (1.1%) | 6 (4.8%) |
| $7,500 to $9,999 | 0 (0.0%) | 0 (0.0%) |
| $10,000 to $12,499 | 1 (1.1%) | 17 (13.6%) |
| $12,500 to $14,999 | 11 (12.4%) | 0 (0.0%) |
| $15,000 to $17,499 | 0 (0.0%) | 2 (1.6%) |
| $17,500 to $19,999 | 0 (0.0%) | 4 (3.2%) |
| $20,000 to $22,499 | 0 (0.0%) | 1 (0.8%) |
| $22,500 to $24,999 | 0 (0.0%) | 17 (13.6%) |
| $25,000 to $29,999 | 8 (9.0%) | 16 (12.8%) |
| $30,000 to $34,999 | 13 (14.6%) | 7 (5.6%) |
| $35,000 to $39,999 | 0 (0.0%) | 13 (10.4%) |
| $40,000 to $44,999 | 3 (3.4%) | 8 (6.4%) |
| $45,000 to $49,999 | 7 (7.9%) | 0 (0.0%) |
| $50,000 to $54,999 | 0 (0.0%) | 0 (0.0%) |
| $55,000 to $64,999 | 8 (9.0%) | 6 (4.8%) |
| $65,000 to $74,999 | 24 (27.0%) | 8 (6.4%) |
| $75,000 to $99,999 | 7 (7.9%) | 1 (0.8%) |
| $100,000+ | 2 (2.2%) | 1 (0.8%) |
| Total | 89 (100.0%) | 125 (100.0%) |
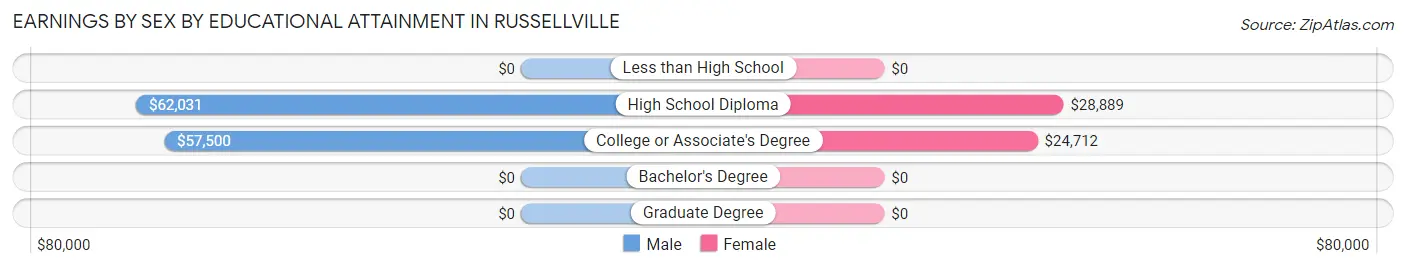
Earnings by Sex by Educational Attainment in Russellville
Average earnings in Russellville are $61,563 for men and $26,667 for women, a difference of 56.7%. Men with an educational attainment of high school diploma enjoy the highest average annual earnings of $62,031, while those with college or associate's degree education earn the least with $57,500. Women with an educational attainment of high school diploma earn the most with the average annual earnings of $28,889, while those with college or associate's degree education have the smallest earnings of $24,712.
| Educational Attainment | Male Income | Female Income |
| Less than High School | - | - |
| High School Diploma | $62,031 | $28,889 |
| College or Associate's Degree | $57,500 | $24,712 |
| Bachelor's Degree | - | - |
| Graduate Degree | - | - |
| Total | $61,563 | $26,667 |
Family Income in Russellville
Family Income Brackets in Russellville
According to the Russellville family income data, there are 30 families falling into the $75,000 to $99,999 income range, which is the most common income bracket and makes up 27.3% of all families.
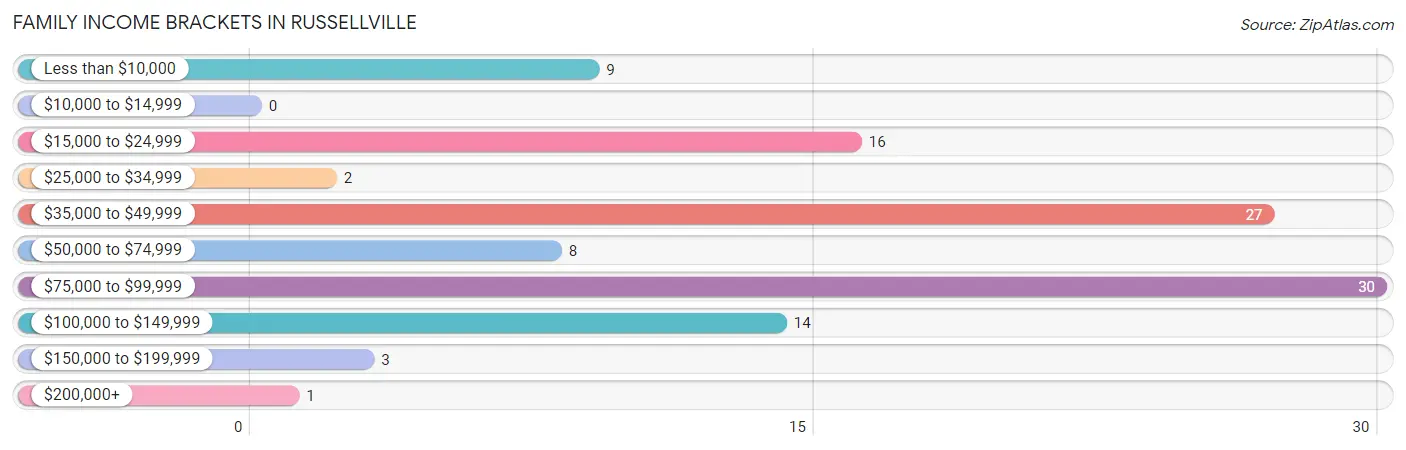
| Income Bracket | # Families | % Families |
| Less than $10,000 | 9 | 8.2% |
| $10,000 to $14,999 | 0 | 0.0% |
| $15,000 to $24,999 | 16 | 14.5% |
| $25,000 to $34,999 | 2 | 1.8% |
| $35,000 to $49,999 | 27 | 24.5% |
| $50,000 to $74,999 | 8 | 7.3% |
| $75,000 to $99,999 | 30 | 27.3% |
| $100,000 to $149,999 | 14 | 12.7% |
| $150,000 to $199,999 | 3 | 2.7% |
| $200,000+ | 1 | 0.9% |
Family Income by Famaliy Size in Russellville
3-person families (32 | 29.1%) account for the highest median family income in Russellville with $87,813 per family, while 3-person families (32 | 29.1%) have the highest median income of $29,271 per family member.
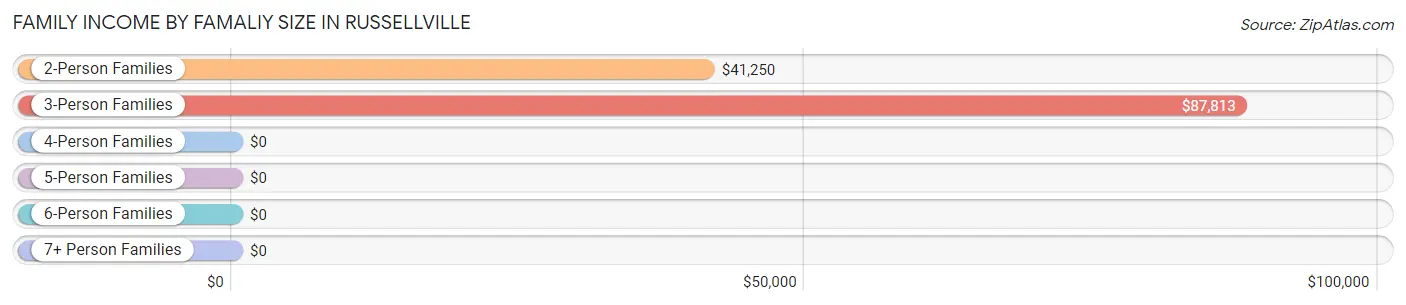
| Income Bracket | # Families | Median Income |
| 2-Person Families | 48 (43.6%) | $41,250 |
| 3-Person Families | 32 (29.1%) | $87,813 |
| 4-Person Families | 13 (11.8%) | $0 |
| 5-Person Families | 7 (6.4%) | $0 |
| 6-Person Families | 0 (0.0%) | $0 |
| 7+ Person Families | 10 (9.1%) | $0 |
| Total | 110 (100.0%) | $0 |
Family Income by Number of Earners in Russellville
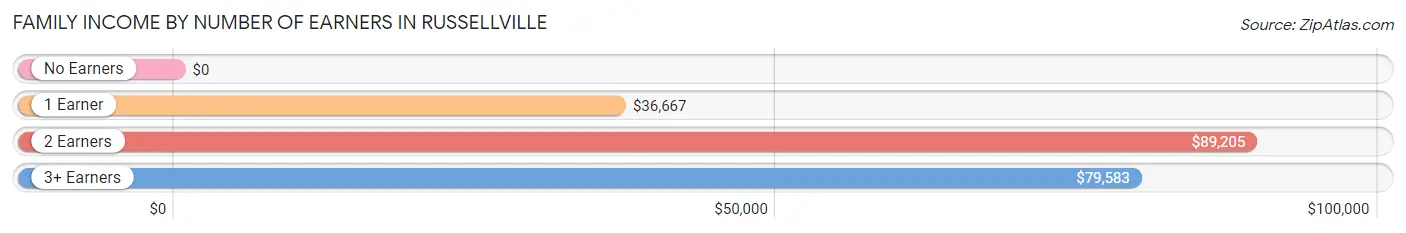
| Number of Earners | # Families | Median Income |
| No Earners | 13 (11.8%) | $0 |
| 1 Earner | 46 (41.8%) | $36,667 |
| 2 Earners | 37 (33.6%) | $89,205 |
| 3+ Earners | 14 (12.7%) | $79,583 |
| Total | 110 (100.0%) | $0 |
Household Income in Russellville
Household Income Brackets in Russellville
With 35 households falling in the category, the $75,000 to $99,999 income range is the most frequent in Russellville, accounting for 24.6% of all households. In contrast, only 1 households (0.7%) fall into the $200,000+ income bracket, making it the least populous group.
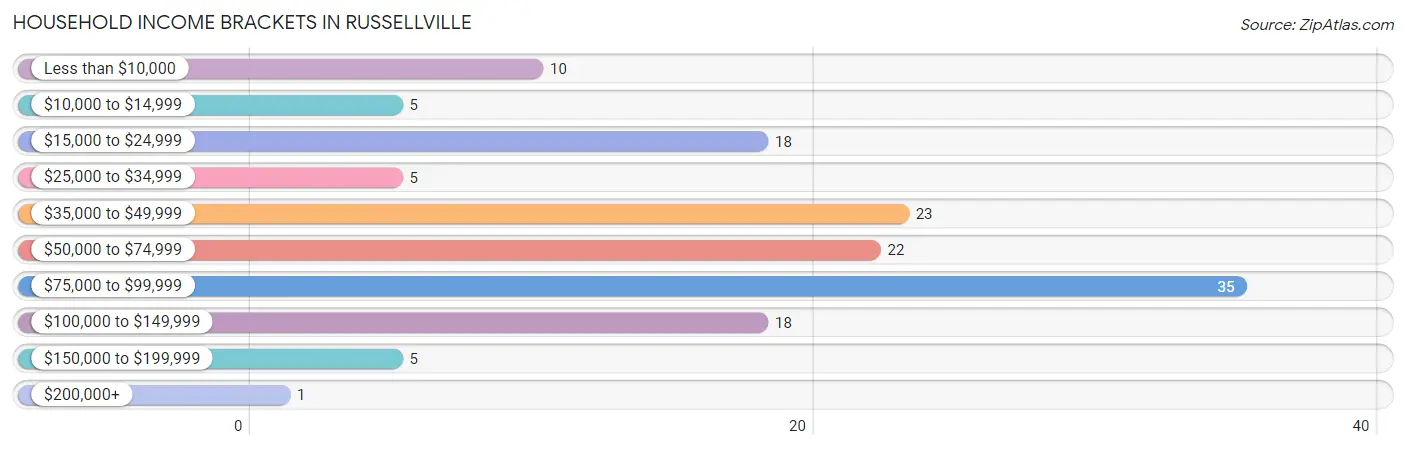
| Income Bracket | # Households | % Households |
| Less than $10,000 | 10 | 7.0% |
| $10,000 to $14,999 | 5 | 3.5% |
| $15,000 to $24,999 | 18 | 12.7% |
| $25,000 to $34,999 | 5 | 3.5% |
| $35,000 to $49,999 | 23 | 16.2% |
| $50,000 to $74,999 | 22 | 15.5% |
| $75,000 to $99,999 | 35 | 24.6% |
| $100,000 to $149,999 | 18 | 12.7% |
| $150,000 to $199,999 | 5 | 3.5% |
| $200,000+ | 1 | 0.7% |
Household Income by Householder Age in Russellville
The median household income in Russellville is $68,462, with the highest median household income of $88,182 found in the 45 to 64 years age bracket for the primary householder. A total of 40 households (28.2%) fall into this category. Meanwhile, the 15 to 24 years age bracket for the primary householder has the lowest median household income of $0, with 4 households (2.8%) in this group.
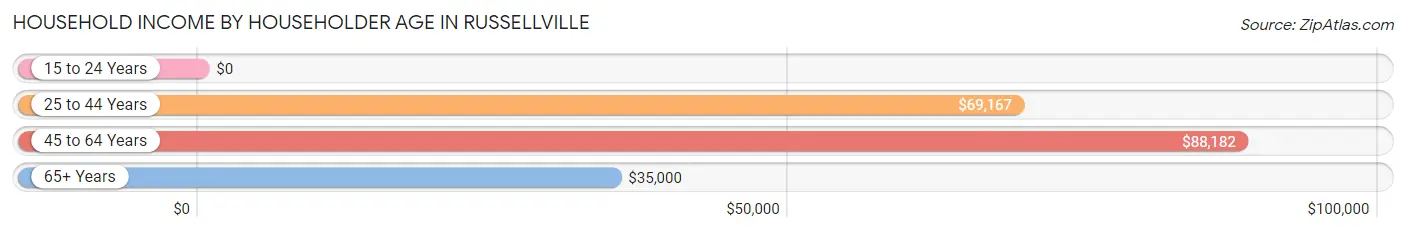
| Income Bracket | # Households | Median Income |
| 15 to 24 Years | 4 (2.8%) | $0 |
| 25 to 44 Years | 64 (45.1%) | $69,167 |
| 45 to 64 Years | 40 (28.2%) | $88,182 |
| 65+ Years | 34 (23.9%) | $35,000 |
| Total | 142 (100.0%) | $68,462 |
Poverty in Russellville
Income Below Poverty by Sex and Age in Russellville
With 2.0% poverty level for males and 34.6% for females among the residents of Russellville, 65 to 74 year old males and under 5 year old females are the most vulnerable to poverty, with 2 males (18.2%) and 34 females (85.0%) in their respective age groups living below the poverty level.
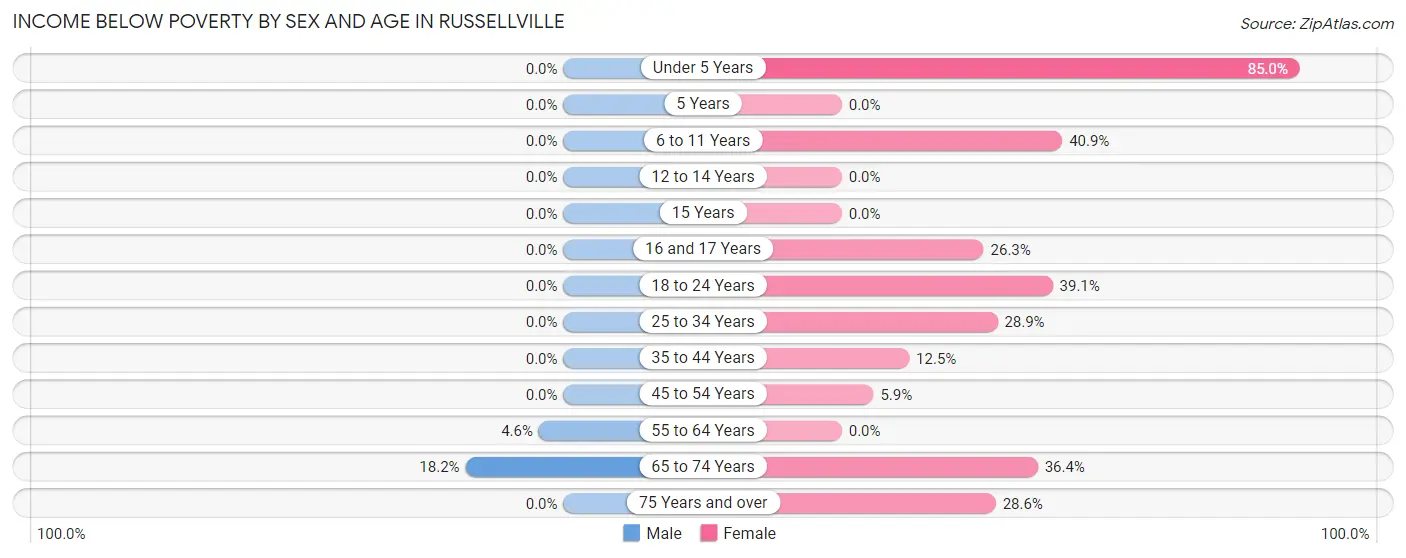
| Age Bracket | Male | Female |
| Under 5 Years | 0 (0.0%) | 34 (85.0%) |
| 5 Years | 0 (0.0%) | 0 (0.0%) |
| 6 to 11 Years | 0 (0.0%) | 9 (40.9%) |
| 12 to 14 Years | 0 (0.0%) | 0 (0.0%) |
| 15 Years | 0 (0.0%) | 0 (0.0%) |
| 16 and 17 Years | 0 (0.0%) | 5 (26.3%) |
| 18 to 24 Years | 0 (0.0%) | 9 (39.1%) |
| 25 to 34 Years | 0 (0.0%) | 13 (28.9%) |
| 35 to 44 Years | 0 (0.0%) | 2 (12.5%) |
| 45 to 54 Years | 0 (0.0%) | 1 (5.9%) |
| 55 to 64 Years | 1 (4.5%) | 0 (0.0%) |
| 65 to 74 Years | 2 (18.2%) | 8 (36.4%) |
| 75 Years and over | 0 (0.0%) | 2 (28.6%) |
| Total | 3 (2.0%) | 83 (34.6%) |
Income Above Poverty by Sex and Age in Russellville
According to the poverty statistics in Russellville, males aged under 5 years and females aged 15 years are the age groups that are most secure financially, with 100.0% of males and 100.0% of females in these age groups living above the poverty line.
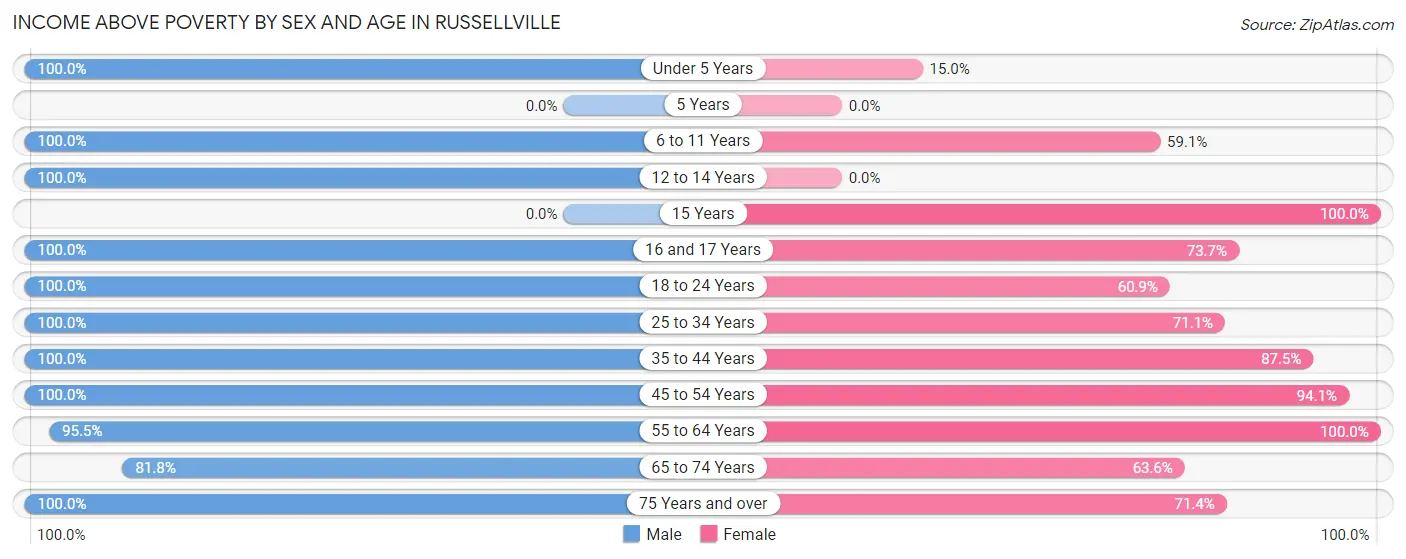
| Age Bracket | Male | Female |
| Under 5 Years | 4 (100.0%) | 6 (15.0%) |
| 5 Years | 0 (0.0%) | 0 (0.0%) |
| 6 to 11 Years | 2 (100.0%) | 13 (59.1%) |
| 12 to 14 Years | 19 (100.0%) | 0 (0.0%) |
| 15 Years | 0 (0.0%) | 7 (100.0%) |
| 16 and 17 Years | 8 (100.0%) | 14 (73.7%) |
| 18 to 24 Years | 13 (100.0%) | 14 (60.9%) |
| 25 to 34 Years | 23 (100.0%) | 32 (71.1%) |
| 35 to 44 Years | 26 (100.0%) | 14 (87.5%) |
| 45 to 54 Years | 16 (100.0%) | 16 (94.1%) |
| 55 to 64 Years | 21 (95.5%) | 22 (100.0%) |
| 65 to 74 Years | 9 (81.8%) | 14 (63.6%) |
| 75 Years and over | 7 (100.0%) | 5 (71.4%) |
| Total | 148 (98.0%) | 157 (65.4%) |
Income Below Poverty Among Married-Couple Families in Russellville
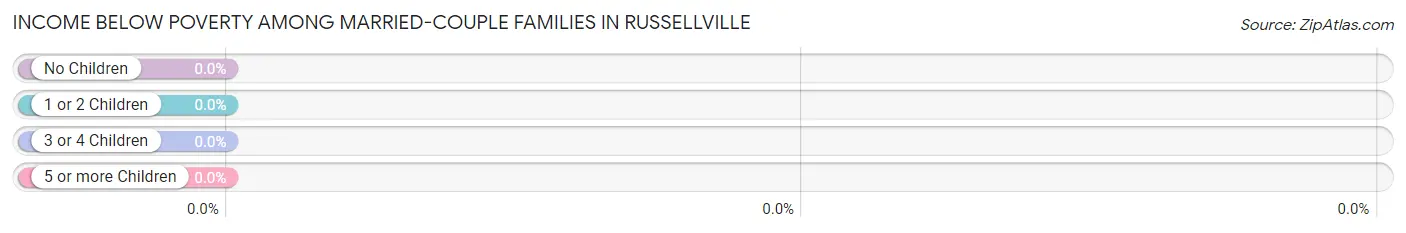
| Children | Above Poverty | Below Poverty |
| No Children | 40 (100.0%) | 0 (0.0%) |
| 1 or 2 Children | 19 (100.0%) | 0 (0.0%) |
| 3 or 4 Children | 5 (100.0%) | 0 (0.0%) |
| 5 or more Children | 6 (100.0%) | 0 (0.0%) |
| Total | 70 (100.0%) | 0 (0.0%) |
Income Below Poverty Among Single-Parent Households in Russellville
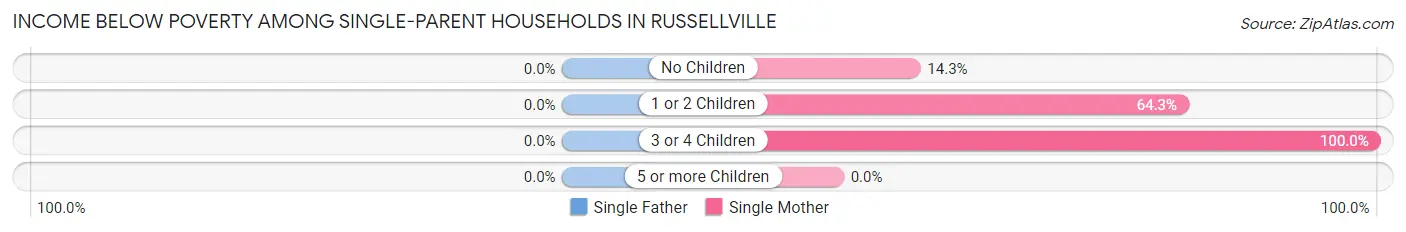
| Children | Single Father | Single Mother |
| No Children | 0 (0.0%) | 1 (14.3%) |
| 1 or 2 Children | 0 (0.0%) | 9 (64.3%) |
| 3 or 4 Children | 0 (0.0%) | 13 (100.0%) |
| 5 or more Children | 0 (0.0%) | 0 (0.0%) |
| Total | 0 (0.0%) | 23 (67.6%) |
Income Below Poverty Among Married-Couple vs Single-Parent Households in Russellville
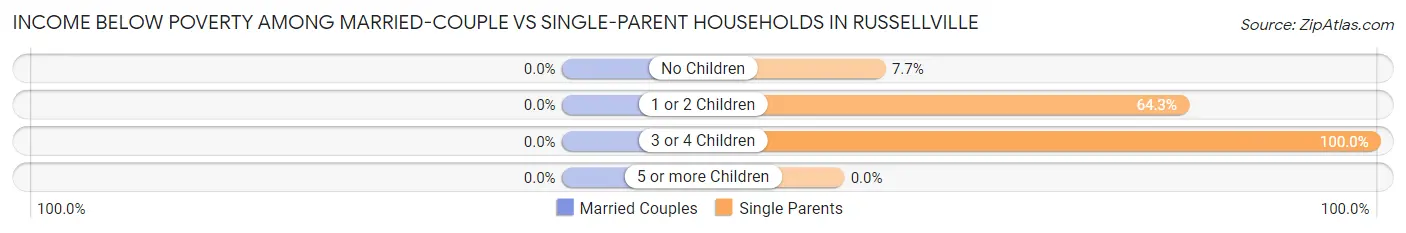
| Children | Married-Couple Families | Single-Parent Households |
| No Children | 0 (0.0%) | 1 (7.7%) |
| 1 or 2 Children | 0 (0.0%) | 9 (64.3%) |
| 3 or 4 Children | 0 (0.0%) | 13 (100.0%) |
| 5 or more Children | 0 (0.0%) | 0 (0.0%) |
| Total | 0 (0.0%) | 23 (57.5%) |
Race in Russellville
The most populous races in Russellville are White / Caucasian (388 | 99.2%), and Asian (3 | 0.8%).
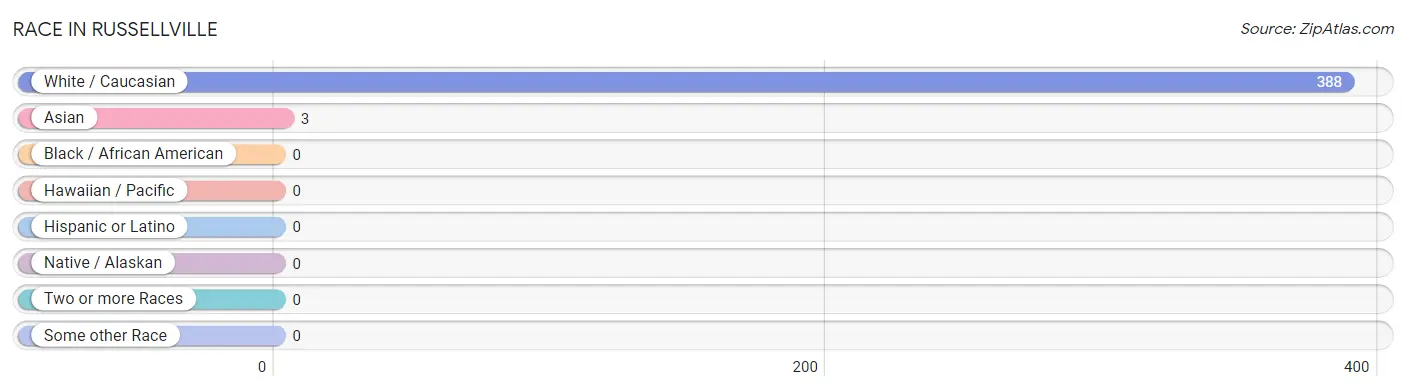
| Race | # Population | % Population |
| Asian | 3 | 0.8% |
| Black / African American | 0 | 0.0% |
| Hawaiian / Pacific | 0 | 0.0% |
| Hispanic or Latino | 0 | 0.0% |
| Native / Alaskan | 0 | 0.0% |
| White / Caucasian | 388 | 99.2% |
| Two or more Races | 0 | 0.0% |
| Some other Race | 0 | 0.0% |
| Total | 391 | 100.0% |
Ancestry in Russellville
The most populous ancestries reported in Russellville are German (81 | 20.7%), American (51 | 13.0%), Irish (12 | 3.1%), English (8 | 2.1%), and Italian (7 | 1.8%), together accounting for 40.7% of all Russellville residents.
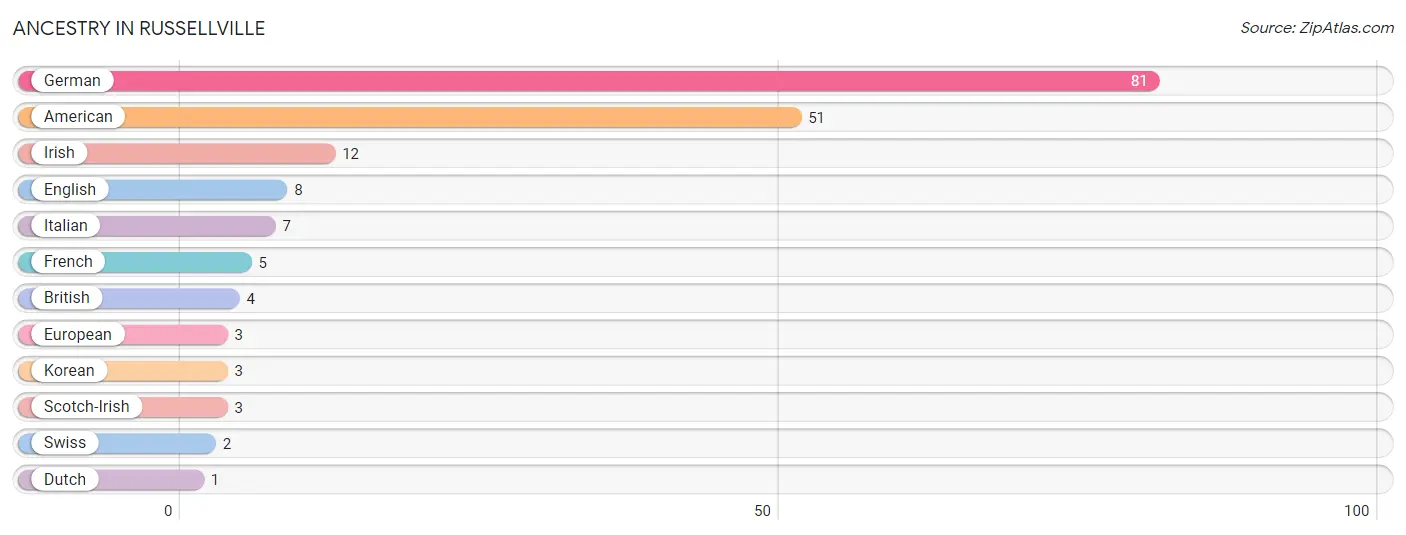
| Ancestry | # Population | % Population |
| American | 51 | 13.0% |
| British | 4 | 1.0% |
| Dutch | 1 | 0.3% |
| English | 8 | 2.1% |
| European | 3 | 0.8% |
| French | 5 | 1.3% |
| German | 81 | 20.7% |
| Irish | 12 | 3.1% |
| Italian | 7 | 1.8% |
| Korean | 3 | 0.8% |
| Scotch-Irish | 3 | 0.8% |
| Swiss | 2 | 0.5% | View All 12 Rows |
Immigrants in Russellville
The most numerous immigrant groups reported in Russellville came from Asia (3 | 0.8%), Philippines (3 | 0.8%), and South Eastern Asia (3 | 0.8%), together accounting for 2.3% of all Russellville residents.
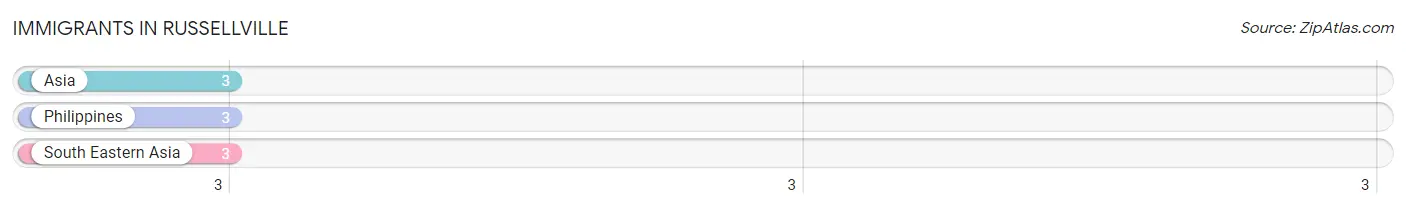
| Immigration Origin | # Population | % Population |
| Asia | 3 | 0.8% |
| Philippines | 3 | 0.8% |
| South Eastern Asia | 3 | 0.8% | View All 3 Rows |
Sex and Age in Russellville
Sex and Age in Russellville
The most populous age groups in Russellville are 35 to 39 Years (20 | 13.3%) for men and Under 5 Years (40 | 16.7%) for women.
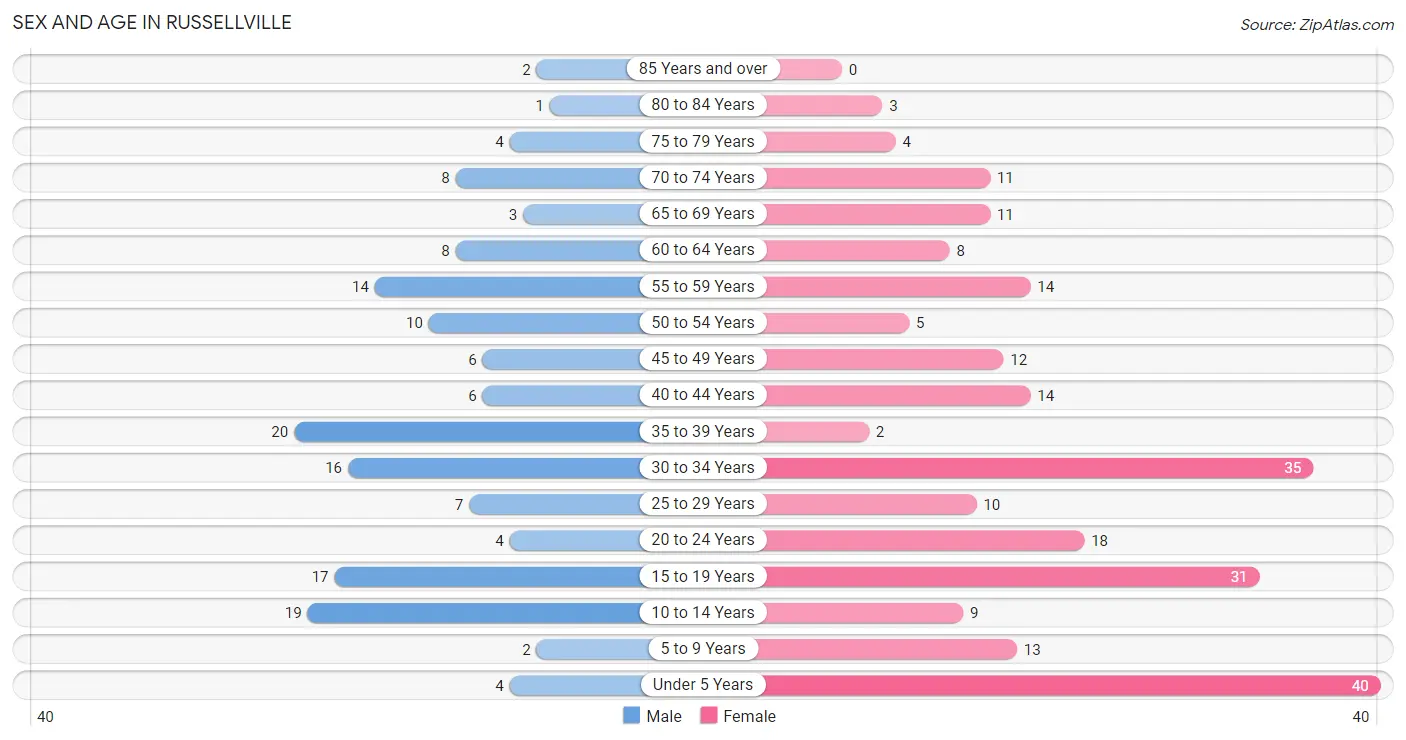
| Age Bracket | Male | Female |
| Under 5 Years | 4 (2.6%) | 40 (16.7%) |
| 5 to 9 Years | 2 (1.3%) | 13 (5.4%) |
| 10 to 14 Years | 19 (12.6%) | 9 (3.7%) |
| 15 to 19 Years | 17 (11.3%) | 31 (12.9%) |
| 20 to 24 Years | 4 (2.6%) | 18 (7.5%) |
| 25 to 29 Years | 7 (4.6%) | 10 (4.2%) |
| 30 to 34 Years | 16 (10.6%) | 35 (14.6%) |
| 35 to 39 Years | 20 (13.3%) | 2 (0.8%) |
| 40 to 44 Years | 6 (4.0%) | 14 (5.8%) |
| 45 to 49 Years | 6 (4.0%) | 12 (5.0%) |
| 50 to 54 Years | 10 (6.6%) | 5 (2.1%) |
| 55 to 59 Years | 14 (9.3%) | 14 (5.8%) |
| 60 to 64 Years | 8 (5.3%) | 8 (3.3%) |
| 65 to 69 Years | 3 (2.0%) | 11 (4.6%) |
| 70 to 74 Years | 8 (5.3%) | 11 (4.6%) |
| 75 to 79 Years | 4 (2.6%) | 4 (1.7%) |
| 80 to 84 Years | 1 (0.7%) | 3 (1.3%) |
| 85 Years and over | 2 (1.3%) | 0 (0.0%) |
| Total | 151 (100.0%) | 240 (100.0%) |
Families and Households in Russellville
Median Family Size in Russellville
The median family size in Russellville is 3.08 persons per family, with married-couple families (70 | 63.6%) accounting for the largest median family size of 3.33 persons per family. On the other hand, single male/father families (6 | 5.4%) represent the smallest median family size with 2.00 persons per family.
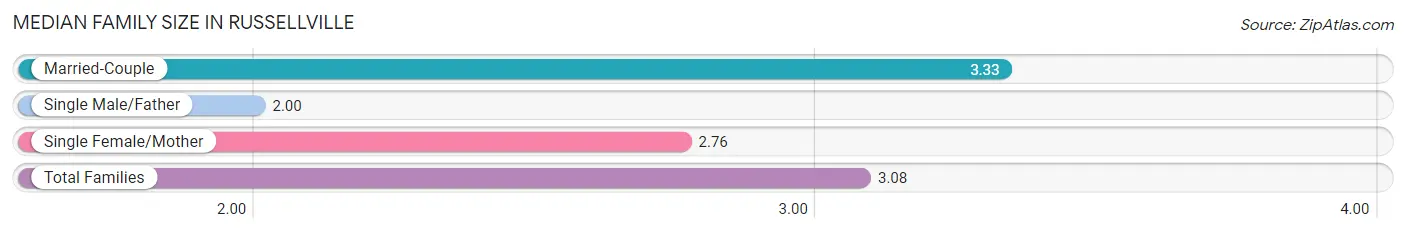
| Family Type | # Families | Family Size |
| Married-Couple | 70 (63.6%) | 3.33 |
| Single Male/Father | 6 (5.4%) | 2.00 |
| Single Female/Mother | 34 (30.9%) | 2.76 |
| Total Families | 110 (100.0%) | 3.08 |
Median Household Size in Russellville
The median household size in Russellville is 2.75 persons per household, with married-couple households (70 | 49.3%) accounting for the largest median household size of 3.44 persons per household. non-family households (32 | 22.5%) represent the smallest median household size with 1.09 persons per household.
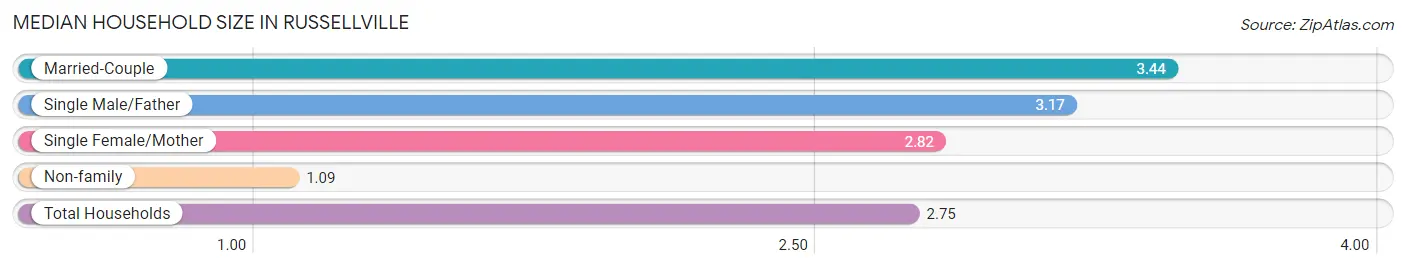
| Household Type | # Households | Household Size |
| Married-Couple | 70 (49.3%) | 3.44 |
| Single Male/Father | 6 (4.2%) | 3.17 |
| Single Female/Mother | 34 (23.9%) | 2.82 |
| Non-family | 32 (22.5%) | 1.09 |
| Total Households | 142 (100.0%) | 2.75 |
Household Size by Marriage Status in Russellville
Out of a total of 142 households in Russellville, 110 (77.5%) are family households, while 32 (22.5%) are nonfamily households. The most numerous type of family households are 2-person households, comprising 42, and the most common type of nonfamily households are 1-person households, comprising 29.
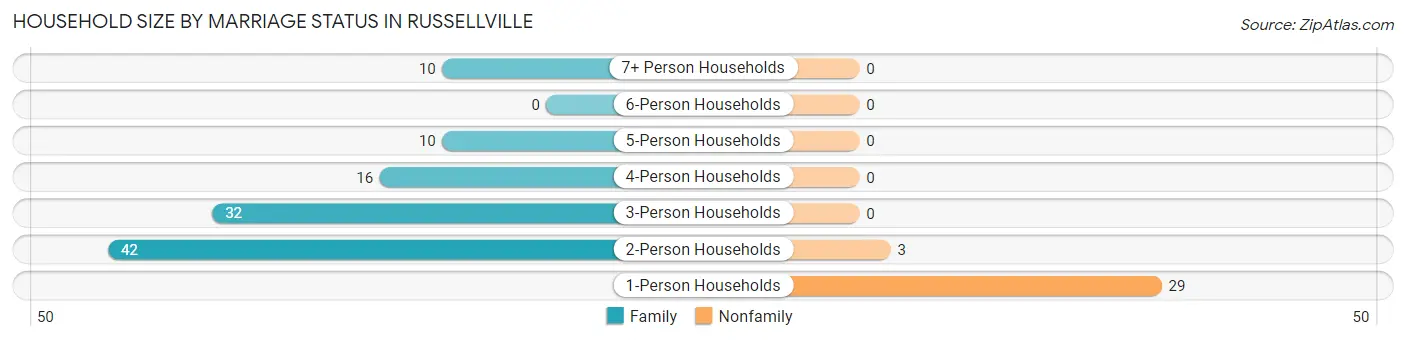
| Household Size | Family Households | Nonfamily Households |
| 1-Person Households | - | 29 (20.4%) |
| 2-Person Households | 42 (29.6%) | 3 (2.1%) |
| 3-Person Households | 32 (22.5%) | 0 (0.0%) |
| 4-Person Households | 16 (11.3%) | 0 (0.0%) |
| 5-Person Households | 10 (7.0%) | 0 (0.0%) |
| 6-Person Households | 0 (0.0%) | 0 (0.0%) |
| 7+ Person Households | 10 (7.0%) | 0 (0.0%) |
| Total | 110 (77.5%) | 32 (22.5%) |
Female Fertility in Russellville
Fertility by Age in Russellville
Average fertility rate in Russellville is 73.0 births per 1,000 women. Women in the age bracket of 20 to 34 years have the highest fertility rate with 143.0 births per 1,000 women. Women in the age bracket of 20 to 34 years acount for 100.0% of all women with births.
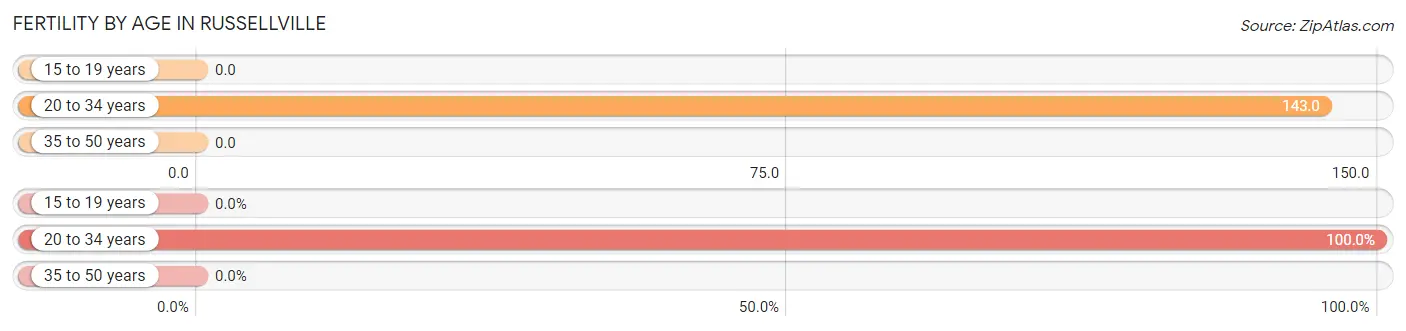
| Age Bracket | Women with Births | Births / 1,000 Women |
| 15 to 19 years | 0 (0.0%) | 0.0 |
| 20 to 34 years | 9 (100.0%) | 143.0 |
| 35 to 50 years | 0 (0.0%) | 0.0 |
| Total | 9 (100.0%) | 73.0 |
Fertility by Age by Marriage Status in Russellville
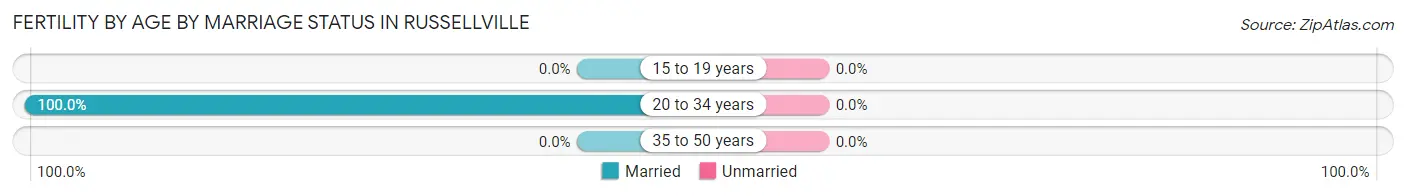
| Age Bracket | Married | Unmarried |
| 15 to 19 years | 0 (0.0%) | 0 (0.0%) |
| 20 to 34 years | 9 (100.0%) | 0 (0.0%) |
| 35 to 50 years | 0 (0.0%) | 0 (0.0%) |
| Total | 9 (100.0%) | 0 (0.0%) |
Fertility by Education in Russellville
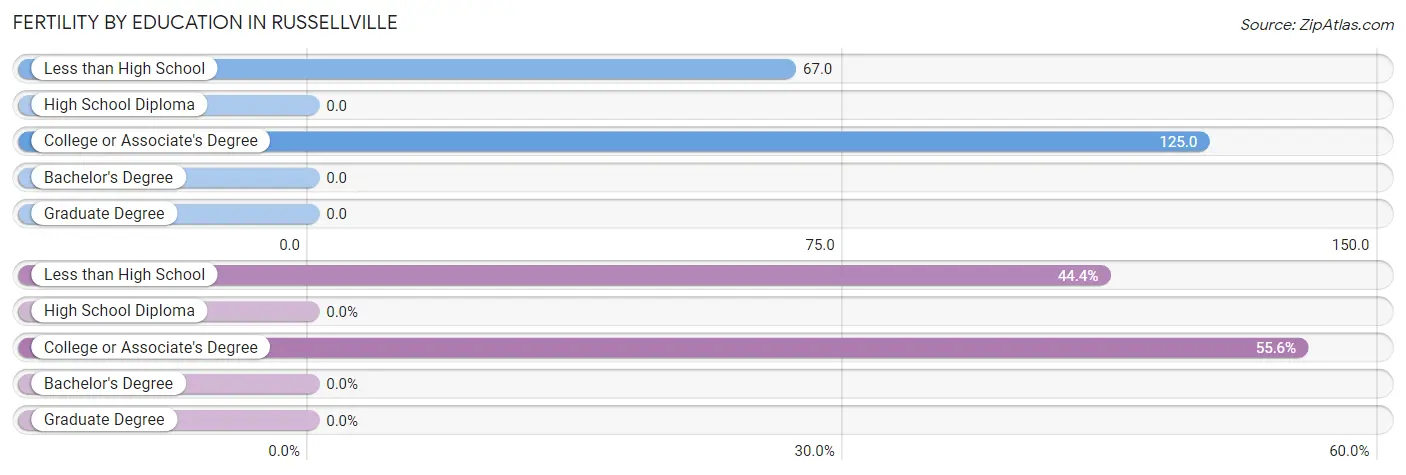
| Educational Attainment | Women with Births | Births / 1,000 Women |
| Less than High School | 4 (44.4%) | 67.0 |
| High School Diploma | 0 (0.0%) | 0.0 |
| College or Associate's Degree | 5 (55.6%) | 125.0 |
| Bachelor's Degree | 0 (0.0%) | 0.0 |
| Graduate Degree | 0 (0.0%) | 0.0 |
| Total | 9 (100.0%) | 73.0 |
Fertility by Education by Marriage Status in Russellville
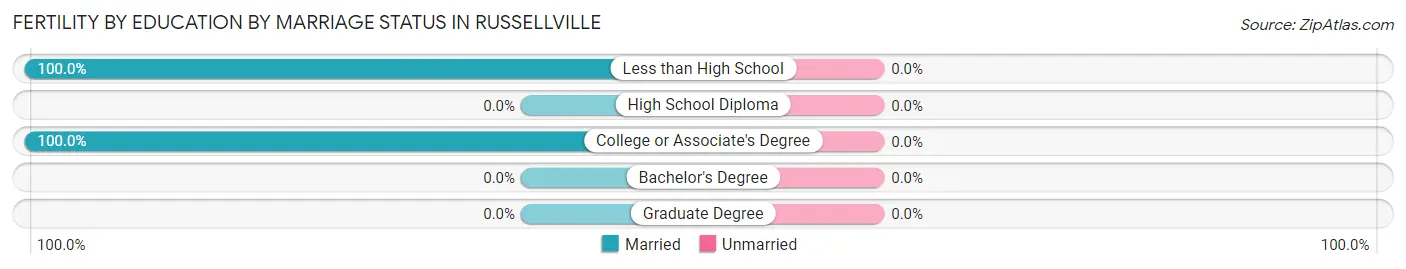
| Educational Attainment | Married | Unmarried |
| Less than High School | 4 (100.0%) | 0 (0.0%) |
| High School Diploma | 0 (0.0%) | 0 (0.0%) |
| College or Associate's Degree | 5 (100.0%) | 0 (0.0%) |
| Bachelor's Degree | 0 (0.0%) | 0 (0.0%) |
| Graduate Degree | 0 (0.0%) | 0 (0.0%) |
| Total | 9 (100.0%) | 0 (0.0%) |
Employment Characteristics in Russellville
Employment by Class of Employer in Russellville
Among the 197 employed individuals in Russellville, private company employees (135 | 68.5%), not-for-profit organizations (21 | 10.7%), and local government employees (21 | 10.7%) make up the most common classes of employment.
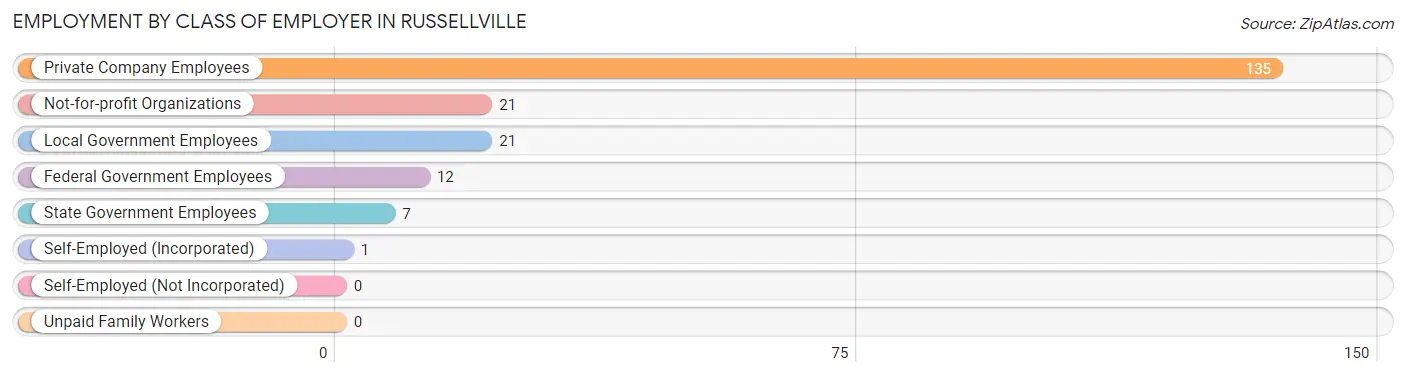
| Employer Class | # Employees | % Employees |
| Private Company Employees | 135 | 68.5% |
| Self-Employed (Incorporated) | 1 | 0.5% |
| Self-Employed (Not Incorporated) | 0 | 0.0% |
| Not-for-profit Organizations | 21 | 10.7% |
| Local Government Employees | 21 | 10.7% |
| State Government Employees | 7 | 3.5% |
| Federal Government Employees | 12 | 6.1% |
| Unpaid Family Workers | 0 | 0.0% |
| Total | 197 | 100.0% |
Employment Status by Age in Russellville
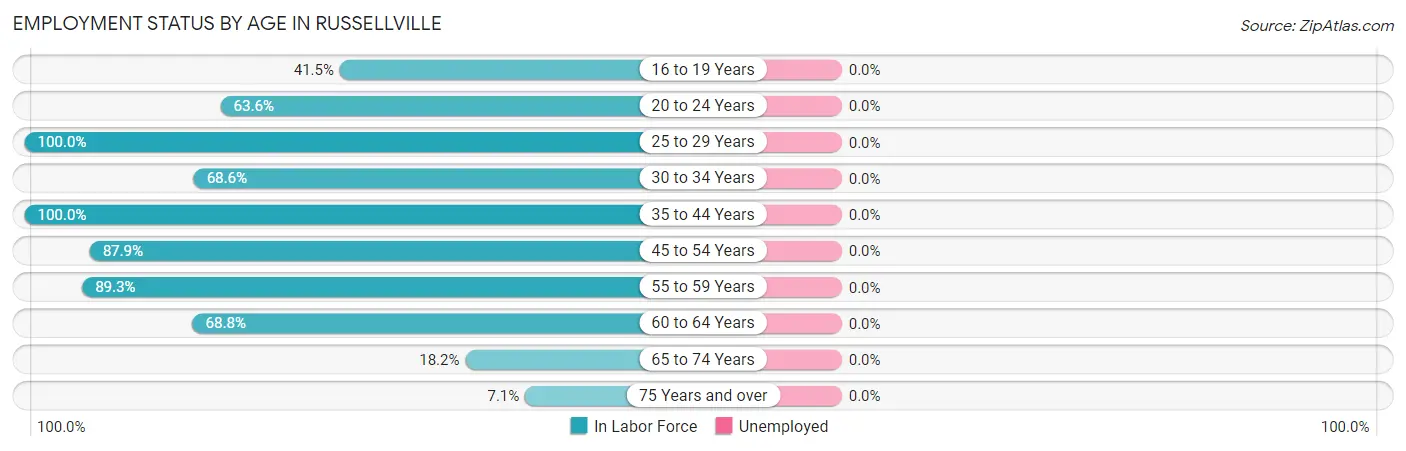
| Age Bracket | In Labor Force | Unemployed |
| 16 to 19 Years | 17 (41.5%) | 0 (0.0%) |
| 20 to 24 Years | 14 (63.6%) | 0 (0.0%) |
| 25 to 29 Years | 17 (100.0%) | 0 (0.0%) |
| 30 to 34 Years | 35 (68.6%) | 0 (0.0%) |
| 35 to 44 Years | 42 (100.0%) | 0 (0.0%) |
| 45 to 54 Years | 29 (87.9%) | 0 (0.0%) |
| 55 to 59 Years | 25 (89.3%) | 0 (0.0%) |
| 60 to 64 Years | 11 (68.8%) | 0 (0.0%) |
| 65 to 74 Years | 6 (18.2%) | 0 (0.0%) |
| 75 Years and over | 1 (7.1%) | 0 (0.0%) |
| Total | 197 (66.3%) | 0 (0.0%) |
Employment Status by Educational Attainment in Russellville
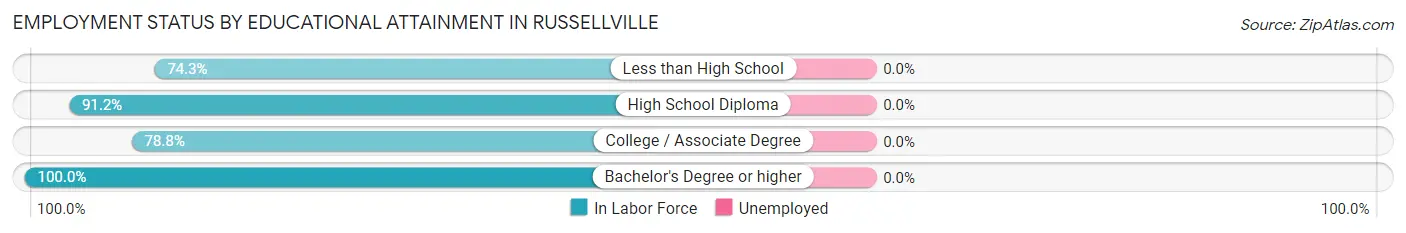
| Educational Attainment | In Labor Force | Unemployed |
| Less than High School | 26 (74.3%) | 0 (0.0%) |
| High School Diploma | 83 (91.2%) | 0 (0.0%) |
| College / Associate Degree | 41 (78.8%) | 0 (0.0%) |
| Bachelor's Degree or higher | 9 (100.0%) | 0 (0.0%) |
| Total | 159 (85.0%) | 0 (0.0%) |
Employment Occupations by Sex in Russellville
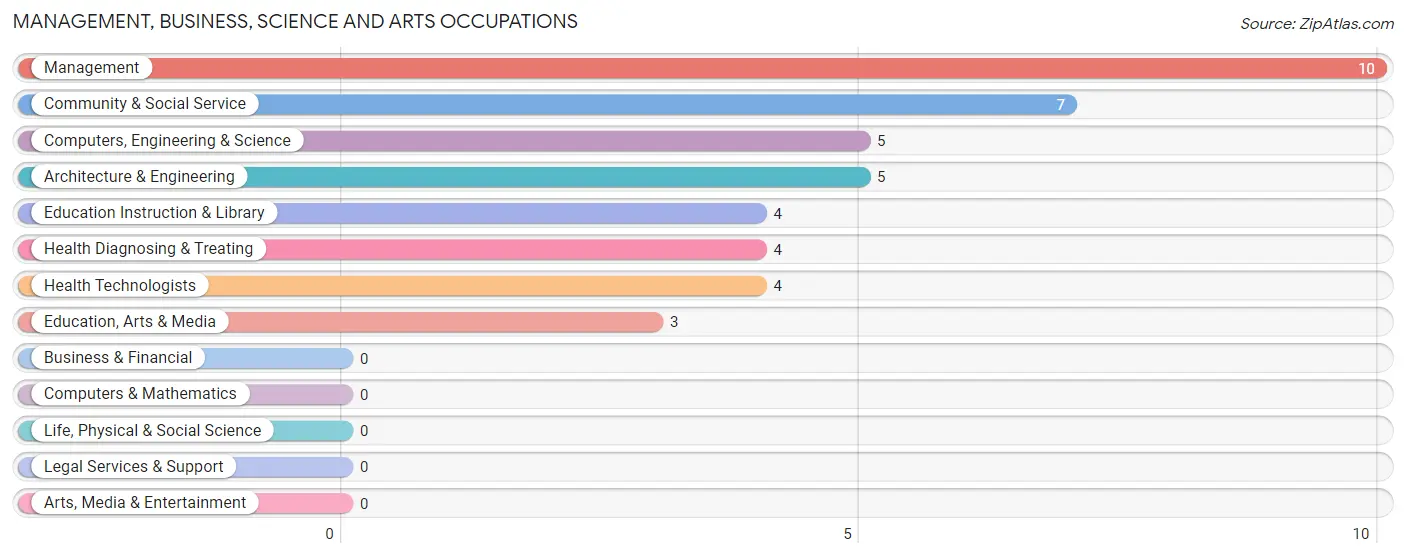
Management, Business, Science and Arts Occupations
The most common Management, Business, Science and Arts occupations in Russellville are Management (10 | 5.1%), Community & Social Service (7 | 3.5%), Computers, Engineering & Science (5 | 2.5%), Architecture & Engineering (5 | 2.5%), and Education Instruction & Library (4 | 2.0%).
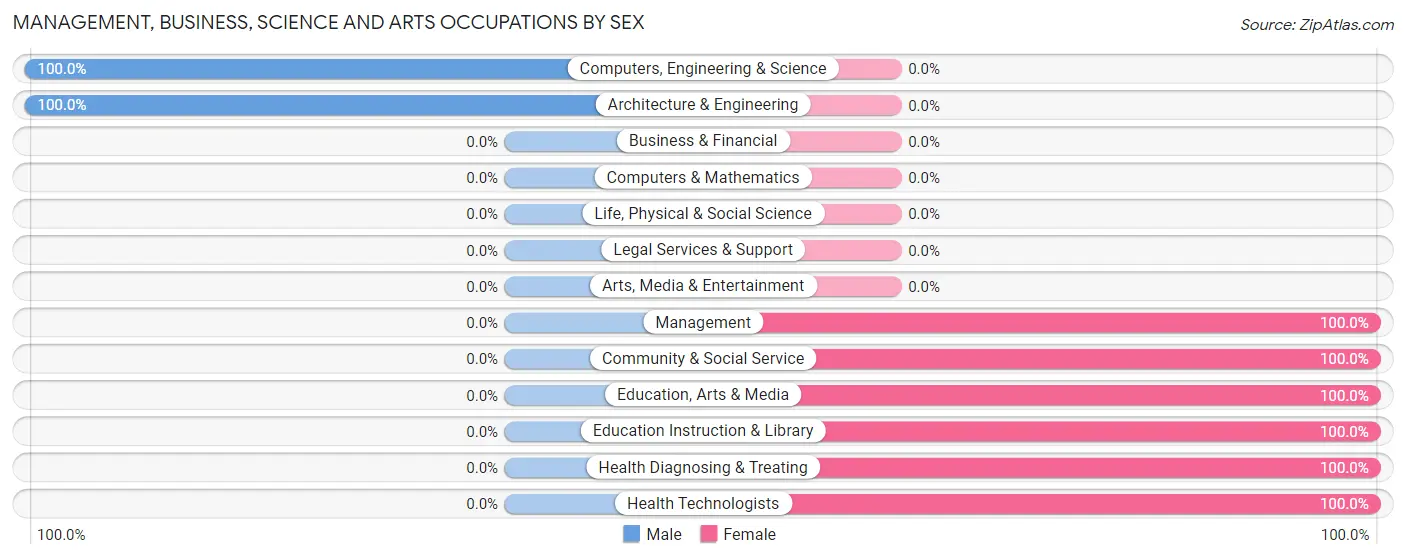
Management, Business, Science and Arts Occupations by Sex
Within the Management, Business, Science and Arts occupations in Russellville, the most male-oriented occupations are Computers, Engineering & Science (100.0%), and Architecture & Engineering (100.0%), while the most female-oriented occupations are Management (100.0%), Community & Social Service (100.0%), and Education, Arts & Media (100.0%).
| Occupation | Male | Female |
| Management | 0 (0.0%) | 10 (100.0%) |
| Business & Financial | 0 (0.0%) | 0 (0.0%) |
| Computers, Engineering & Science | 5 (100.0%) | 0 (0.0%) |
| Computers & Mathematics | 0 (0.0%) | 0 (0.0%) |
| Architecture & Engineering | 5 (100.0%) | 0 (0.0%) |
| Life, Physical & Social Science | 0 (0.0%) | 0 (0.0%) |
| Community & Social Service | 0 (0.0%) | 7 (100.0%) |
| Education, Arts & Media | 0 (0.0%) | 3 (100.0%) |
| Legal Services & Support | 0 (0.0%) | 0 (0.0%) |
| Education Instruction & Library | 0 (0.0%) | 4 (100.0%) |
| Arts, Media & Entertainment | 0 (0.0%) | 0 (0.0%) |
| Health Diagnosing & Treating | 0 (0.0%) | 4 (100.0%) |
| Health Technologists | 0 (0.0%) | 4 (100.0%) |
| Total (Category) | 5 (19.2%) | 21 (80.8%) |
| Total (Overall) | 85 (43.1%) | 112 (56.9%) |
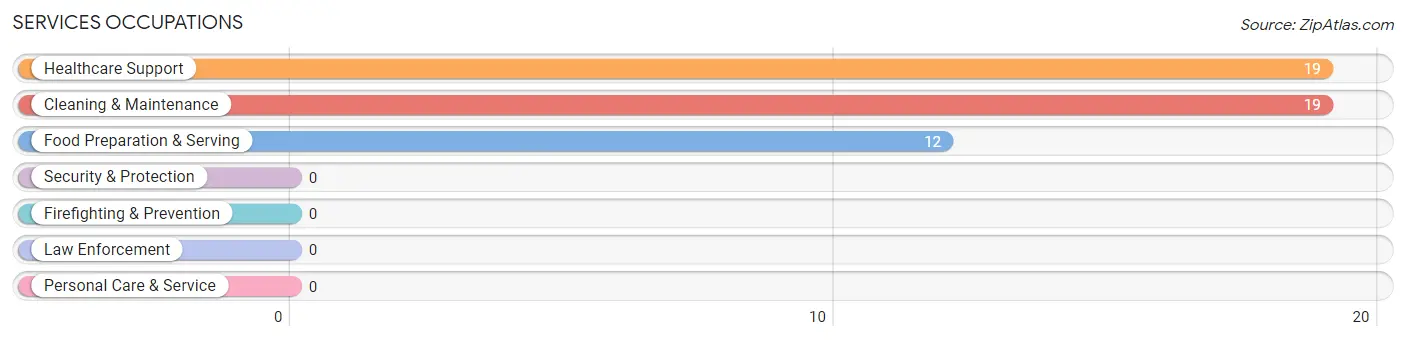
Services Occupations
The most common Services occupations in Russellville are Healthcare Support (19 | 9.6%), Cleaning & Maintenance (19 | 9.6%), and Food Preparation & Serving (12 | 6.1%).
Services Occupations by Sex
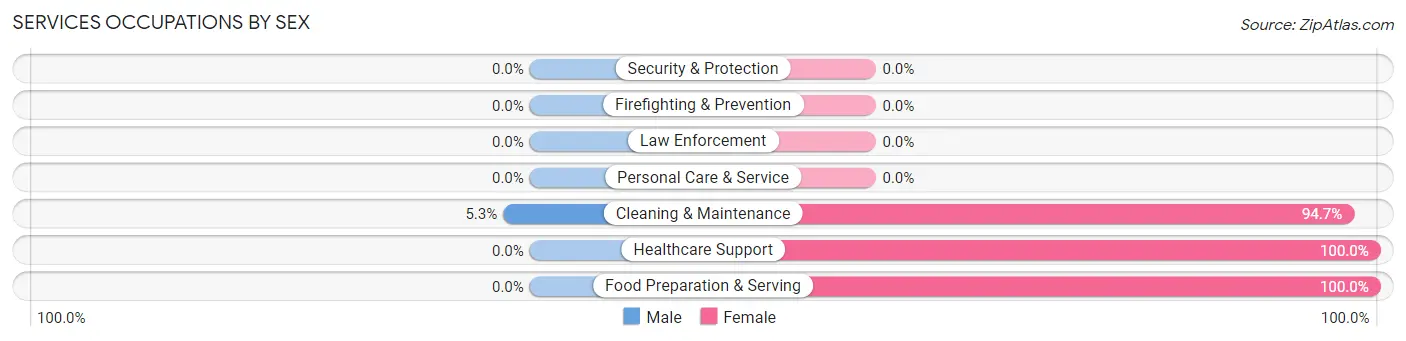
| Occupation | Male | Female |
| Healthcare Support | 0 (0.0%) | 19 (100.0%) |
| Security & Protection | 0 (0.0%) | 0 (0.0%) |
| Firefighting & Prevention | 0 (0.0%) | 0 (0.0%) |
| Law Enforcement | 0 (0.0%) | 0 (0.0%) |
| Food Preparation & Serving | 0 (0.0%) | 12 (100.0%) |
| Cleaning & Maintenance | 1 (5.3%) | 18 (94.7%) |
| Personal Care & Service | 0 (0.0%) | 0 (0.0%) |
| Total (Category) | 1 (2.0%) | 49 (98.0%) |
| Total (Overall) | 85 (43.1%) | 112 (56.9%) |
Sales and Office Occupations
The most common Sales and Office occupations in Russellville are Office & Administration (25 | 12.7%), and Sales & Related (2 | 1.0%).
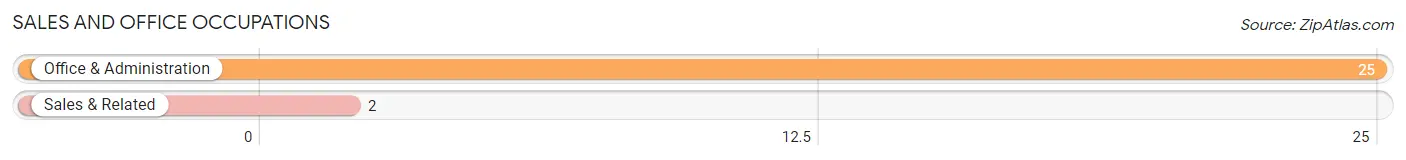
Sales and Office Occupations by Sex
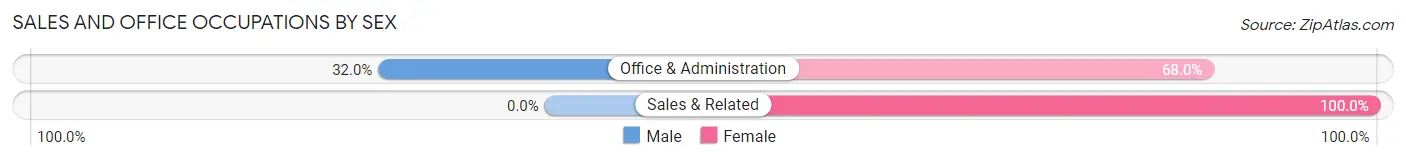
| Occupation | Male | Female |
| Sales & Related | 0 (0.0%) | 2 (100.0%) |
| Office & Administration | 8 (32.0%) | 17 (68.0%) |
| Total (Category) | 8 (29.6%) | 19 (70.4%) |
| Total (Overall) | 85 (43.1%) | 112 (56.9%) |
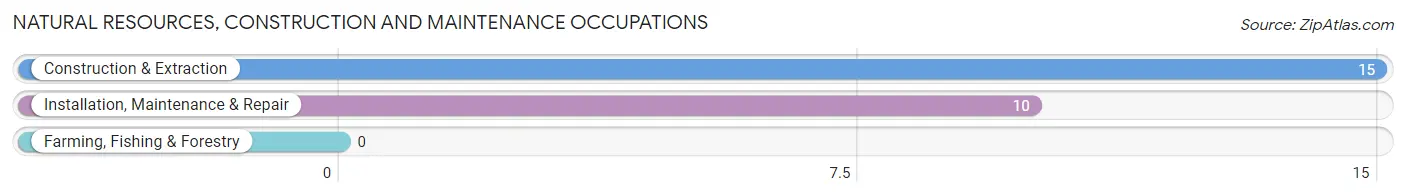
Natural Resources, Construction and Maintenance Occupations
The most common Natural Resources, Construction and Maintenance occupations in Russellville are Construction & Extraction (15 | 7.6%), and Installation, Maintenance & Repair (10 | 5.1%).
Natural Resources, Construction and Maintenance Occupations by Sex
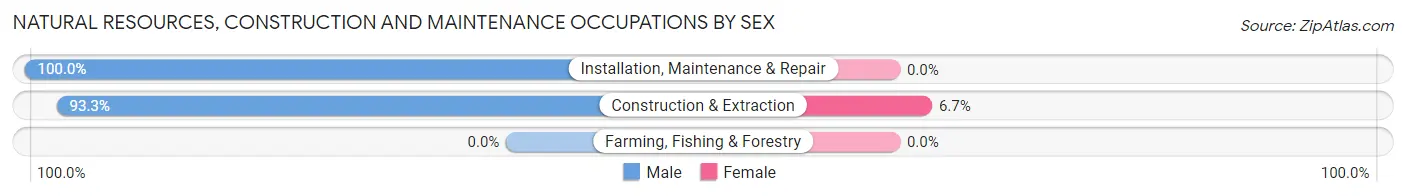
| Occupation | Male | Female |
| Farming, Fishing & Forestry | 0 (0.0%) | 0 (0.0%) |
| Construction & Extraction | 14 (93.3%) | 1 (6.7%) |
| Installation, Maintenance & Repair | 10 (100.0%) | 0 (0.0%) |
| Total (Category) | 24 (96.0%) | 1 (4.0%) |
| Total (Overall) | 85 (43.1%) | 112 (56.9%) |
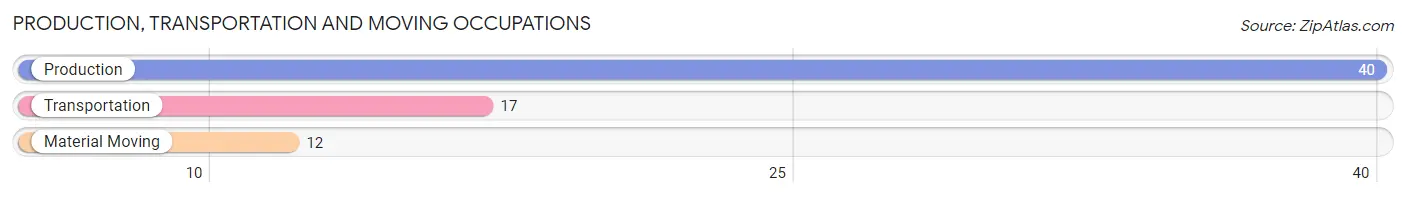
Production, Transportation and Moving Occupations
The most common Production, Transportation and Moving occupations in Russellville are Production (40 | 20.3%), Transportation (17 | 8.6%), and Material Moving (12 | 6.1%).
Production, Transportation and Moving Occupations by Sex
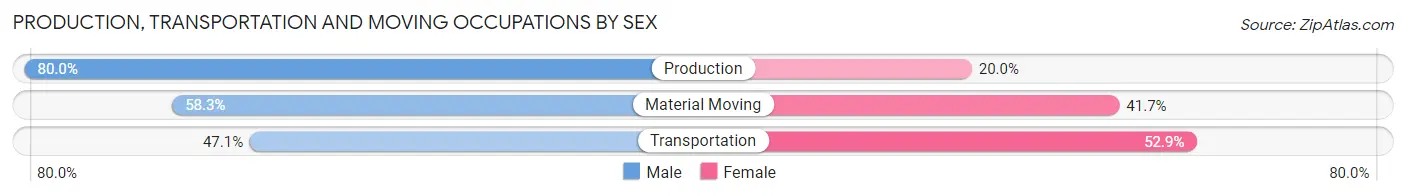
| Occupation | Male | Female |
| Production | 32 (80.0%) | 8 (20.0%) |
| Transportation | 8 (47.1%) | 9 (52.9%) |
| Material Moving | 7 (58.3%) | 5 (41.7%) |
| Total (Category) | 47 (68.1%) | 22 (31.9%) |
| Total (Overall) | 85 (43.1%) | 112 (56.9%) |
Employment Industries by Sex in Russellville
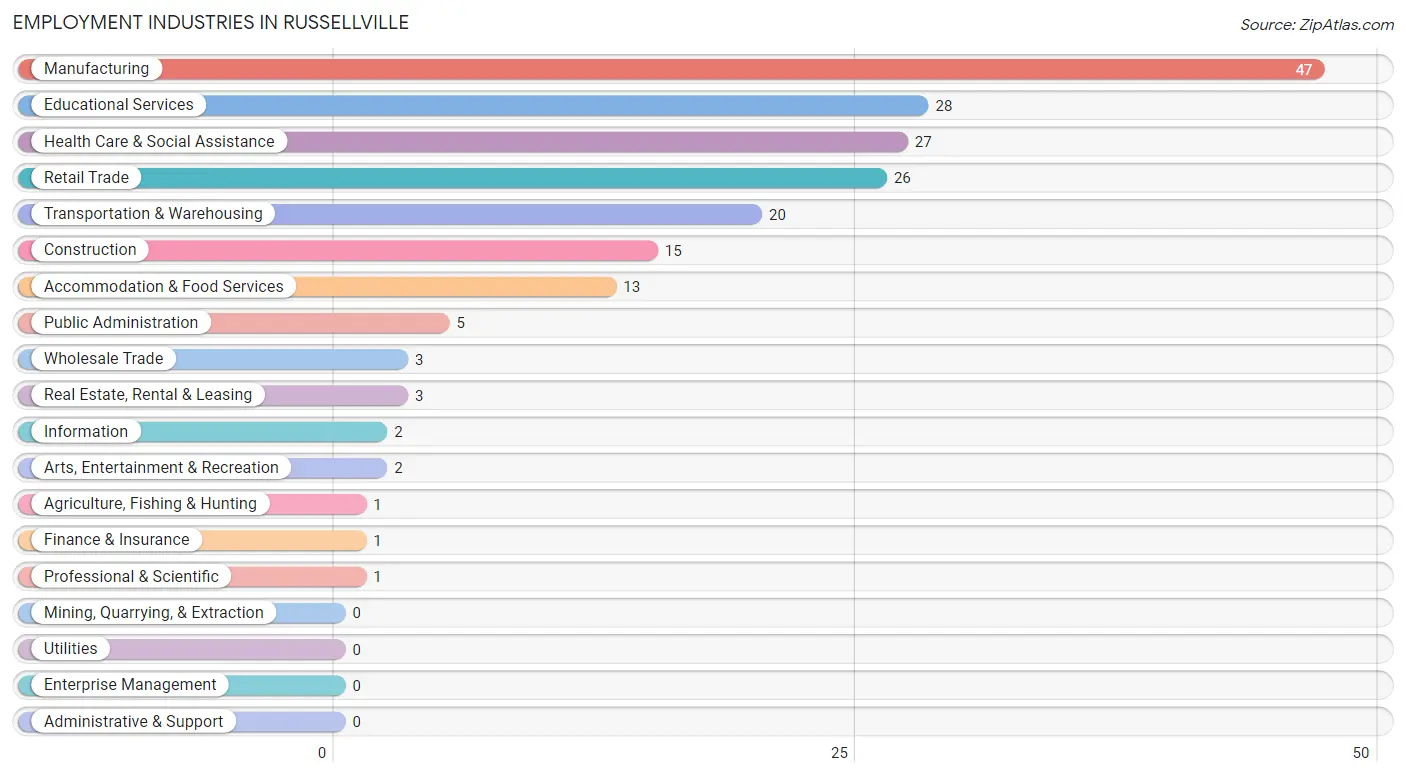
Employment Industries in Russellville
The major employment industries in Russellville include Manufacturing (47 | 23.9%), Educational Services (28 | 14.2%), Health Care & Social Assistance (27 | 13.7%), Retail Trade (26 | 13.2%), and Transportation & Warehousing (20 | 10.2%).
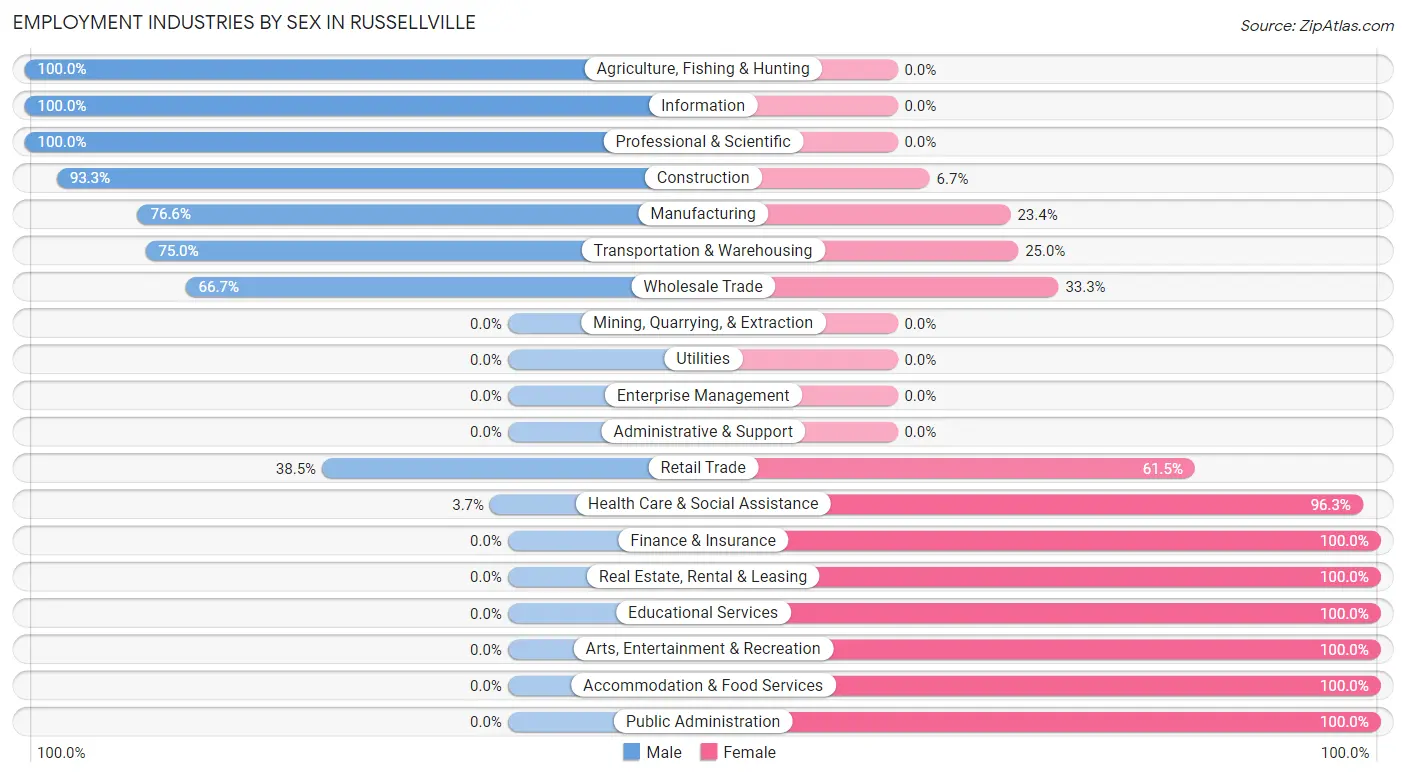
Employment Industries by Sex in Russellville
The Russellville industries that see more men than women are Agriculture, Fishing & Hunting (100.0%), Information (100.0%), and Professional & Scientific (100.0%), whereas the industries that tend to have a higher number of women are Finance & Insurance (100.0%), Real Estate, Rental & Leasing (100.0%), and Educational Services (100.0%).
| Industry | Male | Female |
| Agriculture, Fishing & Hunting | 1 (100.0%) | 0 (0.0%) |
| Mining, Quarrying, & Extraction | 0 (0.0%) | 0 (0.0%) |
| Construction | 14 (93.3%) | 1 (6.7%) |
| Manufacturing | 36 (76.6%) | 11 (23.4%) |
| Wholesale Trade | 2 (66.7%) | 1 (33.3%) |
| Retail Trade | 10 (38.5%) | 16 (61.5%) |
| Transportation & Warehousing | 15 (75.0%) | 5 (25.0%) |
| Utilities | 0 (0.0%) | 0 (0.0%) |
| Information | 2 (100.0%) | 0 (0.0%) |
| Finance & Insurance | 0 (0.0%) | 1 (100.0%) |
| Real Estate, Rental & Leasing | 0 (0.0%) | 3 (100.0%) |
| Professional & Scientific | 1 (100.0%) | 0 (0.0%) |
| Enterprise Management | 0 (0.0%) | 0 (0.0%) |
| Administrative & Support | 0 (0.0%) | 0 (0.0%) |
| Educational Services | 0 (0.0%) | 28 (100.0%) |
| Health Care & Social Assistance | 1 (3.7%) | 26 (96.3%) |
| Arts, Entertainment & Recreation | 0 (0.0%) | 2 (100.0%) |
| Accommodation & Food Services | 0 (0.0%) | 13 (100.0%) |
| Public Administration | 0 (0.0%) | 5 (100.0%) |
| Total | 85 (43.1%) | 112 (56.9%) |
Education in Russellville
School Enrollment in Russellville
The most common levels of schooling among the 89 students in Russellville are high school (40 | 44.9%), elementary school (24 | 27.0%), and middle school (11 | 12.4%).
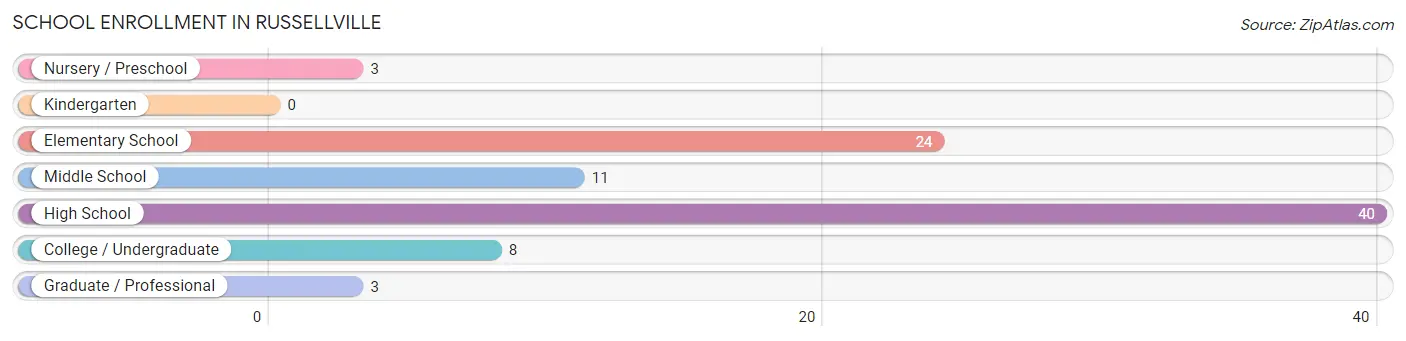
| School Level | # Students | % Students |
| Nursery / Preschool | 3 | 3.4% |
| Kindergarten | 0 | 0.0% |
| Elementary School | 24 | 27.0% |
| Middle School | 11 | 12.4% |
| High School | 40 | 44.9% |
| College / Undergraduate | 8 | 9.0% |
| Graduate / Professional | 3 | 3.4% |
| Total | 89 | 100.0% |
School Enrollment by Age by Funding Source in Russellville
Out of a total of 89 students who are enrolled in schools in Russellville, 5 (5.6%) attend a private institution, while the remaining 84 (94.4%) are enrolled in public schools. The age group of 18 to 19 year olds has the highest likelihood of being enrolled in private schools, with 3 (75.0% in the age bracket) enrolled. Conversely, the age group of 3 to 4 year olds has the lowest likelihood of being enrolled in a private school, with 3 (100.0% in the age bracket) attending a public institution.
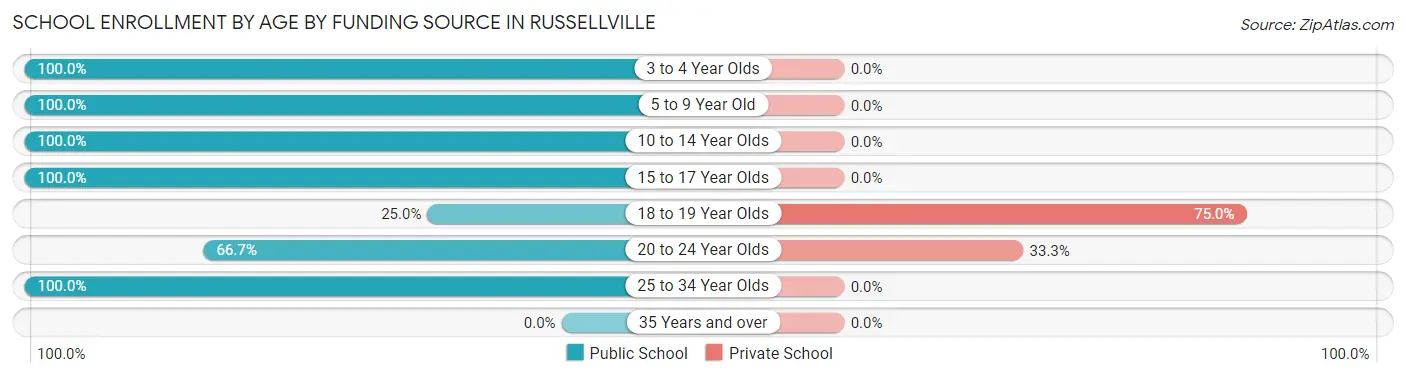
| Age Bracket | Public School | Private School |
| 3 to 4 Year Olds | 3 (100.0%) | 0 (0.0%) |
| 5 to 9 Year Old | 15 (100.0%) | 0 (0.0%) |
| 10 to 14 Year Olds | 28 (100.0%) | 0 (0.0%) |
| 15 to 17 Year Olds | 29 (100.0%) | 0 (0.0%) |
| 18 to 19 Year Olds | 1 (25.0%) | 3 (75.0%) |
| 20 to 24 Year Olds | 4 (66.7%) | 2 (33.3%) |
| 25 to 34 Year Olds | 4 (100.0%) | 0 (0.0%) |
| 35 Years and over | 0 (0.0%) | 0 (0.0%) |
| Total | 84 (94.4%) | 5 (5.6%) |
Educational Attainment by Field of Study in Russellville
Business (4 | 25.0%), psychology (3 | 18.8%), science & technology (3 | 18.8%), education (2 | 12.5%), and arts & humanities (2 | 12.5%) are the most common fields of study among 16 individuals in Russellville who have obtained a bachelor's degree or higher.
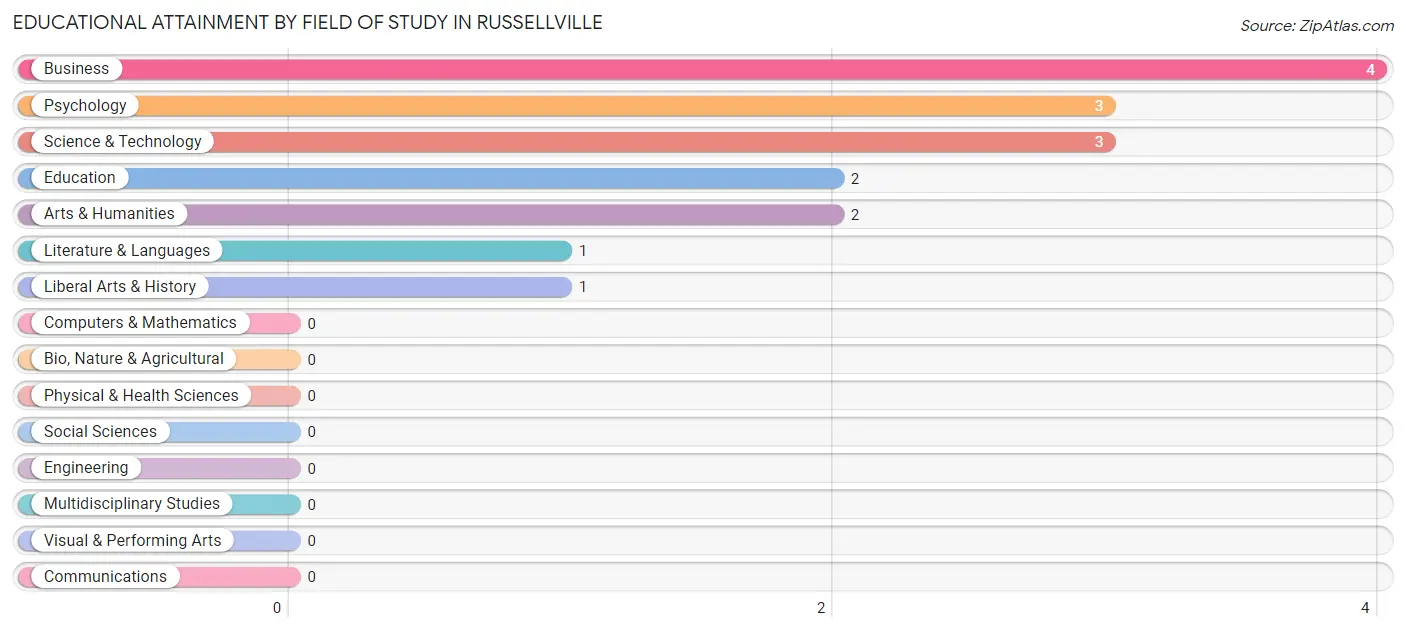
| Field of Study | # Graduates | % Graduates |
| Computers & Mathematics | 0 | 0.0% |
| Bio, Nature & Agricultural | 0 | 0.0% |
| Physical & Health Sciences | 0 | 0.0% |
| Psychology | 3 | 18.8% |
| Social Sciences | 0 | 0.0% |
| Engineering | 0 | 0.0% |
| Multidisciplinary Studies | 0 | 0.0% |
| Science & Technology | 3 | 18.8% |
| Business | 4 | 25.0% |
| Education | 2 | 12.5% |
| Literature & Languages | 1 | 6.2% |
| Liberal Arts & History | 1 | 6.2% |
| Visual & Performing Arts | 0 | 0.0% |
| Communications | 0 | 0.0% |
| Arts & Humanities | 2 | 12.5% |
| Total | 16 | 100.0% |
Transportation & Commute in Russellville
Vehicle Availability by Sex in Russellville
The most prevalent vehicle ownership categories in Russellville are males with 2 vehicles (24, accounting for 28.2%) and females with 2 vehicles (30, making up 21.4%).
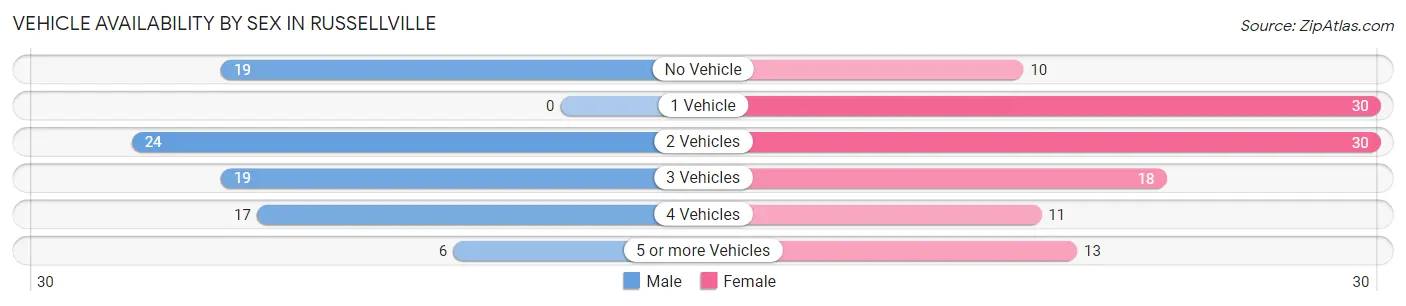
| Vehicles Available | Male | Female |
| No Vehicle | 19 (22.4%) | 10 (8.9%) |
| 1 Vehicle | 0 (0.0%) | 30 (26.8%) |
| 2 Vehicles | 24 (28.2%) | 30 (26.8%) |
| 3 Vehicles | 19 (22.4%) | 18 (16.1%) |
| 4 Vehicles | 17 (20.0%) | 11 (9.8%) |
| 5 or more Vehicles | 6 (7.1%) | 13 (11.6%) |
| Total | 85 (100.0%) | 112 (100.0%) |
Commute Time in Russellville
The most frequently occuring commute durations in Russellville are 30 to 34 minutes (41 commuters, 22.4%), 20 to 24 minutes (39 commuters, 21.3%), and 60 to 89 minutes (29 commuters, 15.9%).
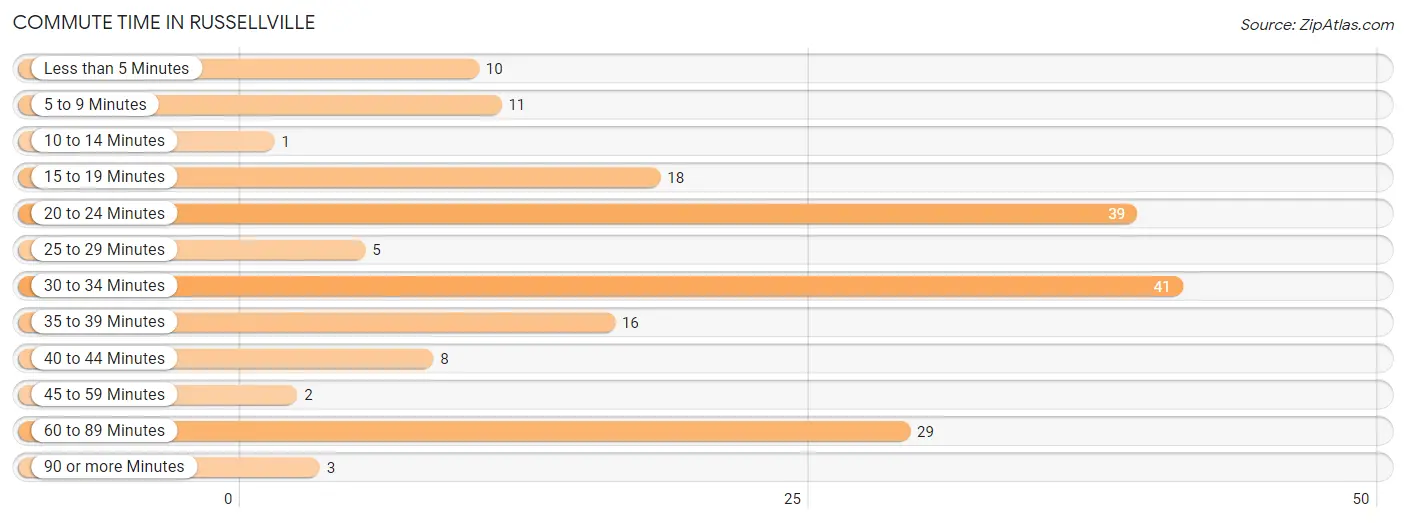
| Commute Time | # Commuters | % Commuters |
| Less than 5 Minutes | 10 | 5.5% |
| 5 to 9 Minutes | 11 | 6.0% |
| 10 to 14 Minutes | 1 | 0.5% |
| 15 to 19 Minutes | 18 | 9.8% |
| 20 to 24 Minutes | 39 | 21.3% |
| 25 to 29 Minutes | 5 | 2.7% |
| 30 to 34 Minutes | 41 | 22.4% |
| 35 to 39 Minutes | 16 | 8.7% |
| 40 to 44 Minutes | 8 | 4.4% |
| 45 to 59 Minutes | 2 | 1.1% |
| 60 to 89 Minutes | 29 | 15.9% |
| 90 or more Minutes | 3 | 1.6% |
Commute Time by Sex in Russellville
The most common commute times in Russellville are 60 to 89 minutes (27 commuters, 31.8%) for males and 30 to 34 minutes (31 commuters, 31.6%) for females.
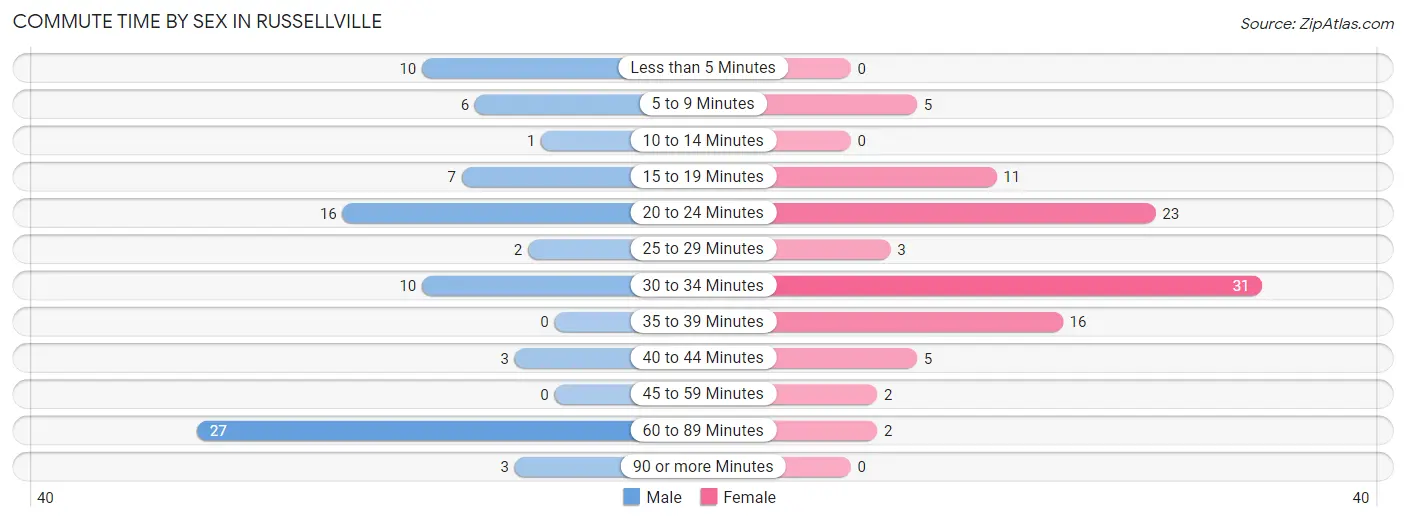
| Commute Time | Male | Female |
| Less than 5 Minutes | 10 (11.8%) | 0 (0.0%) |
| 5 to 9 Minutes | 6 (7.1%) | 5 (5.1%) |
| 10 to 14 Minutes | 1 (1.2%) | 0 (0.0%) |
| 15 to 19 Minutes | 7 (8.2%) | 11 (11.2%) |
| 20 to 24 Minutes | 16 (18.8%) | 23 (23.5%) |
| 25 to 29 Minutes | 2 (2.4%) | 3 (3.1%) |
| 30 to 34 Minutes | 10 (11.8%) | 31 (31.6%) |
| 35 to 39 Minutes | 0 (0.0%) | 16 (16.3%) |
| 40 to 44 Minutes | 3 (3.5%) | 5 (5.1%) |
| 45 to 59 Minutes | 0 (0.0%) | 2 (2.0%) |
| 60 to 89 Minutes | 27 (31.8%) | 2 (2.0%) |
| 90 or more Minutes | 3 (3.5%) | 0 (0.0%) |
Time of Departure to Work by Sex in Russellville
The most frequent times of departure to work in Russellville are 6:00 AM to 6:29 AM (29, 34.1%) for males and 6:00 AM to 6:29 AM (26, 26.5%) for females.
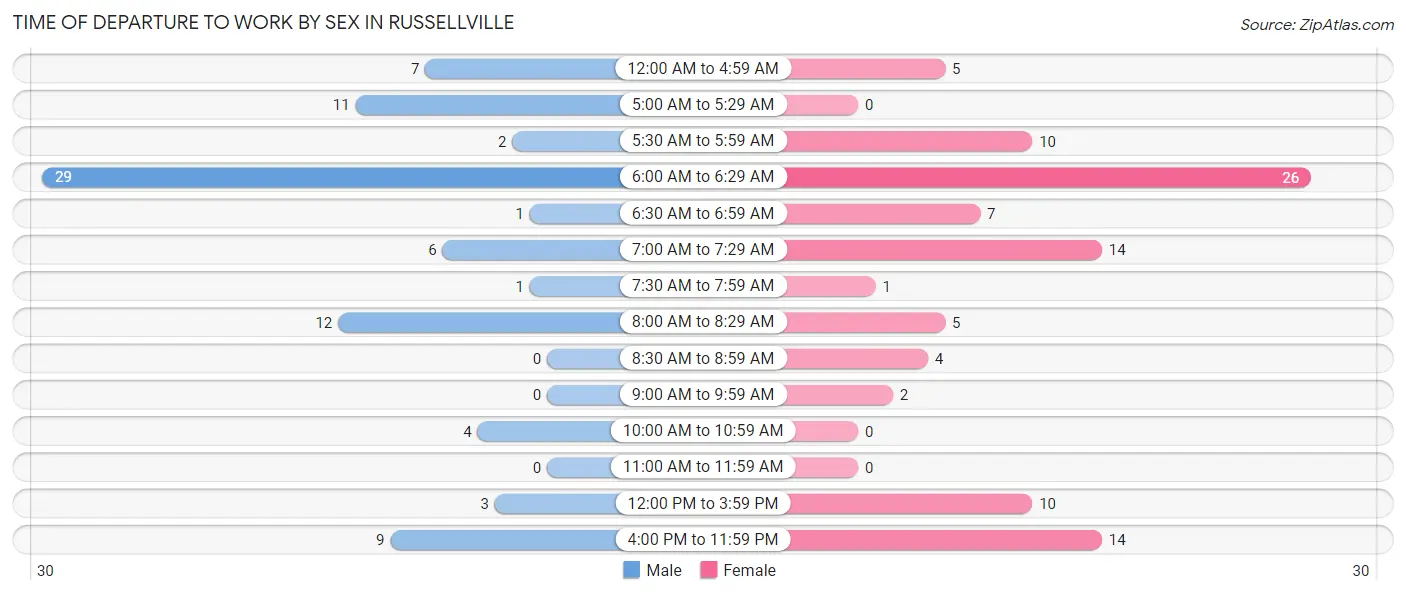
| Time of Departure | Male | Female |
| 12:00 AM to 4:59 AM | 7 (8.2%) | 5 (5.1%) |
| 5:00 AM to 5:29 AM | 11 (12.9%) | 0 (0.0%) |
| 5:30 AM to 5:59 AM | 2 (2.4%) | 10 (10.2%) |
| 6:00 AM to 6:29 AM | 29 (34.1%) | 26 (26.5%) |
| 6:30 AM to 6:59 AM | 1 (1.2%) | 7 (7.1%) |
| 7:00 AM to 7:29 AM | 6 (7.1%) | 14 (14.3%) |
| 7:30 AM to 7:59 AM | 1 (1.2%) | 1 (1.0%) |
| 8:00 AM to 8:29 AM | 12 (14.1%) | 5 (5.1%) |
| 8:30 AM to 8:59 AM | 0 (0.0%) | 4 (4.1%) |
| 9:00 AM to 9:59 AM | 0 (0.0%) | 2 (2.0%) |
| 10:00 AM to 10:59 AM | 4 (4.7%) | 0 (0.0%) |
| 11:00 AM to 11:59 AM | 0 (0.0%) | 0 (0.0%) |
| 12:00 PM to 3:59 PM | 3 (3.5%) | 10 (10.2%) |
| 4:00 PM to 11:59 PM | 9 (10.6%) | 14 (14.3%) |
| Total | 85 (100.0%) | 98 (100.0%) |
Housing Occupancy in Russellville
Occupancy by Ownership in Russellville
Of the total 142 dwellings in Russellville, owner-occupied units account for 121 (85.2%), while renter-occupied units make up 21 (14.8%).
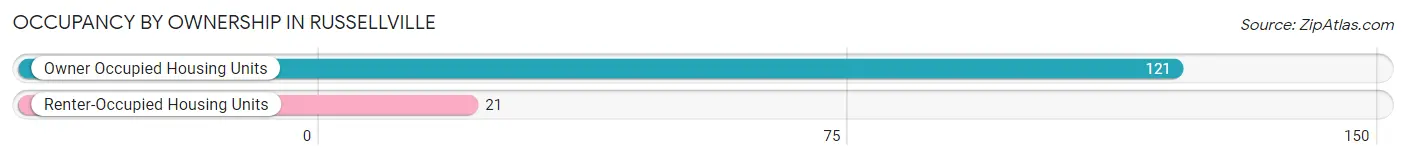
| Occupancy | # Housing Units | % Housing Units |
| Owner Occupied Housing Units | 121 | 85.2% |
| Renter-Occupied Housing Units | 21 | 14.8% |
| Total Occupied Housing Units | 142 | 100.0% |
Occupancy by Household Size in Russellville
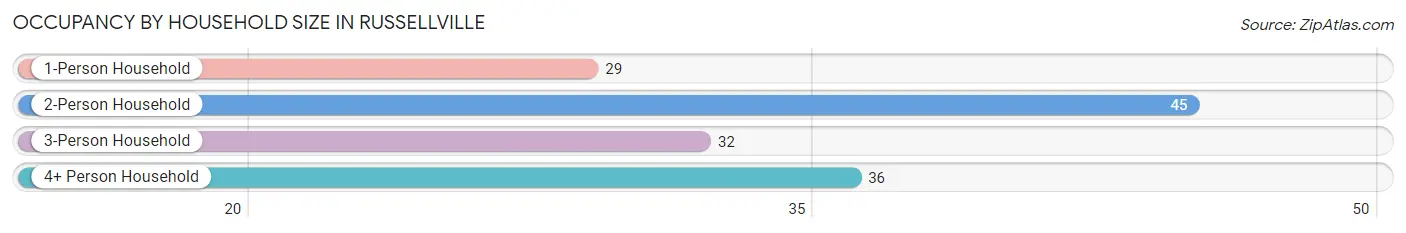
| Household Size | # Housing Units | % Housing Units |
| 1-Person Household | 29 | 20.4% |
| 2-Person Household | 45 | 31.7% |
| 3-Person Household | 32 | 22.5% |
| 4+ Person Household | 36 | 25.4% |
| Total Housing Units | 142 | 100.0% |
Occupancy by Ownership by Household Size in Russellville
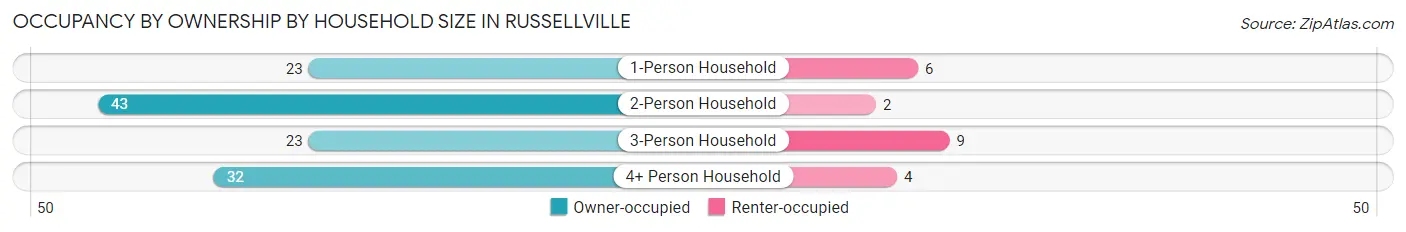
| Household Size | Owner-occupied | Renter-occupied |
| 1-Person Household | 23 (79.3%) | 6 (20.7%) |
| 2-Person Household | 43 (95.6%) | 2 (4.4%) |
| 3-Person Household | 23 (71.9%) | 9 (28.1%) |
| 4+ Person Household | 32 (88.9%) | 4 (11.1%) |
| Total Housing Units | 121 (85.2%) | 21 (14.8%) |
Occupancy by Educational Attainment in Russellville
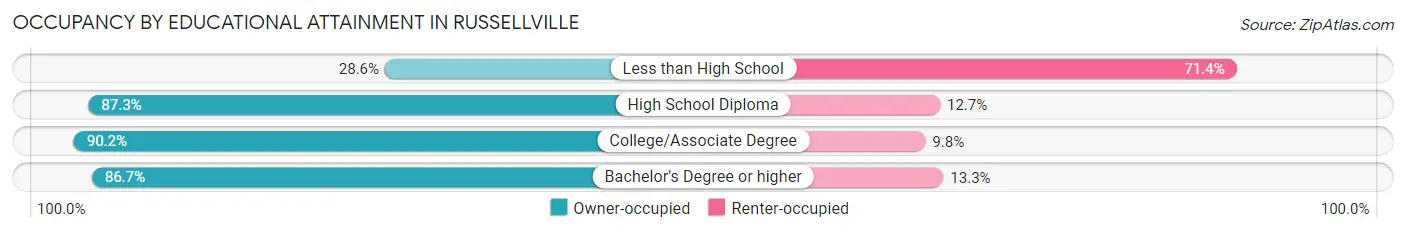
| Household Size | Owner-occupied | Renter-occupied |
| Less than High School | 2 (28.6%) | 5 (71.4%) |
| High School Diploma | 69 (87.3%) | 10 (12.7%) |
| College/Associate Degree | 37 (90.2%) | 4 (9.8%) |
| Bachelor's Degree or higher | 13 (86.7%) | 2 (13.3%) |
Occupancy by Age of Householder in Russellville
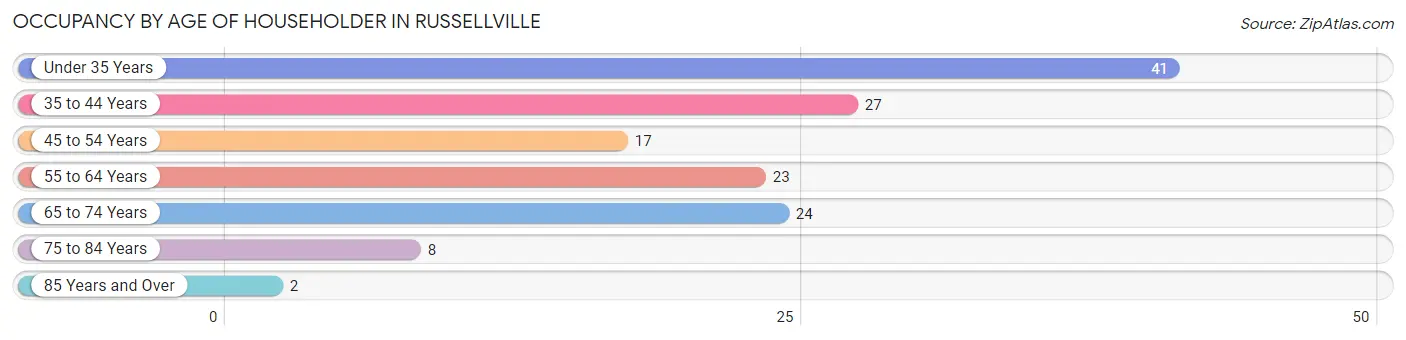
| Age Bracket | # Households | % Households |
| Under 35 Years | 41 | 28.9% |
| 35 to 44 Years | 27 | 19.0% |
| 45 to 54 Years | 17 | 12.0% |
| 55 to 64 Years | 23 | 16.2% |
| 65 to 74 Years | 24 | 16.9% |
| 75 to 84 Years | 8 | 5.6% |
| 85 Years and Over | 2 | 1.4% |
| Total | 142 | 100.0% |
Housing Finances in Russellville
Median Income by Occupancy in Russellville
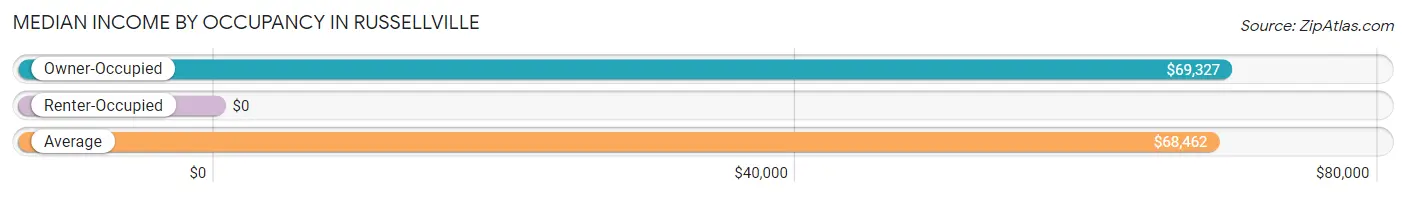
| Occupancy Type | # Households | Median Income |
| Owner-Occupied | 121 (85.2%) | $69,327 |
| Renter-Occupied | 21 (14.8%) | $0 |
| Average | 142 (100.0%) | $68,462 |
Occupancy by Householder Income Bracket in Russellville
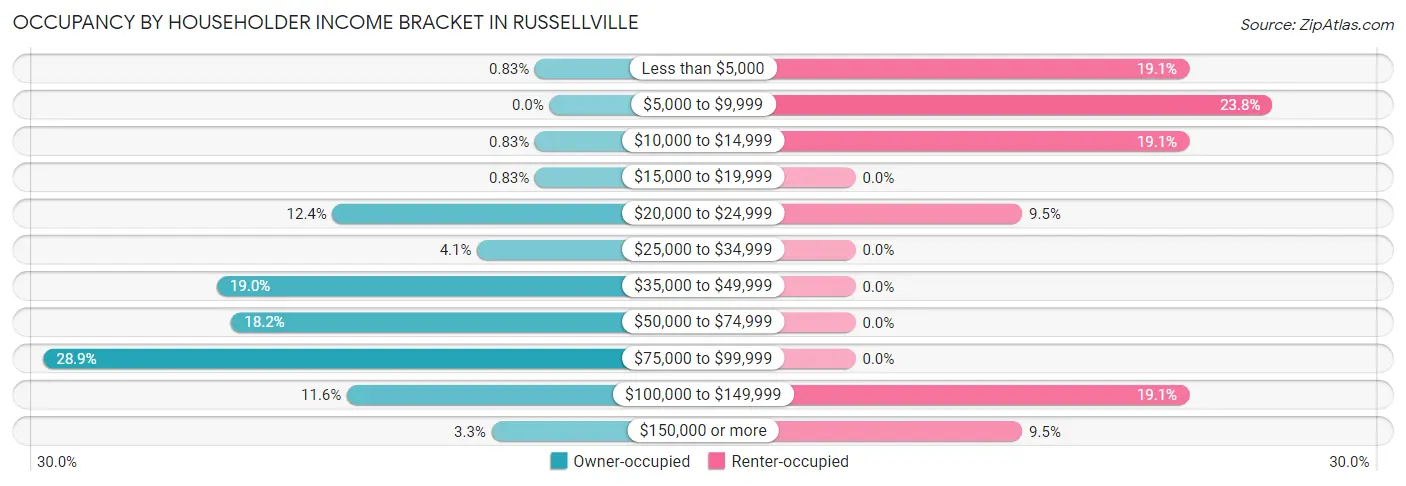
| Income Bracket | Owner-occupied | Renter-occupied |
| Less than $5,000 | 1 (0.8%) | 4 (19.1%) |
| $5,000 to $9,999 | 0 (0.0%) | 5 (23.8%) |
| $10,000 to $14,999 | 1 (0.8%) | 4 (19.1%) |
| $15,000 to $19,999 | 1 (0.8%) | 0 (0.0%) |
| $20,000 to $24,999 | 15 (12.4%) | 2 (9.5%) |
| $25,000 to $34,999 | 5 (4.1%) | 0 (0.0%) |
| $35,000 to $49,999 | 23 (19.0%) | 0 (0.0%) |
| $50,000 to $74,999 | 22 (18.2%) | 0 (0.0%) |
| $75,000 to $99,999 | 35 (28.9%) | 0 (0.0%) |
| $100,000 to $149,999 | 14 (11.6%) | 4 (19.1%) |
| $150,000 or more | 4 (3.3%) | 2 (9.5%) |
| Total | 121 (100.0%) | 21 (100.0%) |
Monthly Housing Cost Tiers in Russellville
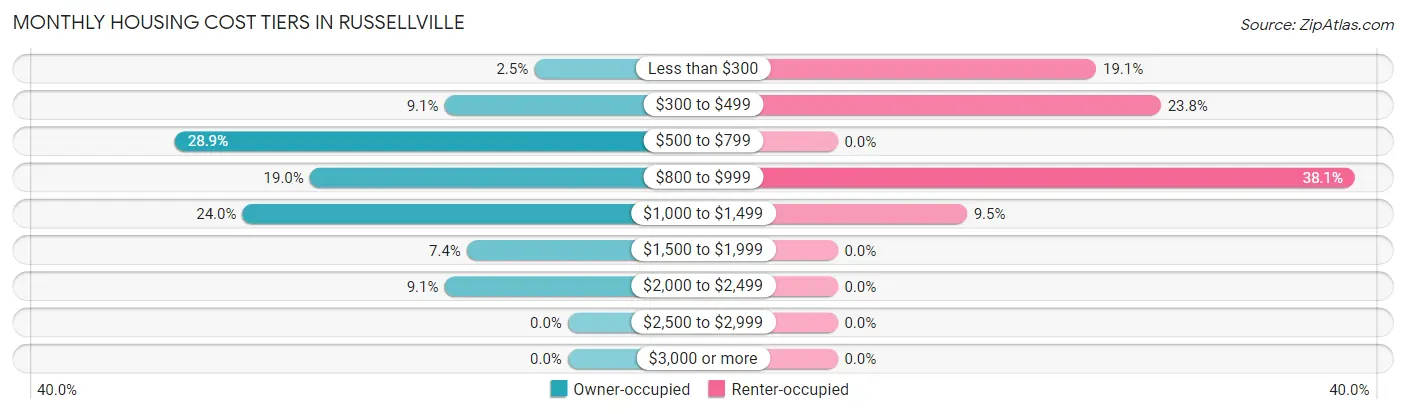
| Monthly Cost | Owner-occupied | Renter-occupied |
| Less than $300 | 3 (2.5%) | 4 (19.1%) |
| $300 to $499 | 11 (9.1%) | 5 (23.8%) |
| $500 to $799 | 35 (28.9%) | 0 (0.0%) |
| $800 to $999 | 23 (19.0%) | 8 (38.1%) |
| $1,000 to $1,499 | 29 (24.0%) | 2 (9.5%) |
| $1,500 to $1,999 | 9 (7.4%) | 0 (0.0%) |
| $2,000 to $2,499 | 11 (9.1%) | 0 (0.0%) |
| $2,500 to $2,999 | 0 (0.0%) | 0 (0.0%) |
| $3,000 or more | 0 (0.0%) | 0 (0.0%) |
| Total | 121 (100.0%) | 21 (100.0%) |
Physical Housing Characteristics in Russellville
Housing Structures in Russellville
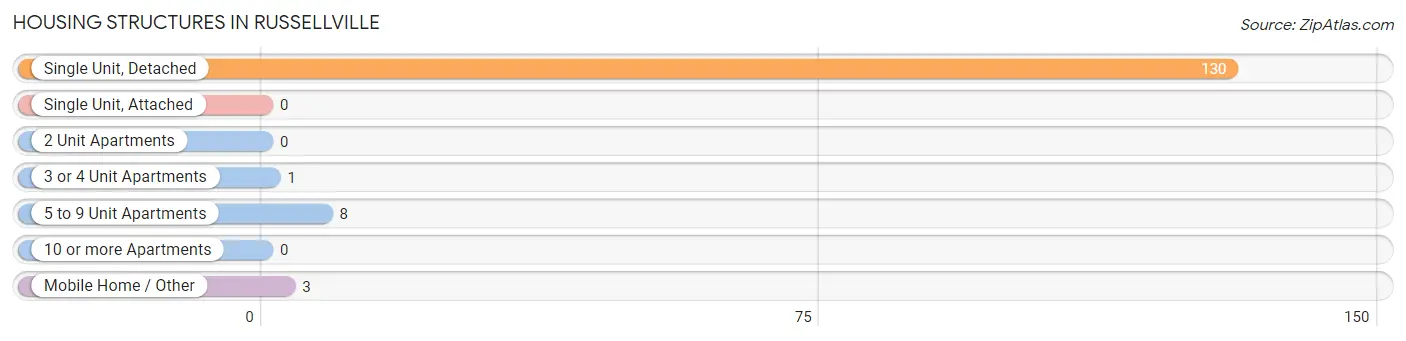
| Structure Type | # Housing Units | % Housing Units |
| Single Unit, Detached | 130 | 91.5% |
| Single Unit, Attached | 0 | 0.0% |
| 2 Unit Apartments | 0 | 0.0% |
| 3 or 4 Unit Apartments | 1 | 0.7% |
| 5 to 9 Unit Apartments | 8 | 5.6% |
| 10 or more Apartments | 0 | 0.0% |
| Mobile Home / Other | 3 | 2.1% |
| Total | 142 | 100.0% |
Housing Structures by Occupancy in Russellville
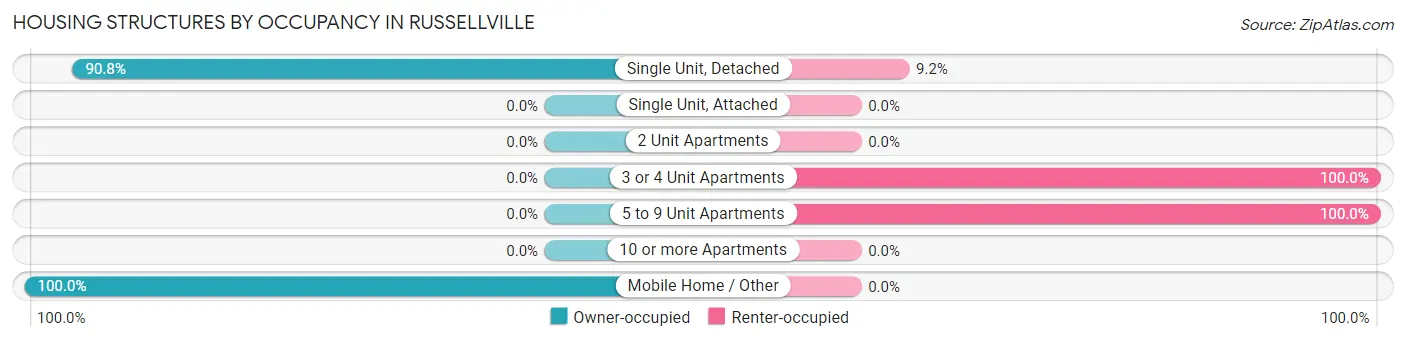
| Structure Type | Owner-occupied | Renter-occupied |
| Single Unit, Detached | 118 (90.8%) | 12 (9.2%) |
| Single Unit, Attached | 0 (0.0%) | 0 (0.0%) |
| 2 Unit Apartments | 0 (0.0%) | 0 (0.0%) |
| 3 or 4 Unit Apartments | 0 (0.0%) | 1 (100.0%) |
| 5 to 9 Unit Apartments | 0 (0.0%) | 8 (100.0%) |
| 10 or more Apartments | 0 (0.0%) | 0 (0.0%) |
| Mobile Home / Other | 3 (100.0%) | 0 (0.0%) |
| Total | 121 (85.2%) | 21 (14.8%) |
Housing Structures by Number of Rooms in Russellville
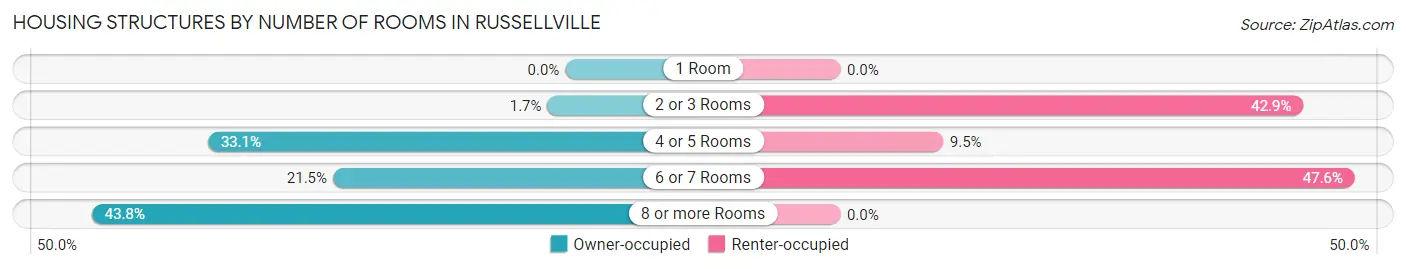
| Number of Rooms | Owner-occupied | Renter-occupied |
| 1 Room | 0 (0.0%) | 0 (0.0%) |
| 2 or 3 Rooms | 2 (1.7%) | 9 (42.9%) |
| 4 or 5 Rooms | 40 (33.1%) | 2 (9.5%) |
| 6 or 7 Rooms | 26 (21.5%) | 10 (47.6%) |
| 8 or more Rooms | 53 (43.8%) | 0 (0.0%) |
| Total | 121 (100.0%) | 21 (100.0%) |
Housing Structure by Heating Type in Russellville
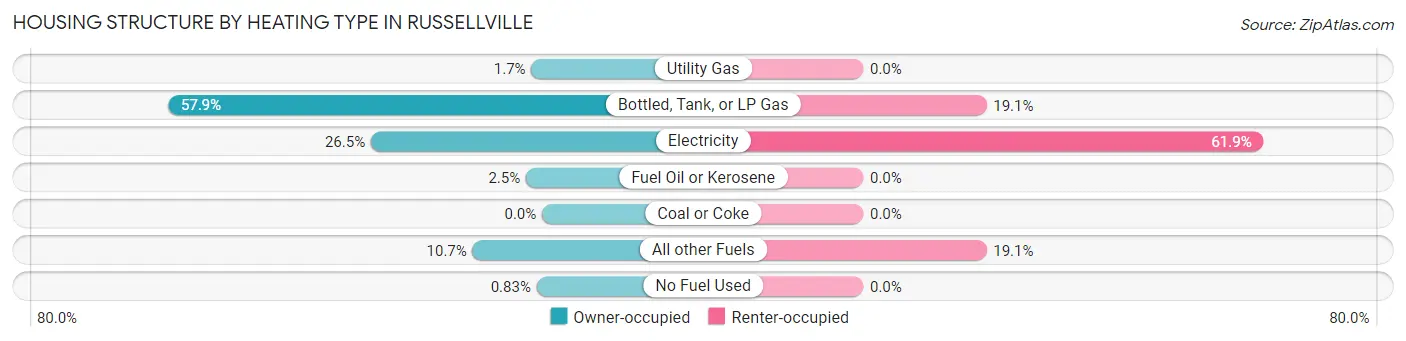
| Heating Type | Owner-occupied | Renter-occupied |
| Utility Gas | 2 (1.7%) | 0 (0.0%) |
| Bottled, Tank, or LP Gas | 70 (57.9%) | 4 (19.1%) |
| Electricity | 32 (26.5%) | 13 (61.9%) |
| Fuel Oil or Kerosene | 3 (2.5%) | 0 (0.0%) |
| Coal or Coke | 0 (0.0%) | 0 (0.0%) |
| All other Fuels | 13 (10.7%) | 4 (19.1%) |
| No Fuel Used | 1 (0.8%) | 0 (0.0%) |
| Total | 121 (100.0%) | 21 (100.0%) |
Household Vehicle Usage in Russellville
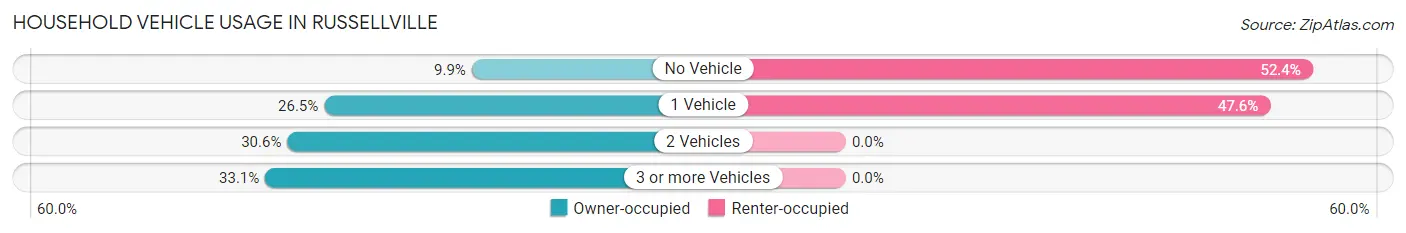
| Vehicles per Household | Owner-occupied | Renter-occupied |
| No Vehicle | 12 (9.9%) | 11 (52.4%) |
| 1 Vehicle | 32 (26.5%) | 10 (47.6%) |
| 2 Vehicles | 37 (30.6%) | 0 (0.0%) |
| 3 or more Vehicles | 40 (33.1%) | 0 (0.0%) |
| Total | 121 (100.0%) | 21 (100.0%) |
Real Estate & Mortgages in Russellville
Real Estate and Mortgage Overview in Russellville
| Characteristic | Without Mortgage | With Mortgage |
| Housing Units | 49 | 72 |
| Median Property Value | $47,200 | $97,500 |
| Median Household Income | $38,750 | $3 |
| Monthly Housing Costs | $544 | $0 |
| Real Estate Taxes | $463 | $0 |
Property Value by Mortgage Status in Russellville
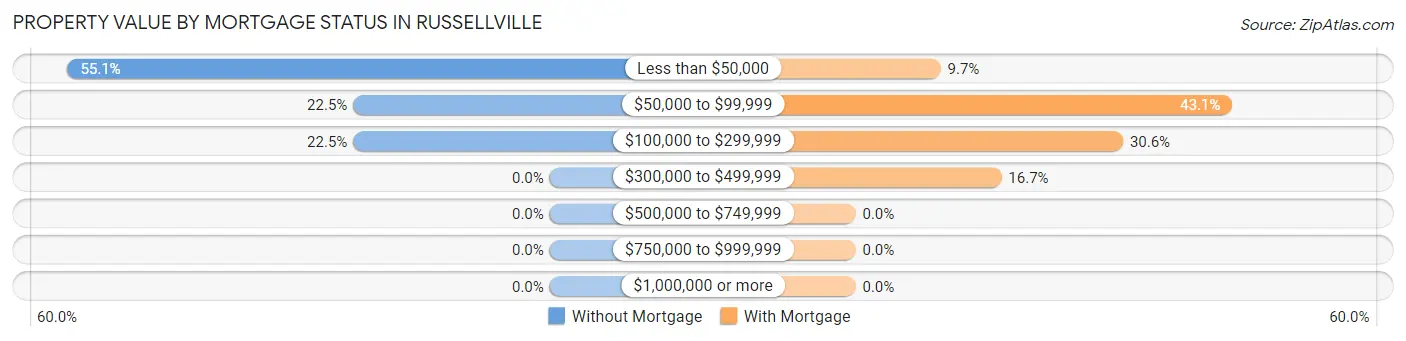
| Property Value | Without Mortgage | With Mortgage |
| Less than $50,000 | 27 (55.1%) | 7 (9.7%) |
| $50,000 to $99,999 | 11 (22.5%) | 31 (43.1%) |
| $100,000 to $299,999 | 11 (22.5%) | 22 (30.6%) |
| $300,000 to $499,999 | 0 (0.0%) | 12 (16.7%) |
| $500,000 to $749,999 | 0 (0.0%) | 0 (0.0%) |
| $750,000 to $999,999 | 0 (0.0%) | 0 (0.0%) |
| $1,000,000 or more | 0 (0.0%) | 0 (0.0%) |
| Total | 49 (100.0%) | 72 (100.0%) |
Household Income by Mortgage Status in Russellville
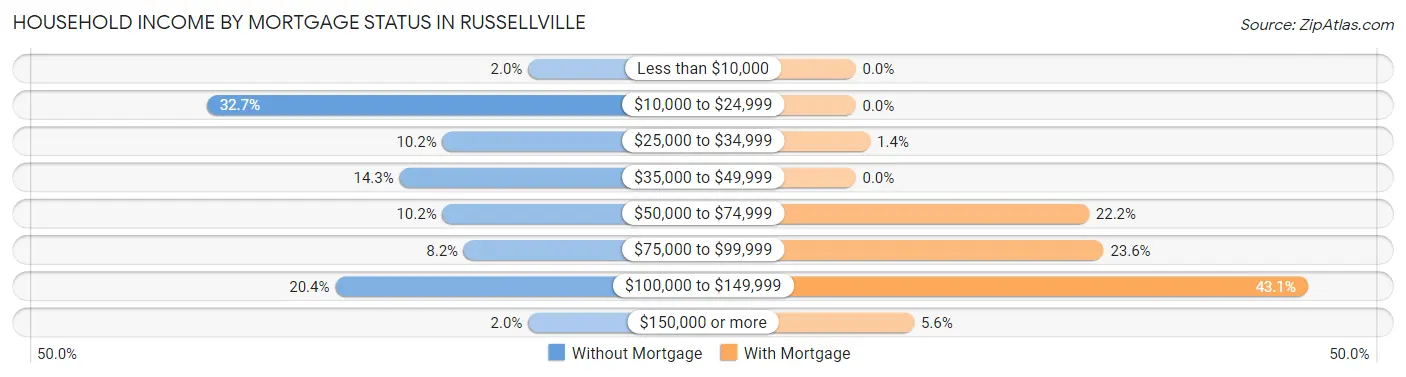
| Household Income | Without Mortgage | With Mortgage |
| Less than $10,000 | 1 (2.0%) | 0 (0.0%) |
| $10,000 to $24,999 | 16 (32.7%) | 0 (0.0%) |
| $25,000 to $34,999 | 5 (10.2%) | 1 (1.4%) |
| $35,000 to $49,999 | 7 (14.3%) | 0 (0.0%) |
| $50,000 to $74,999 | 5 (10.2%) | 16 (22.2%) |
| $75,000 to $99,999 | 4 (8.2%) | 17 (23.6%) |
| $100,000 to $149,999 | 10 (20.4%) | 31 (43.1%) |
| $150,000 or more | 1 (2.0%) | 4 (5.6%) |
| Total | 49 (100.0%) | 72 (100.0%) |
Property Value to Household Income Ratio in Russellville
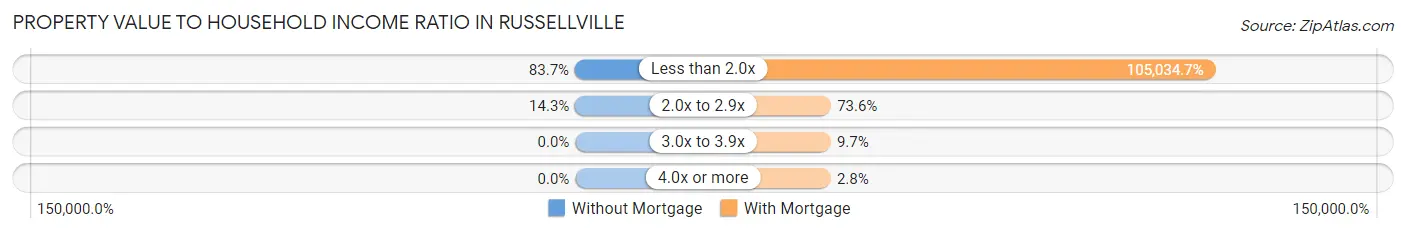
| Value-to-Income Ratio | Without Mortgage | With Mortgage |
| Less than 2.0x | 41 (83.7%) | 75,625 (105,034.7%) |
| 2.0x to 2.9x | 7 (14.3%) | 53 (73.6%) |
| 3.0x to 3.9x | 0 (0.0%) | 7 (9.7%) |
| 4.0x or more | 0 (0.0%) | 2 (2.8%) |
| Total | 49 (100.0%) | 72 (100.0%) |
Real Estate Taxes by Mortgage Status in Russellville
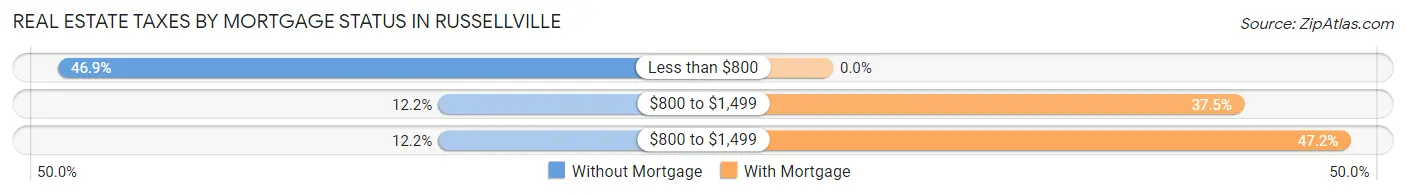
| Property Taxes | Without Mortgage | With Mortgage |
| Less than $800 | 23 (46.9%) | 0 (0.0%) |
| $800 to $1,499 | 6 (12.2%) | 27 (37.5%) |
| $800 to $1,499 | 6 (12.2%) | 34 (47.2%) |
| Total | 49 (100.0%) | 72 (100.0%) |
Health & Disability in Russellville
Health Insurance Coverage by Age in Russellville
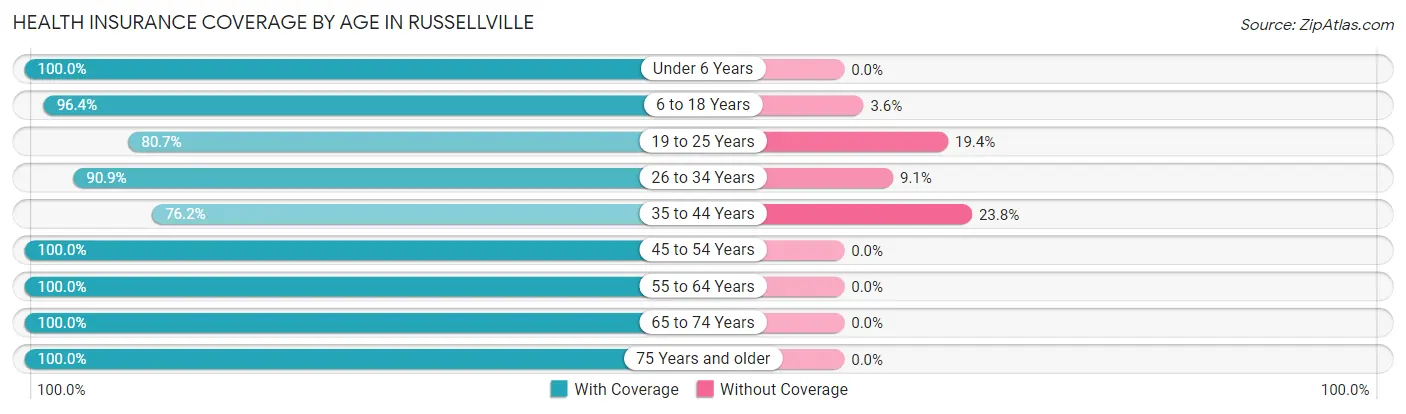
| Age Bracket | With Coverage | Without Coverage |
| Under 6 Years | 44 (100.0%) | 0 (0.0%) |
| 6 to 18 Years | 81 (96.4%) | 3 (3.6%) |
| 19 to 25 Years | 25 (80.6%) | 6 (19.4%) |
| 26 to 34 Years | 60 (90.9%) | 6 (9.1%) |
| 35 to 44 Years | 32 (76.2%) | 10 (23.8%) |
| 45 to 54 Years | 33 (100.0%) | 0 (0.0%) |
| 55 to 64 Years | 44 (100.0%) | 0 (0.0%) |
| 65 to 74 Years | 33 (100.0%) | 0 (0.0%) |
| 75 Years and older | 14 (100.0%) | 0 (0.0%) |
| Total | 366 (93.6%) | 25 (6.4%) |
Health Insurance Coverage by Citizenship Status in Russellville
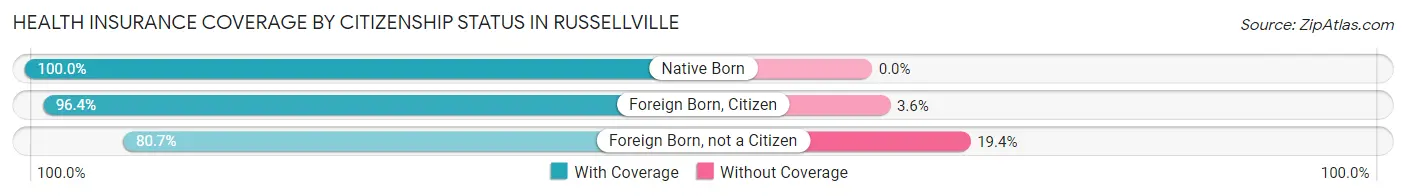
| Citizenship Status | With Coverage | Without Coverage |
| Native Born | 44 (100.0%) | 0 (0.0%) |
| Foreign Born, Citizen | 81 (96.4%) | 3 (3.6%) |
| Foreign Born, not a Citizen | 25 (80.6%) | 6 (19.4%) |
Health Insurance Coverage by Household Income in Russellville
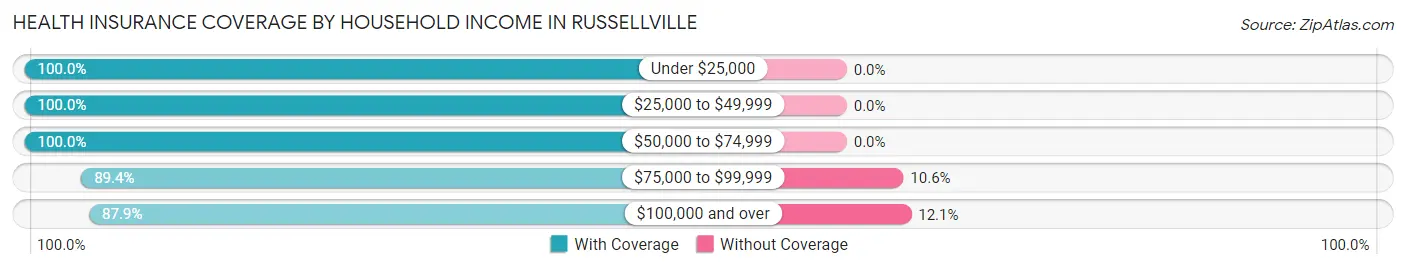
| Household Income | With Coverage | Without Coverage |
| Under $25,000 | 85 (100.0%) | 0 (0.0%) |
| $25,000 to $49,999 | 51 (100.0%) | 0 (0.0%) |
| $50,000 to $74,999 | 32 (100.0%) | 0 (0.0%) |
| $75,000 to $99,999 | 118 (89.4%) | 14 (10.6%) |
| $100,000 and over | 80 (87.9%) | 11 (12.1%) |
Public vs Private Health Insurance Coverage by Age in Russellville
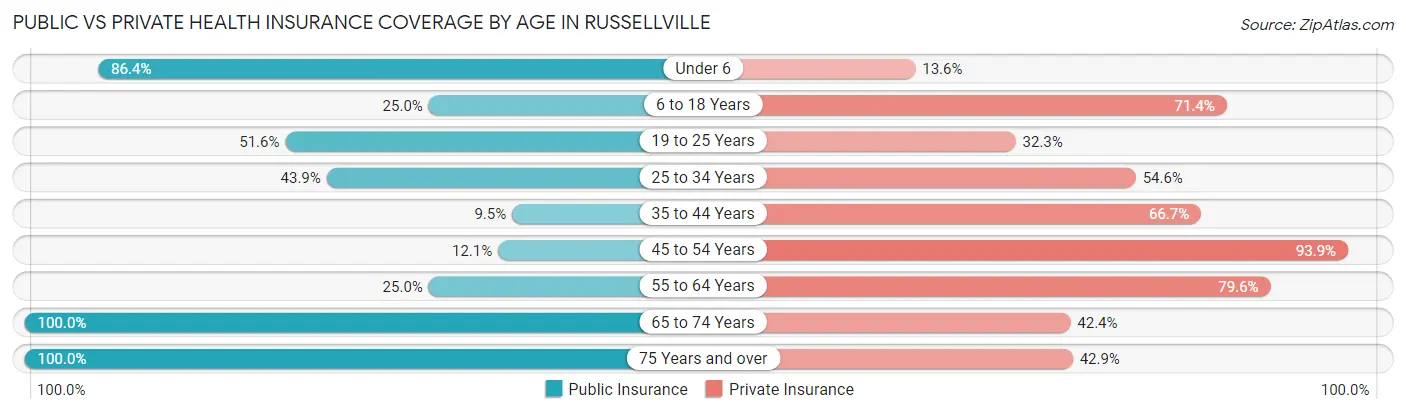
| Age Bracket | Public Insurance | Private Insurance |
| Under 6 | 38 (86.4%) | 6 (13.6%) |
| 6 to 18 Years | 21 (25.0%) | 60 (71.4%) |
| 19 to 25 Years | 16 (51.6%) | 10 (32.3%) |
| 25 to 34 Years | 29 (43.9%) | 36 (54.5%) |
| 35 to 44 Years | 4 (9.5%) | 28 (66.7%) |
| 45 to 54 Years | 4 (12.1%) | 31 (93.9%) |
| 55 to 64 Years | 11 (25.0%) | 35 (79.5%) |
| 65 to 74 Years | 33 (100.0%) | 14 (42.4%) |
| 75 Years and over | 14 (100.0%) | 6 (42.9%) |
| Total | 170 (43.5%) | 226 (57.8%) |
Disability Status by Sex by Age in Russellville
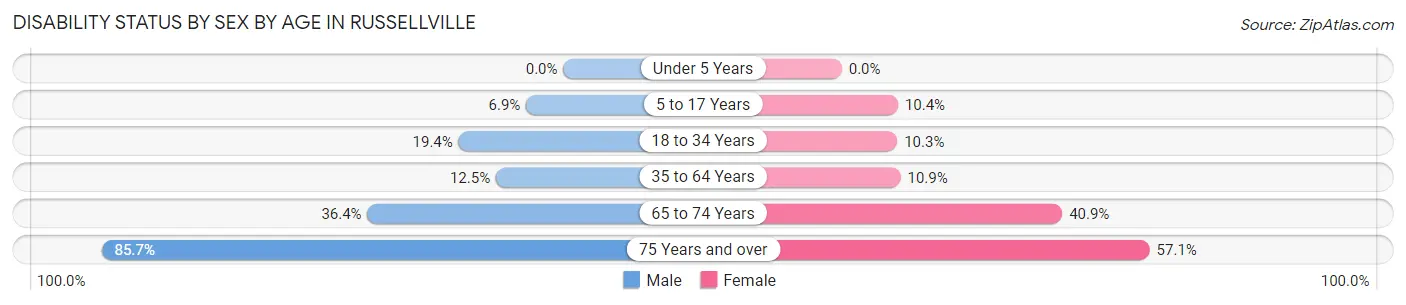
| Age Bracket | Male | Female |
| Under 5 Years | 0 (0.0%) | 0 (0.0%) |
| 5 to 17 Years | 2 (6.9%) | 5 (10.4%) |
| 18 to 34 Years | 7 (19.4%) | 7 (10.3%) |
| 35 to 64 Years | 8 (12.5%) | 6 (10.9%) |
| 65 to 74 Years | 4 (36.4%) | 9 (40.9%) |
| 75 Years and over | 6 (85.7%) | 4 (57.1%) |
Disability Class by Sex by Age in Russellville
Disability Class: Hearing Difficulty
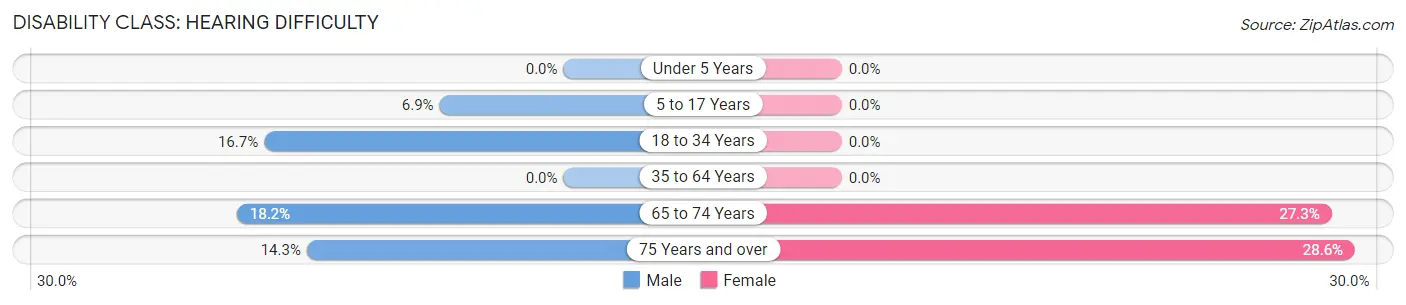
| Age Bracket | Male | Female |
| Under 5 Years | 0 (0.0%) | 0 (0.0%) |
| 5 to 17 Years | 2 (6.9%) | 0 (0.0%) |
| 18 to 34 Years | 6 (16.7%) | 0 (0.0%) |
| 35 to 64 Years | 0 (0.0%) | 0 (0.0%) |
| 65 to 74 Years | 2 (18.2%) | 6 (27.3%) |
| 75 Years and over | 1 (14.3%) | 2 (28.6%) |
Disability Class: Vision Difficulty
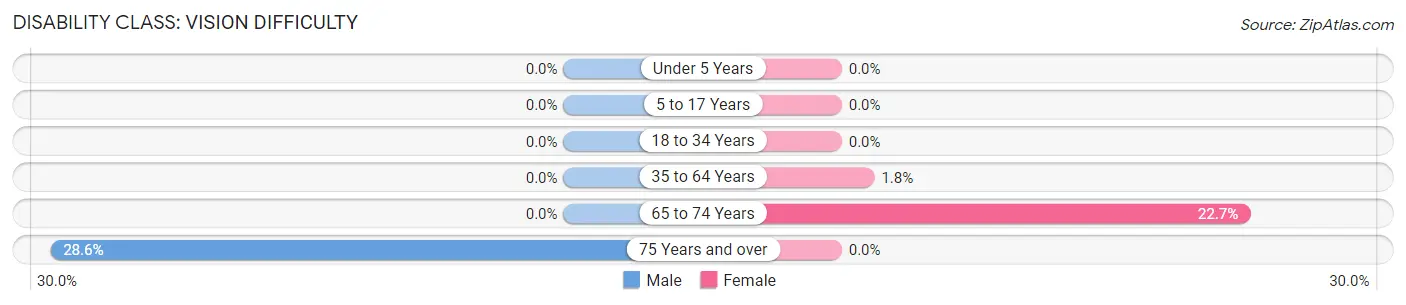
| Age Bracket | Male | Female |
| Under 5 Years | 0 (0.0%) | 0 (0.0%) |
| 5 to 17 Years | 0 (0.0%) | 0 (0.0%) |
| 18 to 34 Years | 0 (0.0%) | 0 (0.0%) |
| 35 to 64 Years | 0 (0.0%) | 1 (1.8%) |
| 65 to 74 Years | 0 (0.0%) | 5 (22.7%) |
| 75 Years and over | 2 (28.6%) | 0 (0.0%) |
Disability Class: Cognitive Difficulty
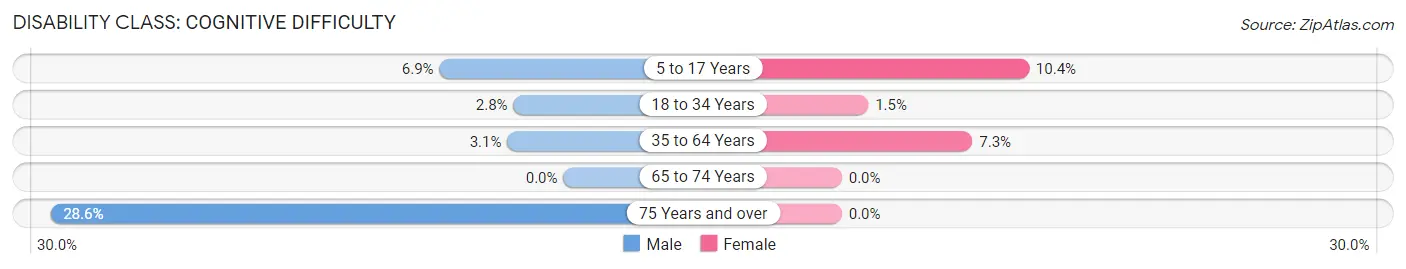
| Age Bracket | Male | Female |
| 5 to 17 Years | 2 (6.9%) | 5 (10.4%) |
| 18 to 34 Years | 1 (2.8%) | 1 (1.5%) |
| 35 to 64 Years | 2 (3.1%) | 4 (7.3%) |
| 65 to 74 Years | 0 (0.0%) | 0 (0.0%) |
| 75 Years and over | 2 (28.6%) | 0 (0.0%) |
Disability Class: Ambulatory Difficulty
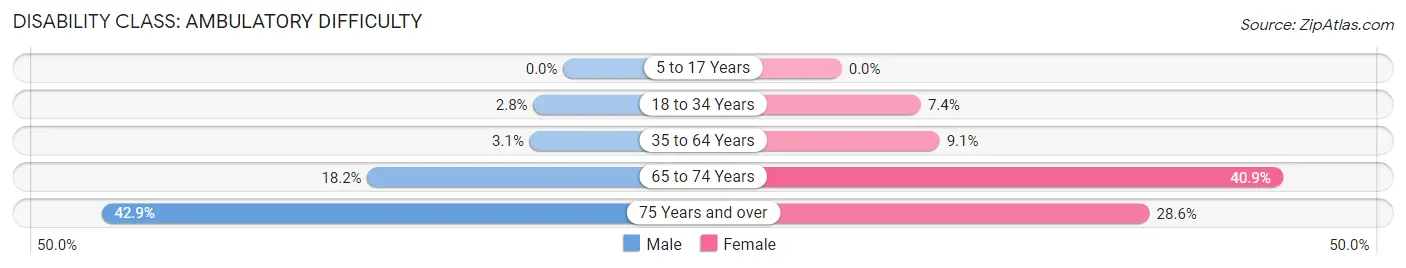
| Age Bracket | Male | Female |
| 5 to 17 Years | 0 (0.0%) | 0 (0.0%) |
| 18 to 34 Years | 1 (2.8%) | 5 (7.3%) |
| 35 to 64 Years | 2 (3.1%) | 5 (9.1%) |
| 65 to 74 Years | 2 (18.2%) | 9 (40.9%) |
| 75 Years and over | 3 (42.9%) | 2 (28.6%) |
Disability Class: Self-Care Difficulty
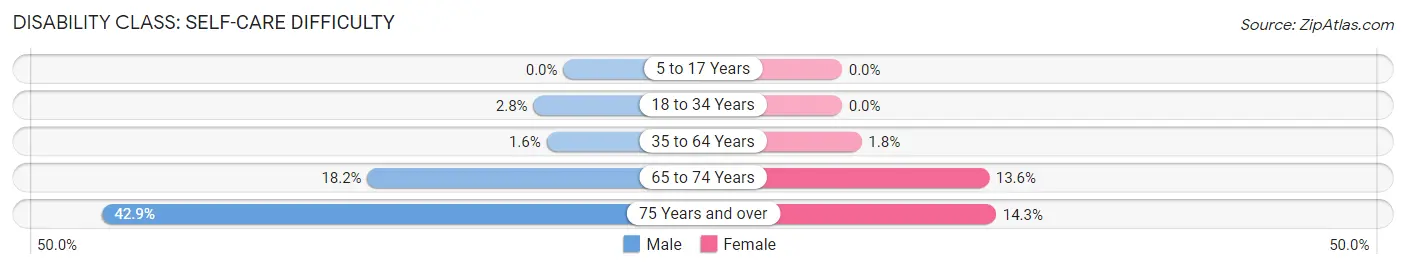
| Age Bracket | Male | Female |
| 5 to 17 Years | 0 (0.0%) | 0 (0.0%) |
| 18 to 34 Years | 1 (2.8%) | 0 (0.0%) |
| 35 to 64 Years | 1 (1.6%) | 1 (1.8%) |
| 65 to 74 Years | 2 (18.2%) | 3 (13.6%) |
| 75 Years and over | 3 (42.9%) | 1 (14.3%) |
Technology Access in Russellville
Computing Device Access in Russellville
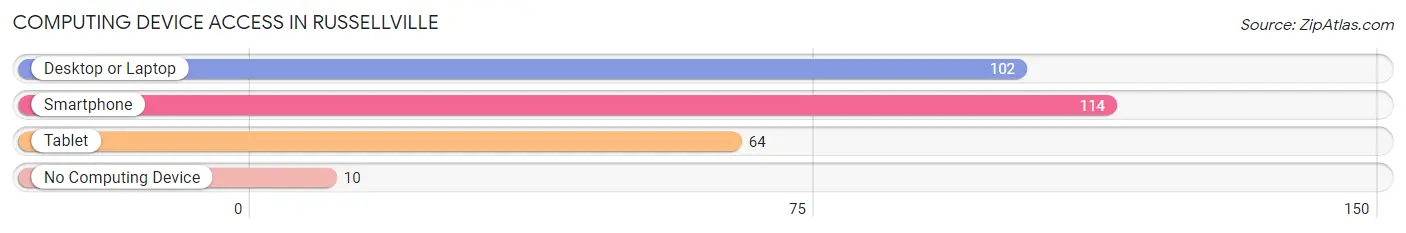
| Device Type | # Households | % Households |
| Desktop or Laptop | 102 | 71.8% |
| Smartphone | 114 | 80.3% |
| Tablet | 64 | 45.1% |
| No Computing Device | 10 | 7.0% |
| Total | 142 | 100.0% |
Internet Access in Russellville
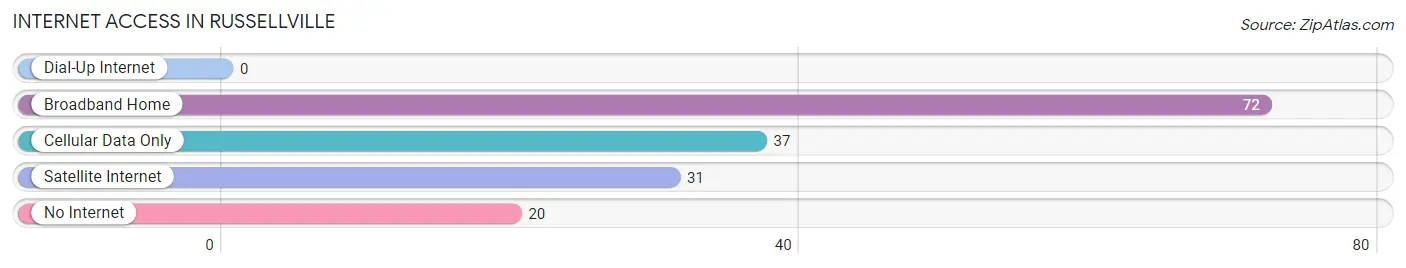
| Internet Type | # Households | % Households |
| Dial-Up Internet | 0 | 0.0% |
| Broadband Home | 72 | 50.7% |
| Cellular Data Only | 37 | 26.1% |
| Satellite Internet | 31 | 21.8% |
| No Internet | 20 | 14.1% |
| Total | 142 | 100.0% |
Russellville Summary
Russellville is a small town located in the state of Indiana, in the United States. It is situated in the northwest corner of the state, in the county of Boone. The town has a population of approximately 1,000 people, and is part of the Indianapolis metropolitan area.
History
The area that is now Russellville was first settled in 1820 by a group of settlers from North Carolina. The town was originally known as “New Hope”, and was later renamed “Russellville” in honor of the first settler, William Russell. The town was officially incorporated in 1837.
In the late 19th century, Russellville was a thriving agricultural community, with a variety of crops being grown in the area. The town was also home to several small businesses, including a sawmill, a gristmill, and a blacksmith shop.
In the early 20th century, the town began to experience a decline in population, as many of the residents moved away to larger cities in search of better job opportunities. However, the town was able to remain relatively stable, and in the 1950s, the population began to slowly increase again.
Geography
Russellville is located in the northwest corner of Indiana, in the county of Boone. The town is situated on the banks of the White River, and is surrounded by rolling hills and farmland. The town is located approximately 30 miles northwest of Indianapolis, and is part of the Indianapolis metropolitan area.
The climate in Russellville is generally mild, with hot summers and cold winters. The average annual temperature is around 50 degrees Fahrenheit, and the average annual precipitation is around 40 inches.
Economy
The economy of Russellville is largely based on agriculture. The town is home to several farms, which produce a variety of crops, including corn, soybeans, wheat, and hay. The town is also home to several small businesses, including a sawmill, a gristmill, and a blacksmith shop.
In recent years, the town has seen an increase in tourism, as visitors come to explore the town’s history and enjoy the natural beauty of the area. The town is also home to several festivals and events throughout the year, including the annual Russellville Fall Festival.
Demographics
As of the 2010 census, the population of Russellville was 1,000 people. The racial makeup of the town was 97.2% White, 0.7% African American, 0.3% Native American, 0.3% Asian, and 1.5% from other races. The median household income was $41,250, and the median home value was $117,500.
The town is served by the Boone County School Corporation, which operates two elementary schools, one middle school, and one high school. The town is also home to several churches, including the First Baptist Church, the First United Methodist Church, and the Russellville Christian Church.
Common Questions
What is Per Capita Income in Russellville?
Per Capita income in Russellville is $24,277.
What is the Median Household income in Russellville?
Median Household Income in Russellville is $68,462.
What is Income or Wage Gap in Russellville?
Income or Wage Gap in Russellville is 49.5%.
Women in Russellville earn 50.5 cents for every dollar earned by a man.
What is Family Income Deficit in Russellville?
Family Income Deficit in Russellville is $9,252.
Families that are below poverty line in Russellville earn $9,252 less on average than the poverty threshold level.
What is Inequality or Gini Index in Russellville?
Inequality or Gini Index in Russellville is 0.36.
What is the Total Population of Russellville?
Total Population of Russellville is 391.
What is the Total Male Population of Russellville?
Total Male Population of Russellville is 151.
What is the Total Female Population of Russellville?
Total Female Population of Russellville is 240.
What is the Ratio of Males per 100 Females in Russellville?
There are 62.92 Males per 100 Females in Russellville.
What is the Ratio of Females per 100 Males in Russellville?
There are 158.94 Females per 100 Males in Russellville.
What is the Median Population Age in Russellville?
Median Population Age in Russellville is 33.8 Years.
What is the Average Family Size in Russellville
Average Family Size in Russellville is 3.1 People.
What is the Average Household Size in Russellville
Average Household Size in Russellville is 2.8 People.
How Large is the Labor Force in Russellville?
There are 197 People in the Labor Forcein in Russellville.
What is the Percentage of People in the Labor Force in Russellville?
66.3% of People are in the Labor Force in Russellville.