Rushville, IN Map & Demographics
Rushville Map
Rushville Overview
$25,715
PER CAPITA INCOME
$61,607
AVG FAMILY INCOME
$53,110
AVG HOUSEHOLD INCOME
17.4%
WAGE / INCOME GAP [ % ]
82.6¢/ $1
WAGE / INCOME GAP [ $ ]
0.39
INEQUALITY / GINI INDEX
6,412
TOTAL POPULATION
3,114
MALE POPULATION
3,298
FEMALE POPULATION
94.42
MALES / 100 FEMALES
105.91
FEMALES / 100 MALES
40.3
MEDIAN AGE
3.1
AVG FAMILY SIZE
2.5
AVG HOUSEHOLD SIZE
3,040
LABOR FORCE [ PEOPLE ]
57.9%
PERCENT IN LABOR FORCE
9.6%
UNEMPLOYMENT RATE
Rushville Zip Codes
Rushville Area Codes
Income in Rushville
Income Overview in Rushville
Per Capita Income in Rushville is $25,715, while median incomes of families and households are $61,607 and $53,110 respectively.
| Characteristic | Number | Measure |
| Per Capita Income | 6,412 | $25,715 |
| Median Family Income | 1,470 | $61,607 |
| Mean Family Income | 1,470 | $71,414 |
| Median Household Income | 2,524 | $53,110 |
| Mean Household Income | 2,524 | $61,772 |
| Income Deficit | 1,470 | $0 |
| Wage / Income Gap (%) | 6,412 | 17.44% |
| Wage / Income Gap ($) | 6,412 | 82.56¢ per $1 |
| Gini / Inequality Index | 6,412 | 0.39 |
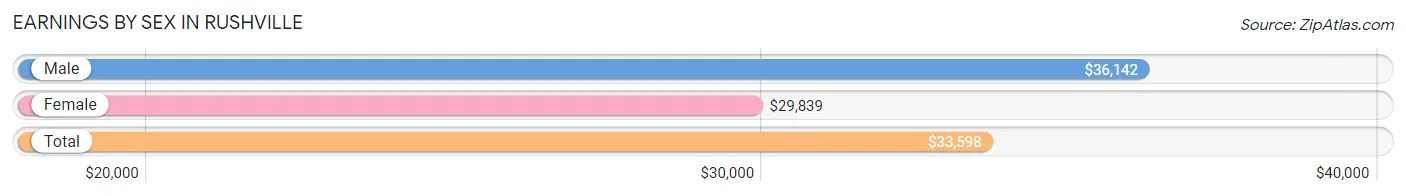
Earnings by Sex in Rushville
Average Earnings in Rushville are $33,598, $36,142 for men and $29,839 for women, a difference of 17.4%.
| Sex | Number | Average Earnings |
| Male | 1,667 (51.1%) | $36,142 |
| Female | 1,592 (48.8%) | $29,839 |
| Total | 3,259 (100.0%) | $33,598 |
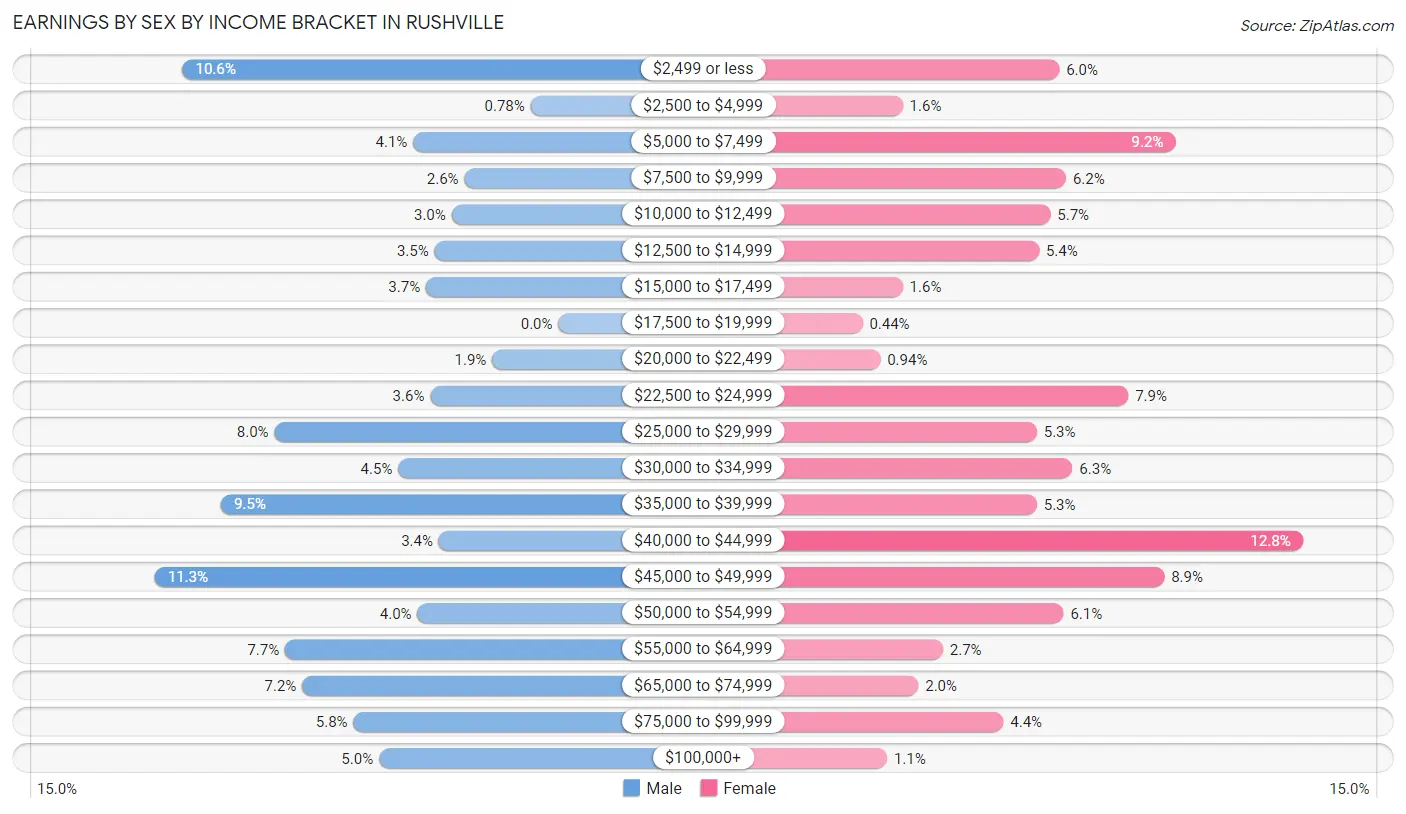
Earnings by Sex by Income Bracket in Rushville
The most common earnings brackets in Rushville are $45,000 to $49,999 for men (189 | 11.3%) and $40,000 to $44,999 for women (204 | 12.8%).
| Income | Male | Female |
| $2,499 or less | 176 (10.6%) | 95 (6.0%) |
| $2,500 to $4,999 | 13 (0.8%) | 25 (1.6%) |
| $5,000 to $7,499 | 68 (4.1%) | 147 (9.2%) |
| $7,500 to $9,999 | 44 (2.6%) | 98 (6.2%) |
| $10,000 to $12,499 | 50 (3.0%) | 91 (5.7%) |
| $12,500 to $14,999 | 58 (3.5%) | 86 (5.4%) |
| $15,000 to $17,499 | 62 (3.7%) | 25 (1.6%) |
| $17,500 to $19,999 | 0 (0.0%) | 7 (0.4%) |
| $20,000 to $22,499 | 31 (1.9%) | 15 (0.9%) |
| $22,500 to $24,999 | 60 (3.6%) | 126 (7.9%) |
| $25,000 to $29,999 | 133 (8.0%) | 85 (5.3%) |
| $30,000 to $34,999 | 75 (4.5%) | 101 (6.3%) |
| $35,000 to $39,999 | 158 (9.5%) | 85 (5.3%) |
| $40,000 to $44,999 | 56 (3.4%) | 204 (12.8%) |
| $45,000 to $49,999 | 189 (11.3%) | 142 (8.9%) |
| $50,000 to $54,999 | 66 (4.0%) | 97 (6.1%) |
| $55,000 to $64,999 | 128 (7.7%) | 43 (2.7%) |
| $65,000 to $74,999 | 120 (7.2%) | 32 (2.0%) |
| $75,000 to $99,999 | 96 (5.8%) | 70 (4.4%) |
| $100,000+ | 84 (5.0%) | 18 (1.1%) |
| Total | 1,667 (100.0%) | 1,592 (100.0%) |
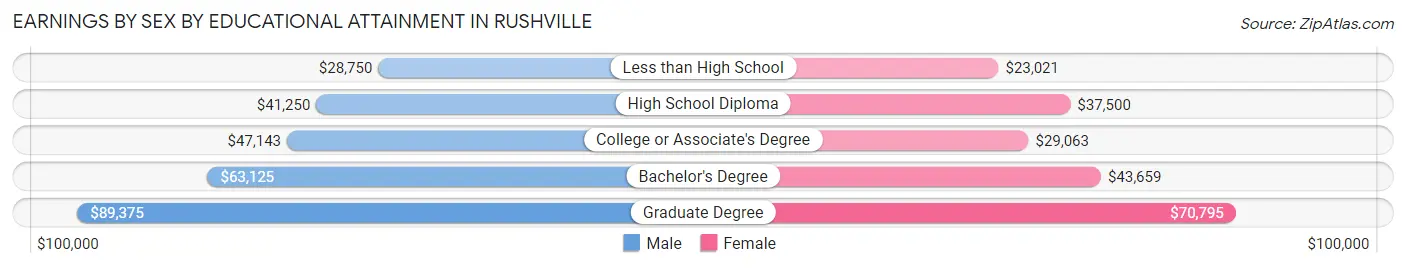
Earnings by Sex by Educational Attainment in Rushville
Average earnings in Rushville are $42,407 for men and $37,292 for women, a difference of 12.1%. Men with an educational attainment of graduate degree enjoy the highest average annual earnings of $89,375, while those with less than high school education earn the least with $28,750. Women with an educational attainment of graduate degree earn the most with the average annual earnings of $70,795, while those with less than high school education have the smallest earnings of $23,021.
| Educational Attainment | Male Income | Female Income |
| Less than High School | $28,750 | $23,021 |
| High School Diploma | $41,250 | $37,500 |
| College or Associate's Degree | $47,143 | $29,063 |
| Bachelor's Degree | $63,125 | $43,659 |
| Graduate Degree | $89,375 | $70,795 |
| Total | $42,407 | $37,292 |
Family Income in Rushville
Family Income Brackets in Rushville
According to the Rushville family income data, there are 376 families falling into the $50,000 to $74,999 income range, which is the most common income bracket and makes up 25.6% of all families. Conversely, the $10,000 to $14,999 income bracket is the least frequent group with only 21 families (1.4%) belonging to this category.
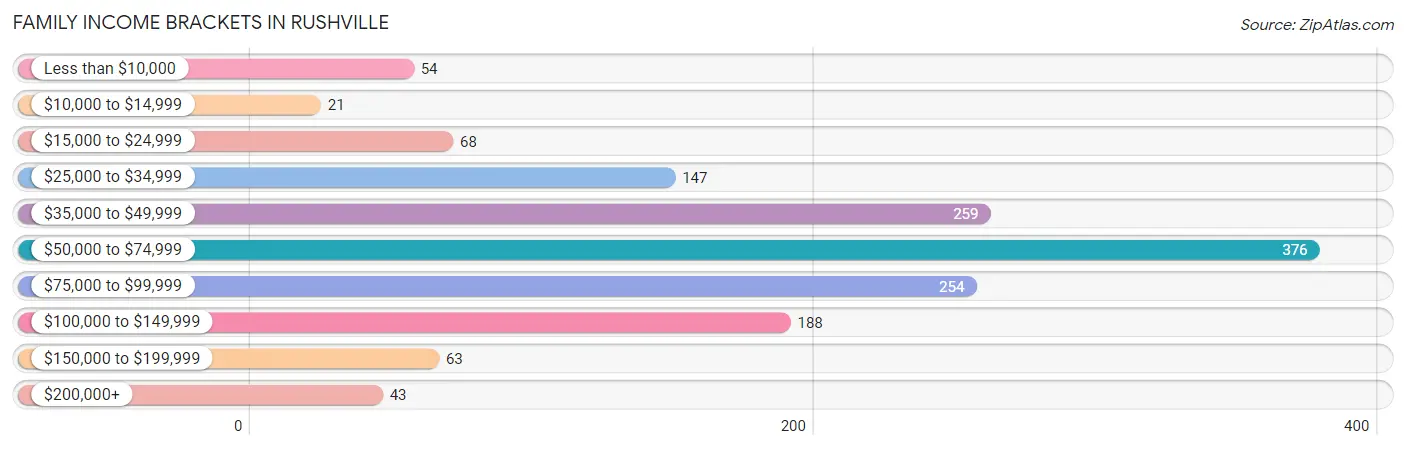
| Income Bracket | # Families | % Families |
| Less than $10,000 | 54 | 3.7% |
| $10,000 to $14,999 | 21 | 1.4% |
| $15,000 to $24,999 | 68 | 4.6% |
| $25,000 to $34,999 | 147 | 10.0% |
| $35,000 to $49,999 | 259 | 17.6% |
| $50,000 to $74,999 | 376 | 25.6% |
| $75,000 to $99,999 | 254 | 17.3% |
| $100,000 to $149,999 | 188 | 12.8% |
| $150,000 to $199,999 | 63 | 4.3% |
| $200,000+ | 43 | 2.9% |
Family Income by Famaliy Size in Rushville
4-person families (210 | 14.3%) account for the highest median family income in Rushville with $80,417 per family, while 2-person families (719 | 48.9%) have the highest median income of $30,170 per family member.
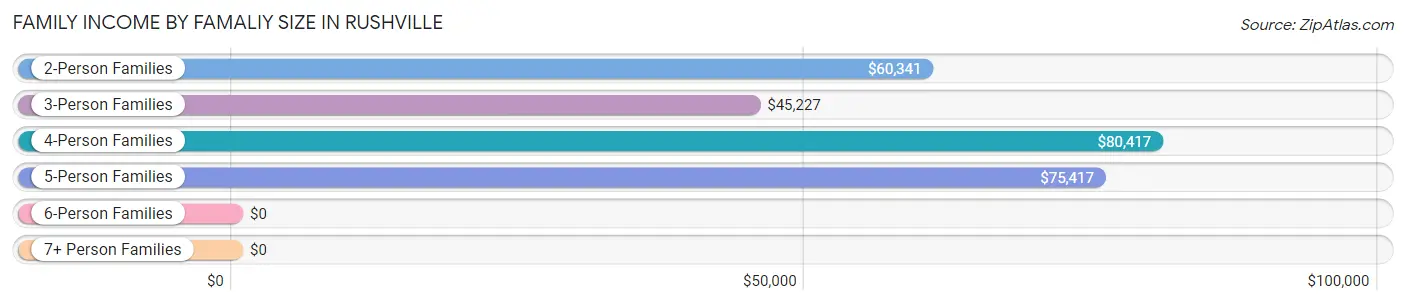
| Income Bracket | # Families | Median Income |
| 2-Person Families | 719 (48.9%) | $60,341 |
| 3-Person Families | 306 (20.8%) | $45,227 |
| 4-Person Families | 210 (14.3%) | $80,417 |
| 5-Person Families | 196 (13.3%) | $75,417 |
| 6-Person Families | 39 (2.6%) | $0 |
| 7+ Person Families | 0 (0.0%) | $0 |
| Total | 1,470 (100.0%) | $61,607 |
Family Income by Number of Earners in Rushville
The median family income in Rushville is $61,607, with families comprising 3+ earners (110) having the highest median family income of $93,269, while families with no earners (113) have the lowest median family income of $36,483, accounting for 7.5% and 7.7% of families, respectively.
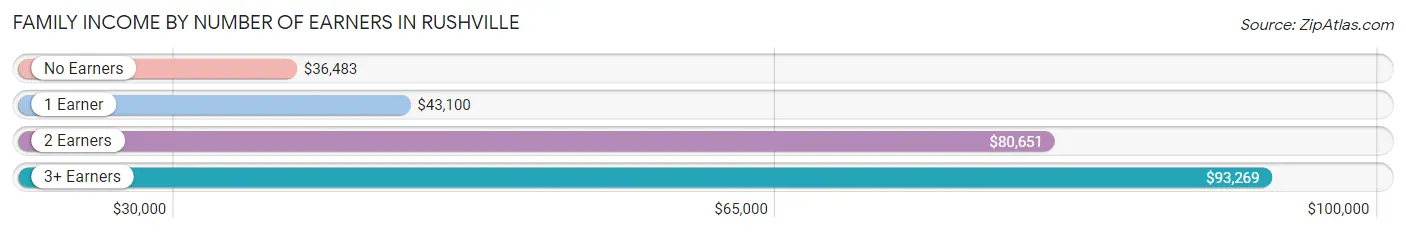
| Number of Earners | # Families | Median Income |
| No Earners | 113 (7.7%) | $36,483 |
| 1 Earner | 460 (31.3%) | $43,100 |
| 2 Earners | 787 (53.5%) | $80,651 |
| 3+ Earners | 110 (7.5%) | $93,269 |
| Total | 1,470 (100.0%) | $61,607 |
Household Income in Rushville
Household Income Brackets in Rushville
With 502 households falling in the category, the $50,000 to $74,999 income range is the most frequent in Rushville, accounting for 19.9% of all households. In contrast, only 53 households (2.1%) fall into the $200,000+ income bracket, making it the least populous group.
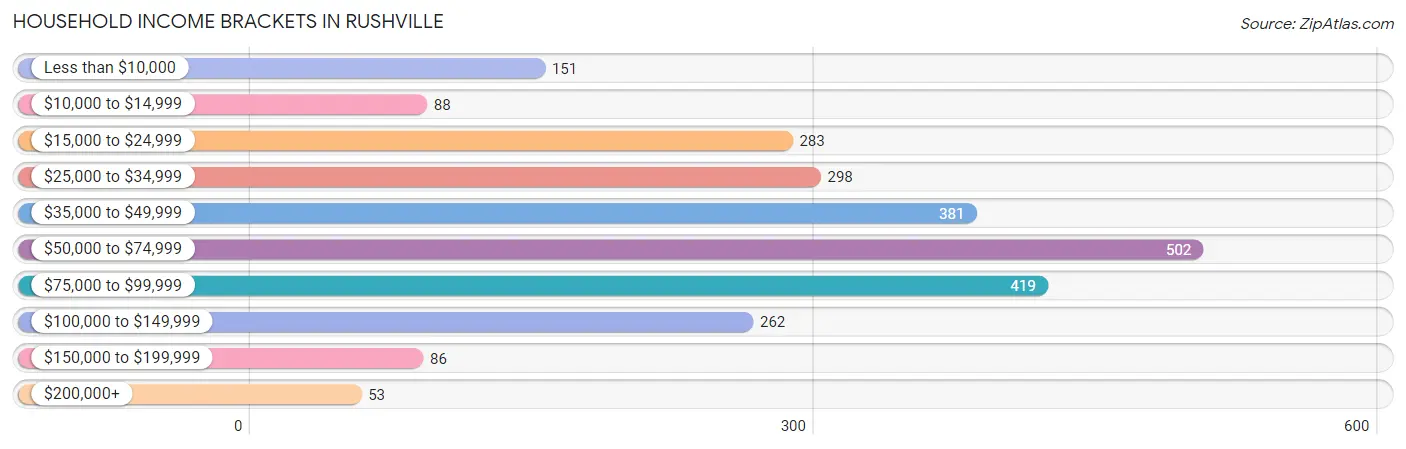
| Income Bracket | # Households | % Households |
| Less than $10,000 | 151 | 6.0% |
| $10,000 to $14,999 | 88 | 3.5% |
| $15,000 to $24,999 | 283 | 11.2% |
| $25,000 to $34,999 | 298 | 11.8% |
| $35,000 to $49,999 | 381 | 15.1% |
| $50,000 to $74,999 | 502 | 19.9% |
| $75,000 to $99,999 | 419 | 16.6% |
| $100,000 to $149,999 | 262 | 10.4% |
| $150,000 to $199,999 | 86 | 3.4% |
| $200,000+ | 53 | 2.1% |
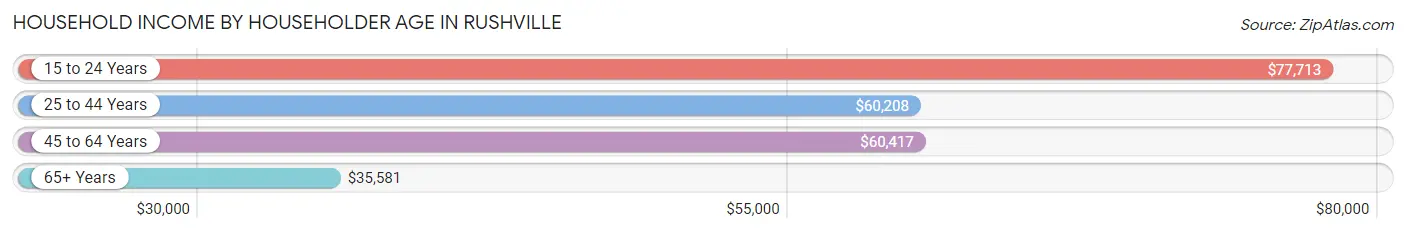
Household Income by Householder Age in Rushville
The median household income in Rushville is $53,110, with the highest median household income of $77,713 found in the 15 to 24 years age bracket for the primary householder. A total of 102 households (4.0%) fall into this category. Meanwhile, the 65+ years age bracket for the primary householder has the lowest median household income of $35,581, with 580 households (23.0%) in this group.
| Income Bracket | # Households | Median Income |
| 15 to 24 Years | 102 (4.0%) | $77,713 |
| 25 to 44 Years | 749 (29.7%) | $60,208 |
| 45 to 64 Years | 1,093 (43.3%) | $60,417 |
| 65+ Years | 580 (23.0%) | $35,581 |
| Total | 2,524 (100.0%) | $53,110 |
Poverty in Rushville
Income Below Poverty by Sex and Age in Rushville
With 13.4% poverty level for males and 16.7% for females among the residents of Rushville, 16 and 17 year old males and 15 year old females are the most vulnerable to poverty, with 29 males (32.6%) and 70 females (64.8%) in their respective age groups living below the poverty level.
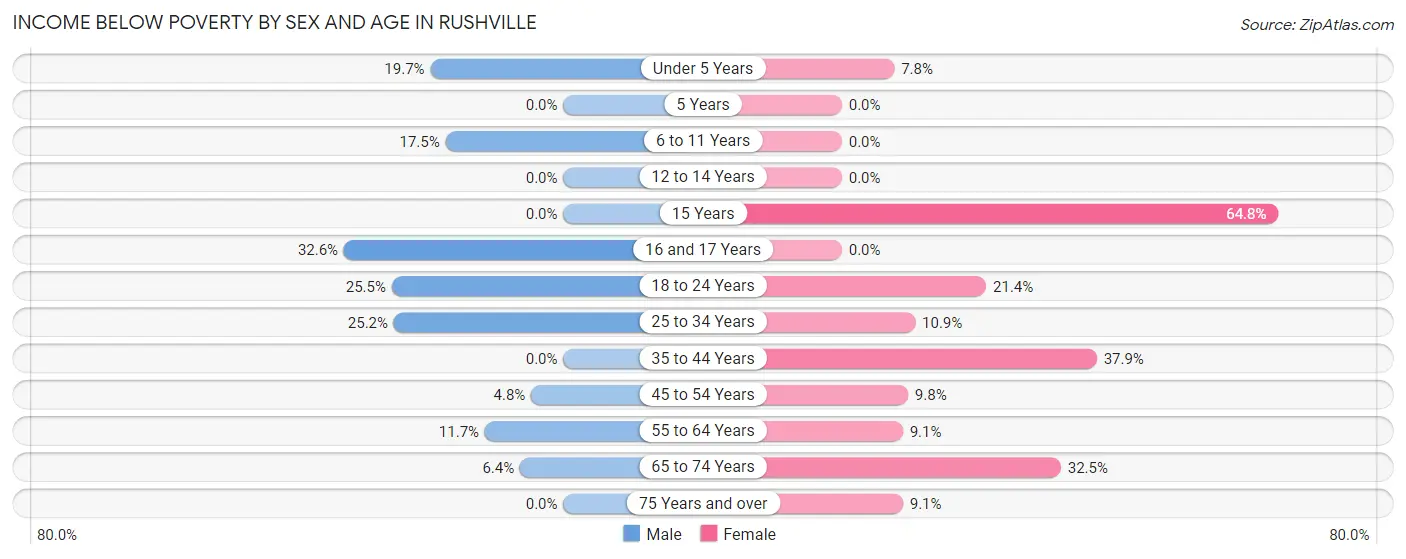
| Age Bracket | Male | Female |
| Under 5 Years | 30 (19.7%) | 12 (7.8%) |
| 5 Years | 0 (0.0%) | 0 (0.0%) |
| 6 to 11 Years | 60 (17.5%) | 0 (0.0%) |
| 12 to 14 Years | 0 (0.0%) | 0 (0.0%) |
| 15 Years | 0 (0.0%) | 70 (64.8%) |
| 16 and 17 Years | 29 (32.6%) | 0 (0.0%) |
| 18 to 24 Years | 81 (25.5%) | 81 (21.4%) |
| 25 to 34 Years | 109 (25.2%) | 44 (10.9%) |
| 35 to 44 Years | 0 (0.0%) | 148 (37.9%) |
| 45 to 54 Years | 16 (4.8%) | 38 (9.8%) |
| 55 to 64 Years | 70 (11.7%) | 41 (9.0%) |
| 65 to 74 Years | 9 (6.4%) | 80 (32.5%) |
| 75 Years and over | 0 (0.0%) | 26 (9.1%) |
| Total | 404 (13.4%) | 540 (16.7%) |
Income Above Poverty by Sex and Age in Rushville
According to the poverty statistics in Rushville, males aged 5 years and females aged 5 years are the age groups that are most secure financially, with 100.0% of males and 100.0% of females in these age groups living above the poverty line.
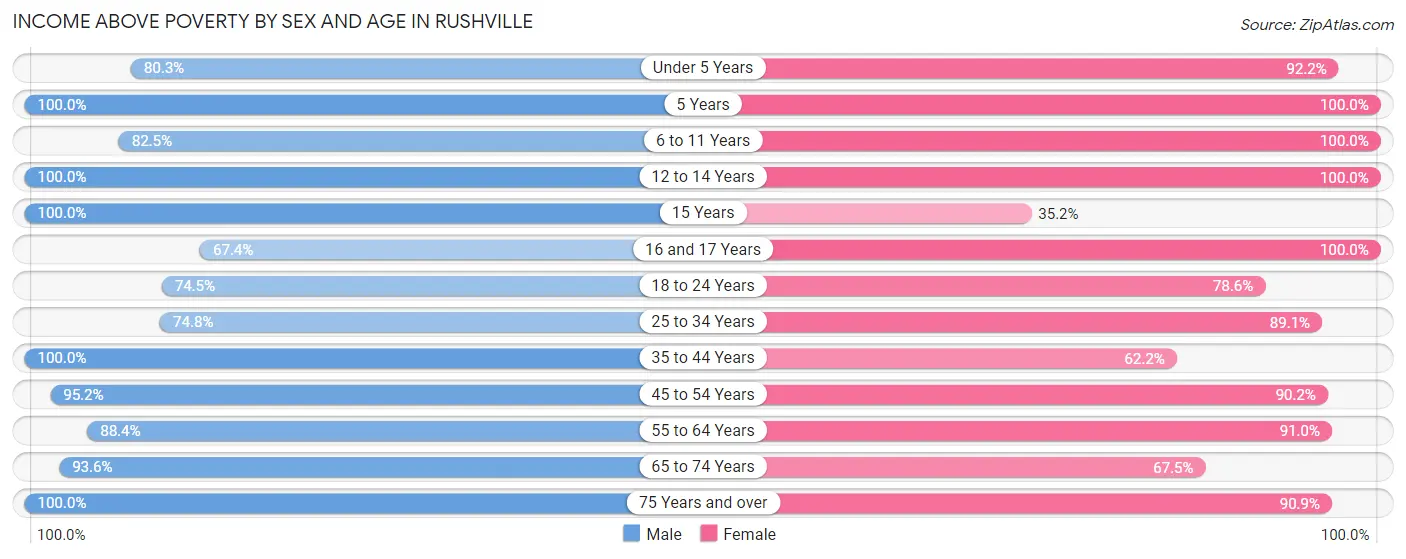
| Age Bracket | Male | Female |
| Under 5 Years | 122 (80.3%) | 142 (92.2%) |
| 5 Years | 7 (100.0%) | 13 (100.0%) |
| 6 to 11 Years | 283 (82.5%) | 160 (100.0%) |
| 12 to 14 Years | 101 (100.0%) | 121 (100.0%) |
| 15 Years | 3 (100.0%) | 38 (35.2%) |
| 16 and 17 Years | 60 (67.4%) | 127 (100.0%) |
| 18 to 24 Years | 237 (74.5%) | 297 (78.6%) |
| 25 to 34 Years | 324 (74.8%) | 360 (89.1%) |
| 35 to 44 Years | 346 (100.0%) | 243 (62.2%) |
| 45 to 54 Years | 319 (95.2%) | 349 (90.2%) |
| 55 to 64 Years | 531 (88.3%) | 412 (90.9%) |
| 65 to 74 Years | 131 (93.6%) | 166 (67.5%) |
| 75 Years and over | 141 (100.0%) | 261 (90.9%) |
| Total | 2,605 (86.6%) | 2,689 (83.3%) |
Income Below Poverty Among Married-Couple Families in Rushville
The poverty statistics for married-couple families in Rushville show that 2.9% or 28 of the total 982 families live below the poverty line. Families with no children have the highest poverty rate of 4.4%, comprising of 28 families. On the other hand, families with 1 or 2 children have the lowest poverty rate of 0.0%, which includes 0 families.
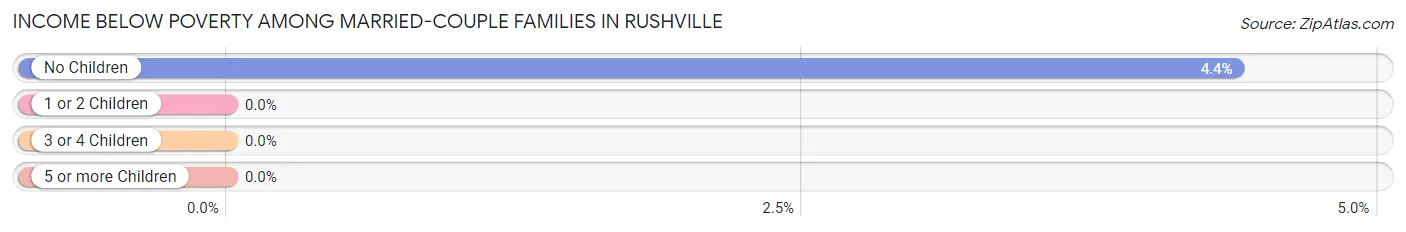
| Children | Above Poverty | Below Poverty |
| No Children | 611 (95.6%) | 28 (4.4%) |
| 1 or 2 Children | 208 (100.0%) | 0 (0.0%) |
| 3 or 4 Children | 135 (100.0%) | 0 (0.0%) |
| 5 or more Children | 0 (0.0%) | 0 (0.0%) |
| Total | 954 (97.2%) | 28 (2.9%) |
Income Below Poverty Among Single-Parent Households in Rushville
According to the poverty data in Rushville, 7.2% or 10 single-father households and 24.9% or 87 single-mother households are living below the poverty line. Among single-father households, those with 1 or 2 children have the highest poverty rate, with 10 households (35.7%) experiencing poverty. Likewise, among single-mother households, those with 1 or 2 children have the highest poverty rate, with 76 households (32.1%) falling below the poverty line.
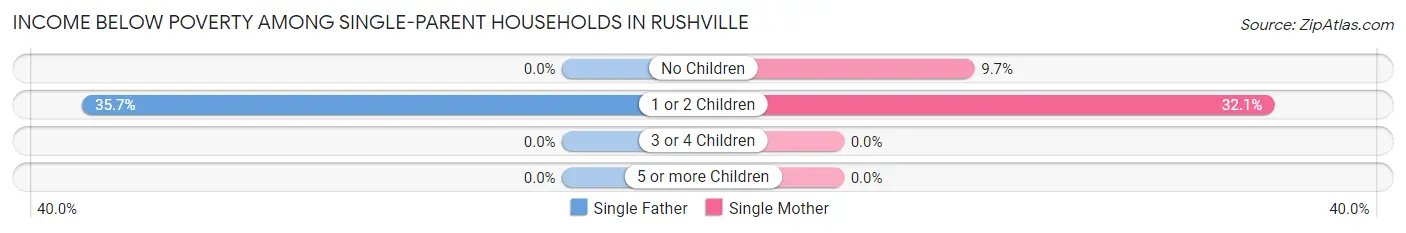
| Children | Single Father | Single Mother |
| No Children | 0 (0.0%) | 11 (9.7%) |
| 1 or 2 Children | 10 (35.7%) | 76 (32.1%) |
| 3 or 4 Children | 0 (0.0%) | 0 (0.0%) |
| 5 or more Children | 0 (0.0%) | 0 (0.0%) |
| Total | 10 (7.2%) | 87 (24.9%) |
Income Below Poverty Among Married-Couple vs Single-Parent Households in Rushville
The poverty data for Rushville shows that 28 of the married-couple family households (2.9%) and 97 of the single-parent households (19.9%) are living below the poverty level. Within the married-couple family households, those with no children have the highest poverty rate, with 28 households (4.4%) falling below the poverty line. Among the single-parent households, those with 1 or 2 children have the highest poverty rate, with 86 household (32.5%) living below poverty.
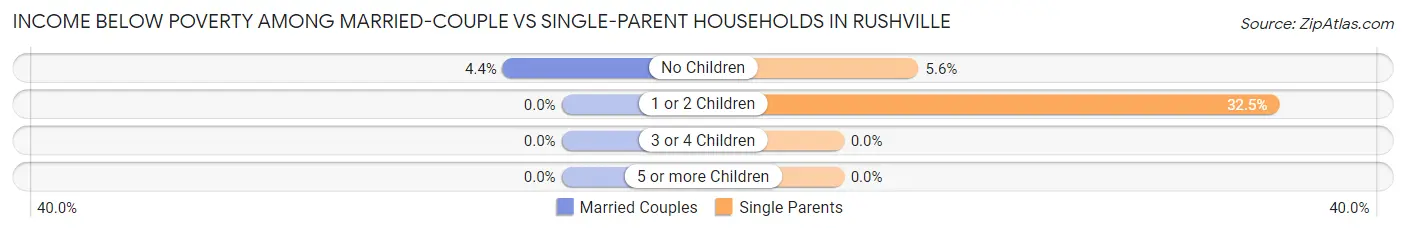
| Children | Married-Couple Families | Single-Parent Households |
| No Children | 28 (4.4%) | 11 (5.6%) |
| 1 or 2 Children | 0 (0.0%) | 86 (32.5%) |
| 3 or 4 Children | 0 (0.0%) | 0 (0.0%) |
| 5 or more Children | 0 (0.0%) | 0 (0.0%) |
| Total | 28 (2.9%) | 97 (19.9%) |
Race in Rushville
The most populous races in Rushville are White / Caucasian (6,107 | 95.2%), Hispanic or Latino (230 | 3.6%), and Two or more Races (202 | 3.2%).
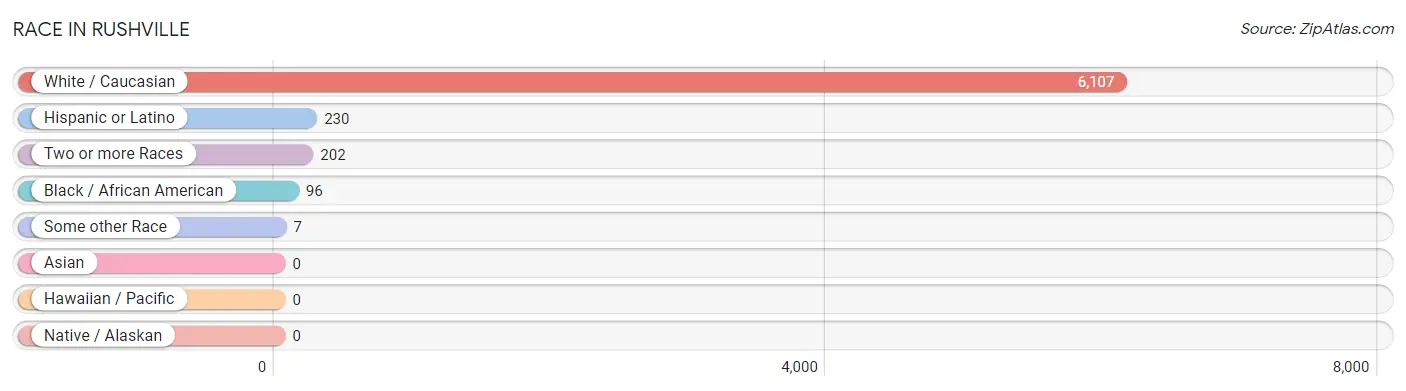
| Race | # Population | % Population |
| Asian | 0 | 0.0% |
| Black / African American | 96 | 1.5% |
| Hawaiian / Pacific | 0 | 0.0% |
| Hispanic or Latino | 230 | 3.6% |
| Native / Alaskan | 0 | 0.0% |
| White / Caucasian | 6,107 | 95.2% |
| Two or more Races | 202 | 3.2% |
| Some other Race | 7 | 0.1% |
| Total | 6,412 | 100.0% |
Ancestry in Rushville
The most populous ancestries reported in Rushville are German (1,143 | 17.8%), Irish (849 | 13.2%), English (832 | 13.0%), American (724 | 11.3%), and Mexican (208 | 3.2%), together accounting for 58.6% of all Rushville residents.
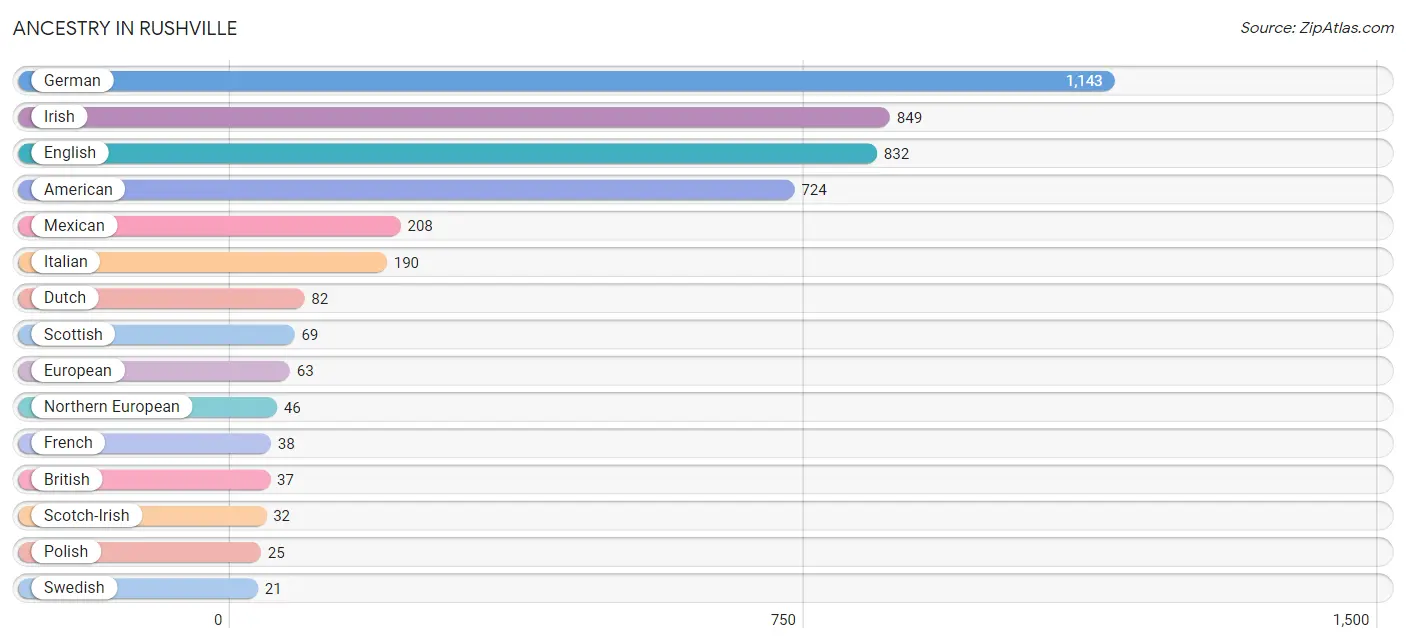
| Ancestry | # Population | % Population |
| American | 724 | 11.3% |
| Belgian | 13 | 0.2% |
| British | 37 | 0.6% |
| Canadian | 8 | 0.1% |
| Cherokee | 16 | 0.3% |
| Dutch | 82 | 1.3% |
| English | 832 | 13.0% |
| European | 63 | 1.0% |
| French | 38 | 0.6% |
| German | 1,143 | 17.8% |
| Irish | 849 | 13.2% |
| Italian | 190 | 3.0% |
| Jamaican | 8 | 0.1% |
| Mexican | 208 | 3.2% |
| Northern European | 46 | 0.7% |
| Polish | 25 | 0.4% |
| Romanian | 20 | 0.3% |
| Scotch-Irish | 32 | 0.5% |
| Scottish | 69 | 1.1% |
| Swedish | 21 | 0.3% |
| Welsh | 13 | 0.2% | View All 21 Rows |
Immigrants in Rushville
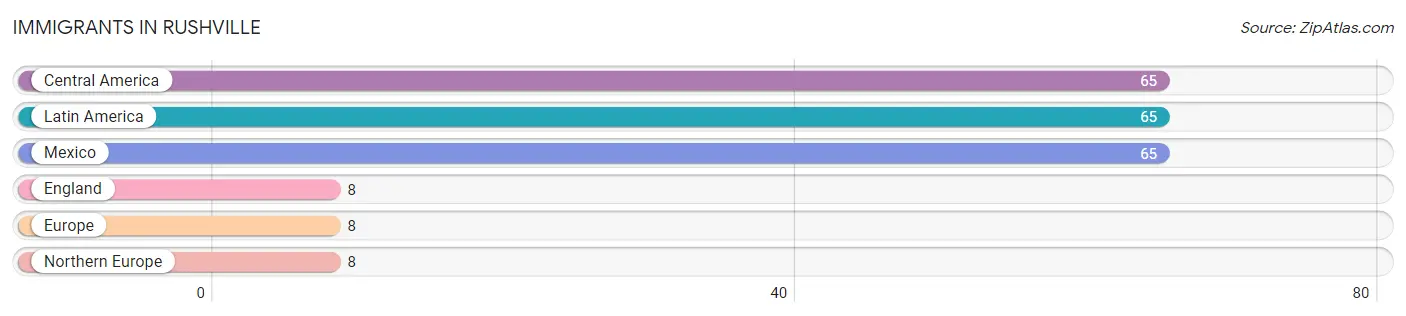
The most numerous immigrant groups reported in Rushville came from Central America (65 | 1.0%), Latin America (65 | 1.0%), Mexico (65 | 1.0%), England (8 | 0.1%), and Europe (8 | 0.1%), together accounting for 3.3% of all Rushville residents.
| Immigration Origin | # Population | % Population |
| Central America | 65 | 1.0% |
| England | 8 | 0.1% |
| Europe | 8 | 0.1% |
| Latin America | 65 | 1.0% |
| Mexico | 65 | 1.0% |
| Northern Europe | 8 | 0.1% | View All 6 Rows |
Sex and Age in Rushville
Sex and Age in Rushville
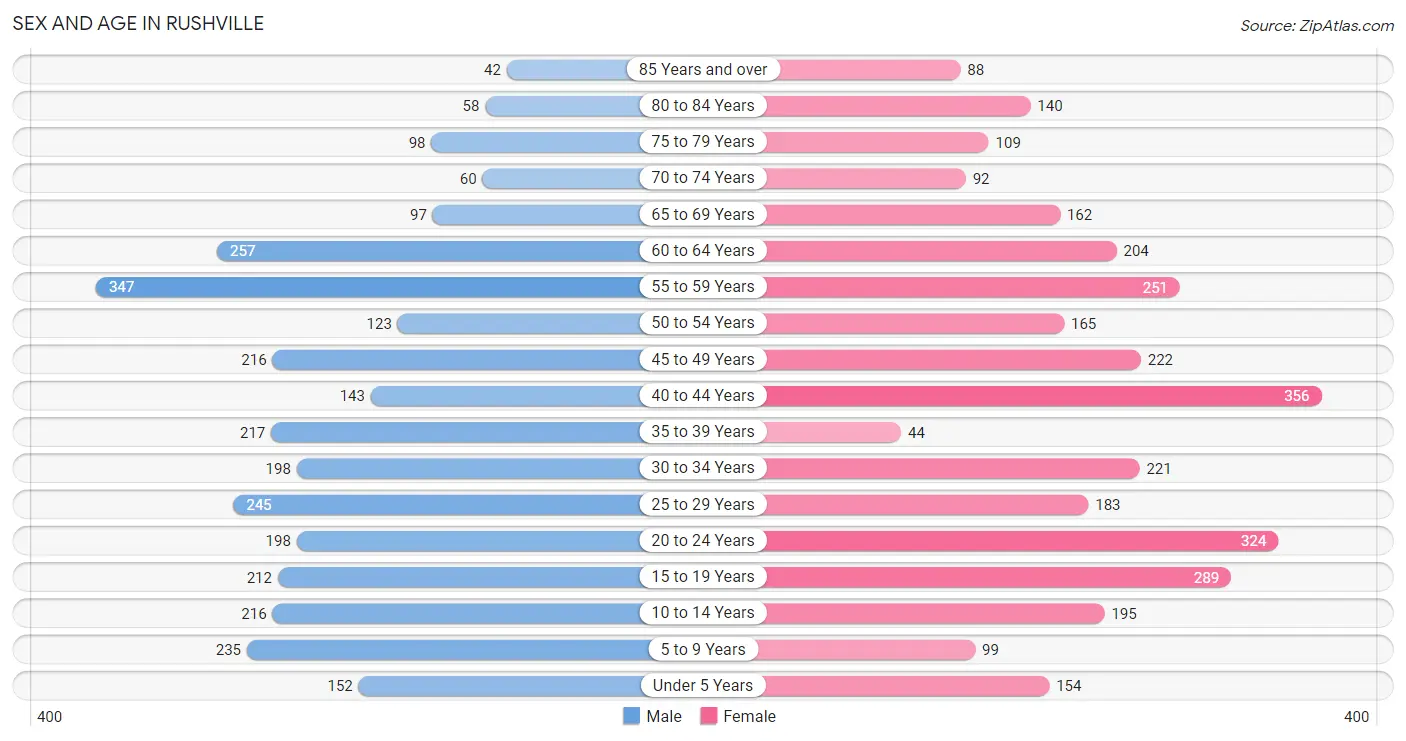
The most populous age groups in Rushville are 55 to 59 Years (347 | 11.1%) for men and 40 to 44 Years (356 | 10.8%) for women.
| Age Bracket | Male | Female |
| Under 5 Years | 152 (4.9%) | 154 (4.7%) |
| 5 to 9 Years | 235 (7.5%) | 99 (3.0%) |
| 10 to 14 Years | 216 (6.9%) | 195 (5.9%) |
| 15 to 19 Years | 212 (6.8%) | 289 (8.8%) |
| 20 to 24 Years | 198 (6.4%) | 324 (9.8%) |
| 25 to 29 Years | 245 (7.9%) | 183 (5.6%) |
| 30 to 34 Years | 198 (6.4%) | 221 (6.7%) |
| 35 to 39 Years | 217 (7.0%) | 44 (1.3%) |
| 40 to 44 Years | 143 (4.6%) | 356 (10.8%) |
| 45 to 49 Years | 216 (6.9%) | 222 (6.7%) |
| 50 to 54 Years | 123 (4.0%) | 165 (5.0%) |
| 55 to 59 Years | 347 (11.1%) | 251 (7.6%) |
| 60 to 64 Years | 257 (8.3%) | 204 (6.2%) |
| 65 to 69 Years | 97 (3.1%) | 162 (4.9%) |
| 70 to 74 Years | 60 (1.9%) | 92 (2.8%) |
| 75 to 79 Years | 98 (3.2%) | 109 (3.3%) |
| 80 to 84 Years | 58 (1.9%) | 140 (4.2%) |
| 85 Years and over | 42 (1.3%) | 88 (2.7%) |
| Total | 3,114 (100.0%) | 3,298 (100.0%) |
Families and Households in Rushville
Median Family Size in Rushville
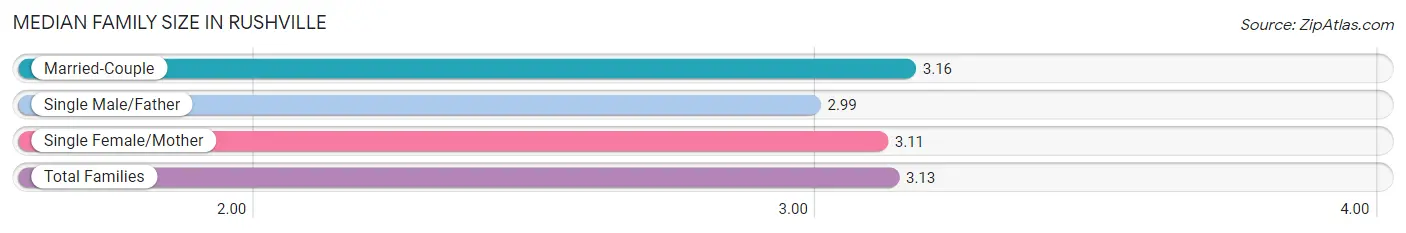
The median family size in Rushville is 3.13 persons per family, with married-couple families (982 | 66.8%) accounting for the largest median family size of 3.16 persons per family. On the other hand, single male/father families (138 | 9.4%) represent the smallest median family size with 2.99 persons per family.
| Family Type | # Families | Family Size |
| Married-Couple | 982 (66.8%) | 3.16 |
| Single Male/Father | 138 (9.4%) | 2.99 |
| Single Female/Mother | 350 (23.8%) | 3.11 |
| Total Families | 1,470 (100.0%) | 3.13 |
Median Household Size in Rushville
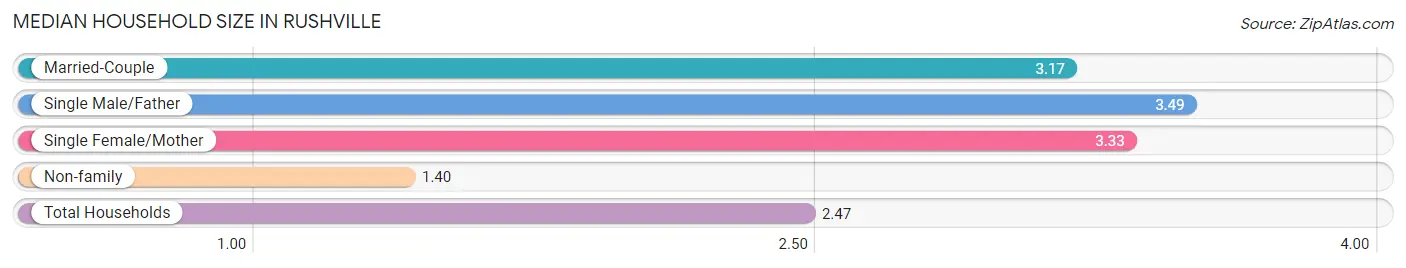
The median household size in Rushville is 2.47 persons per household, with single male/father households (138 | 5.5%) accounting for the largest median household size of 3.49 persons per household. non-family households (1,054 | 41.8%) represent the smallest median household size with 1.40 persons per household.
| Household Type | # Households | Household Size |
| Married-Couple | 982 (38.9%) | 3.17 |
| Single Male/Father | 138 (5.5%) | 3.49 |
| Single Female/Mother | 350 (13.9%) | 3.33 |
| Non-family | 1,054 (41.8%) | 1.40 |
| Total Households | 2,524 (100.0%) | 2.47 |
Household Size by Marriage Status in Rushville
Out of a total of 2,524 households in Rushville, 1,470 (58.2%) are family households, while 1,054 (41.8%) are nonfamily households. The most numerous type of family households are 2-person households, comprising 646, and the most common type of nonfamily households are 1-person households, comprising 756.
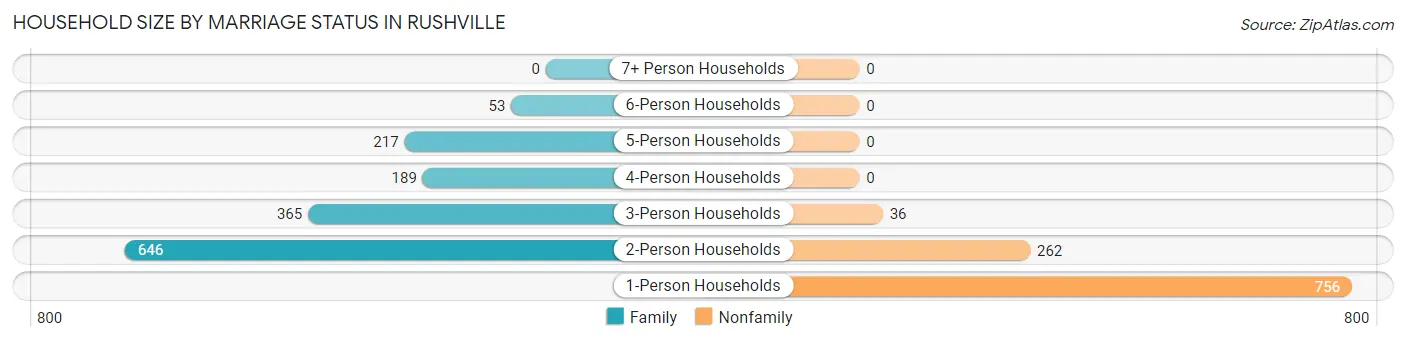
| Household Size | Family Households | Nonfamily Households |
| 1-Person Households | - | 756 (29.9%) |
| 2-Person Households | 646 (25.6%) | 262 (10.4%) |
| 3-Person Households | 365 (14.5%) | 36 (1.4%) |
| 4-Person Households | 189 (7.5%) | 0 (0.0%) |
| 5-Person Households | 217 (8.6%) | 0 (0.0%) |
| 6-Person Households | 53 (2.1%) | 0 (0.0%) |
| 7+ Person Households | 0 (0.0%) | 0 (0.0%) |
| Total | 1,470 (58.2%) | 1,054 (41.8%) |
Female Fertility in Rushville
Fertility by Age in Rushville
Average fertility rate in Rushville is 64.0 births per 1,000 women. Women in the age bracket of 20 to 34 years have the highest fertility rate with 124.0 births per 1,000 women. Women in the age bracket of 20 to 34 years acount for 82.6% of all women with births.
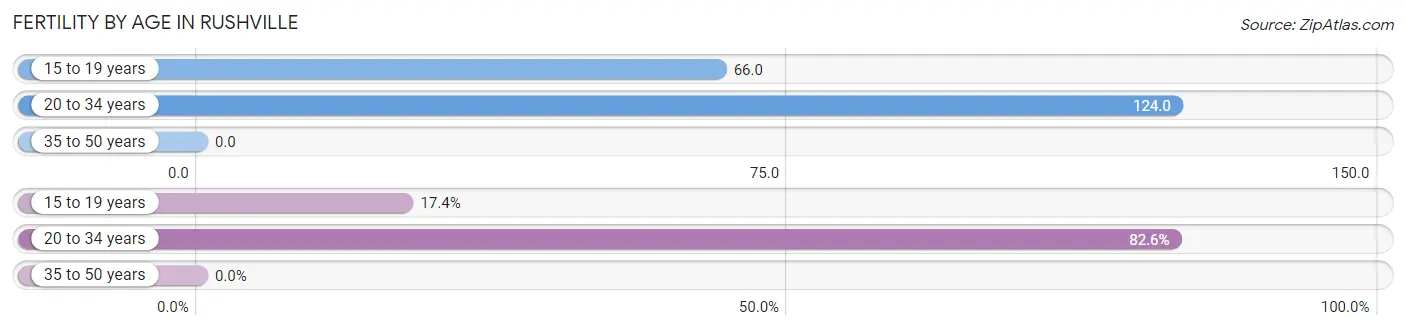
| Age Bracket | Women with Births | Births / 1,000 Women |
| 15 to 19 years | 19 (17.4%) | 66.0 |
| 20 to 34 years | 90 (82.6%) | 124.0 |
| 35 to 50 years | 0 (0.0%) | 0.0 |
| Total | 109 (100.0%) | 64.0 |
Fertility by Age by Marriage Status in Rushville
73.4% of women with births (109) in Rushville are married. The highest percentage of unmarried women with births falls into 15 to 19 years age bracket with 100.0% of them unmarried at the time of birth, while the lowest percentage of unmarried women with births belong to 20 to 34 years age bracket with 11.1% of them unmarried.
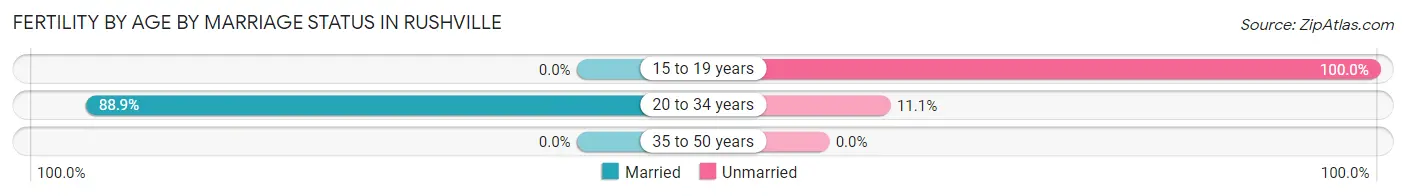
| Age Bracket | Married | Unmarried |
| 15 to 19 years | 0 (0.0%) | 19 (100.0%) |
| 20 to 34 years | 80 (88.9%) | 10 (11.1%) |
| 35 to 50 years | 0 (0.0%) | 0 (0.0%) |
| Total | 80 (73.4%) | 29 (26.6%) |
Fertility by Education in Rushville
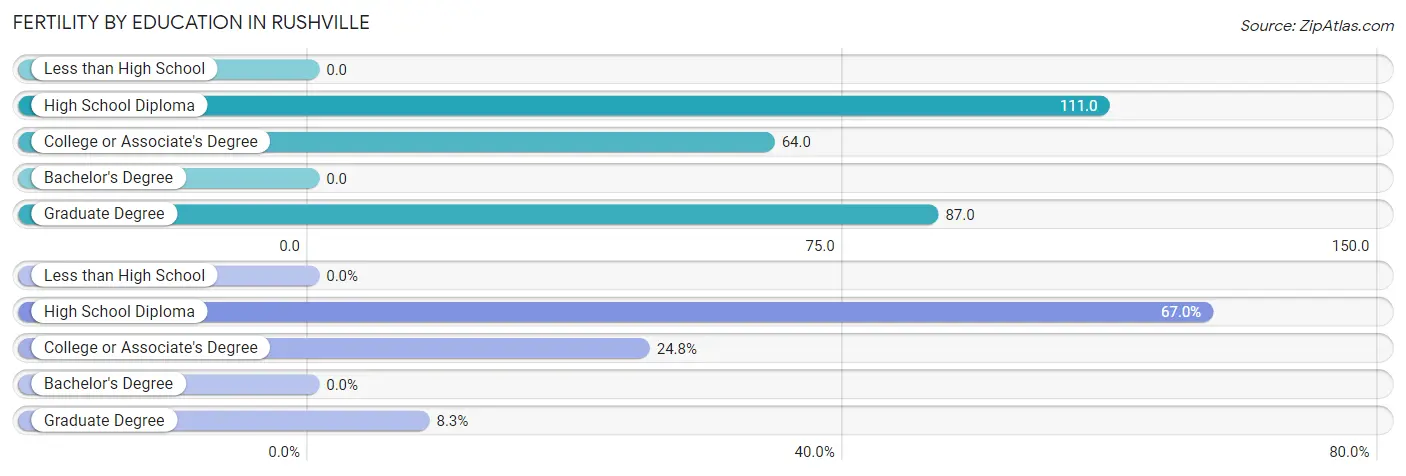
| Educational Attainment | Women with Births | Births / 1,000 Women |
| Less than High School | 0 (0.0%) | 0.0 |
| High School Diploma | 73 (67.0%) | 111.0 |
| College or Associate's Degree | 27 (24.8%) | 64.0 |
| Bachelor's Degree | 0 (0.0%) | 0.0 |
| Graduate Degree | 9 (8.3%) | 87.0 |
| Total | 109 (100.0%) | 64.0 |
Fertility by Education by Marriage Status in Rushville
26.6% of women with births in Rushville are unmarried. Women with the educational attainment of college or associate's degree are most likely to be married with 100.0% of them married at childbirth, while women with the educational attainment of high school diploma are least likely to be married with 39.7% of them unmarried at childbirth.
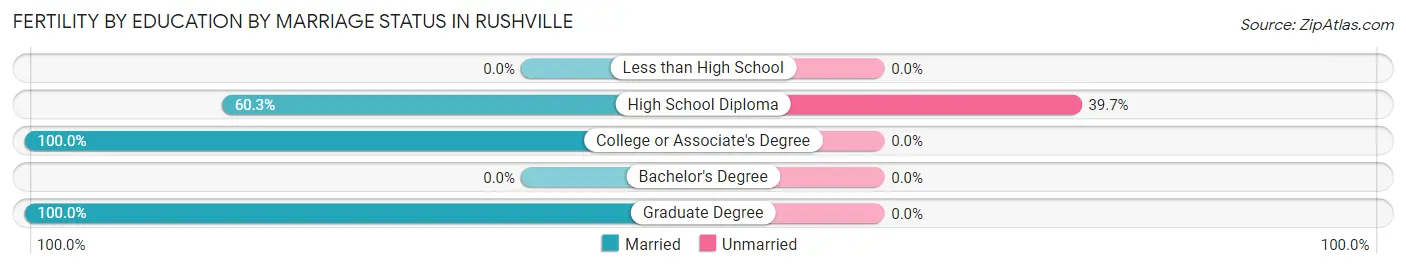
| Educational Attainment | Married | Unmarried |
| Less than High School | 0 (0.0%) | 0 (0.0%) |
| High School Diploma | 44 (60.3%) | 29 (39.7%) |
| College or Associate's Degree | 27 (100.0%) | 0 (0.0%) |
| Bachelor's Degree | 0 (0.0%) | 0 (0.0%) |
| Graduate Degree | 9 (100.0%) | 0 (0.0%) |
| Total | 80 (73.4%) | 29 (26.6%) |
Employment Characteristics in Rushville
Employment by Class of Employer in Rushville
Among the 2,588 employed individuals in Rushville, private company employees (2,008 | 77.6%), not-for-profit organizations (237 | 9.2%), and local government employees (128 | 5.0%) make up the most common classes of employment.
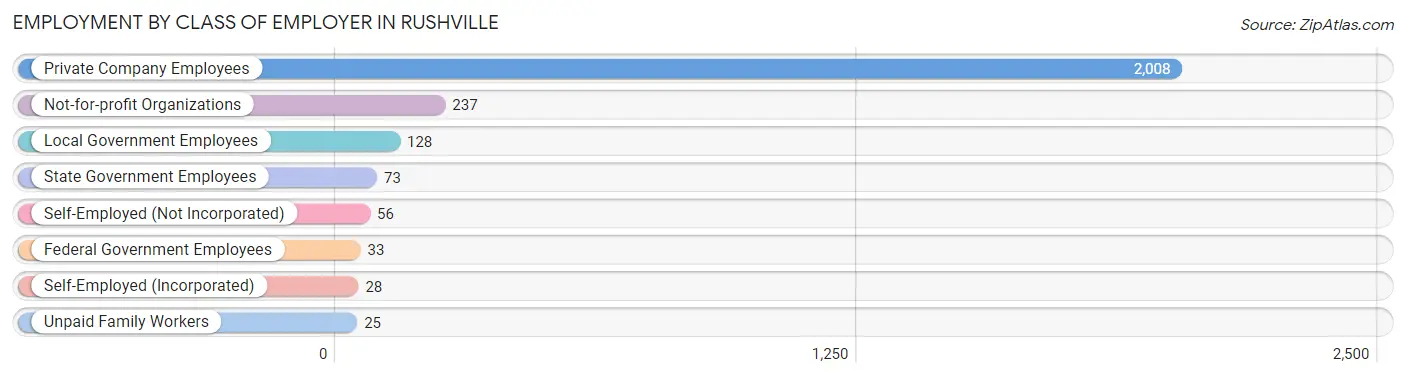
| Employer Class | # Employees | % Employees |
| Private Company Employees | 2,008 | 77.6% |
| Self-Employed (Incorporated) | 28 | 1.1% |
| Self-Employed (Not Incorporated) | 56 | 2.2% |
| Not-for-profit Organizations | 237 | 9.2% |
| Local Government Employees | 128 | 5.0% |
| State Government Employees | 73 | 2.8% |
| Federal Government Employees | 33 | 1.3% |
| Unpaid Family Workers | 25 | 1.0% |
| Total | 2,588 | 100.0% |
Employment Status by Age in Rushville
According to the labor force statistics for Rushville, out of the total population over 16 years of age (5,250), 57.9% or 3,040 individuals are in the labor force, with 9.6% or 292 of them unemployed. The age group with the highest labor force participation rate is 25 to 29 years, with 85.7% or 367 individuals in the labor force. Within the labor force, the 16 to 19 years age range has the highest percentage of unemployed individuals, with 30.8% or 44 of them being unemployed.
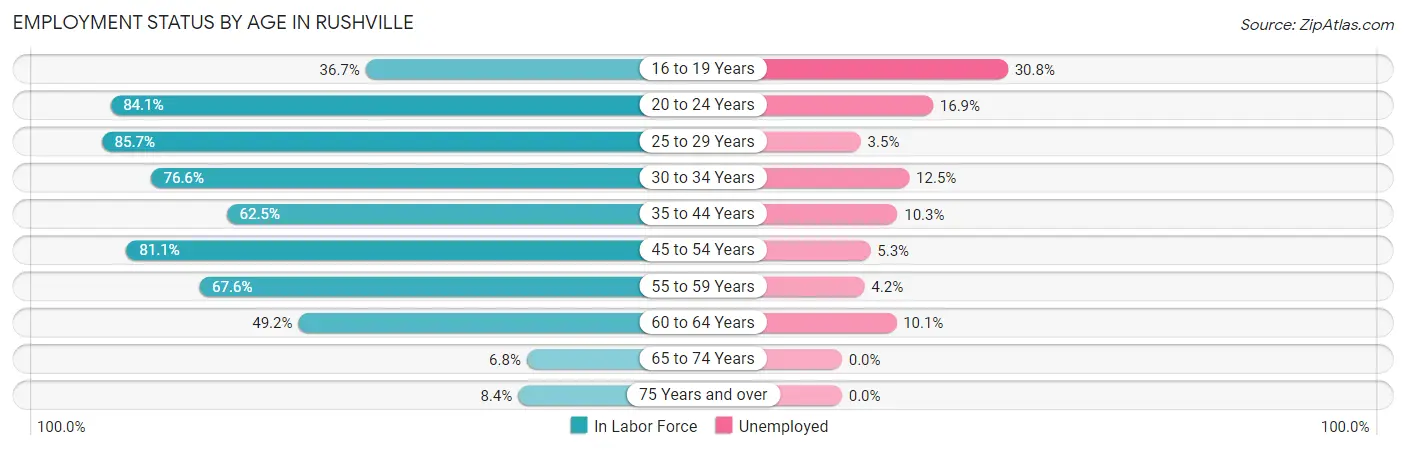
| Age Bracket | In Labor Force | Unemployed |
| 16 to 19 Years | 143 (36.7%) | 44 (30.8%) |
| 20 to 24 Years | 439 (84.1%) | 74 (16.9%) |
| 25 to 29 Years | 367 (85.7%) | 13 (3.5%) |
| 30 to 34 Years | 321 (76.6%) | 40 (12.5%) |
| 35 to 44 Years | 475 (62.5%) | 49 (10.3%) |
| 45 to 54 Years | 589 (81.1%) | 31 (5.3%) |
| 55 to 59 Years | 404 (67.6%) | 17 (4.2%) |
| 60 to 64 Years | 227 (49.2%) | 23 (10.1%) |
| 65 to 74 Years | 28 (6.8%) | 0 (0.0%) |
| 75 Years and over | 45 (8.4%) | 0 (0.0%) |
| Total | 3,040 (57.9%) | 292 (9.6%) |
Employment Status by Educational Attainment in Rushville
According to labor force statistics for Rushville, 70.3% of individuals (2,385) out of the total population between 25 and 64 years of age (3,392) are in the labor force, with 7.3% or 174 of them being unemployed. The group with the highest labor force participation rate are those with the educational attainment of bachelor's degree or higher, with 92.1% or 476 individuals in the labor force. Within the labor force, individuals with less than high school education have the highest percentage of unemployment, with 13.3% or 40 of them being unemployed.
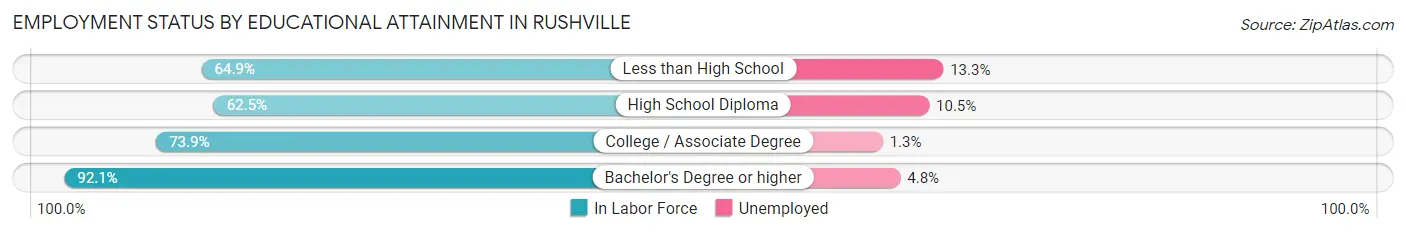
| Educational Attainment | In Labor Force | Unemployed |
| Less than High School | 300 (64.9%) | 61 (13.3%) |
| High School Diploma | 968 (62.5%) | 163 (10.5%) |
| College / Associate Degree | 639 (73.9%) | 11 (1.3%) |
| Bachelor's Degree or higher | 476 (92.1%) | 25 (4.8%) |
| Total | 2,385 (70.3%) | 248 (7.3%) |
Employment Occupations by Sex in Rushville
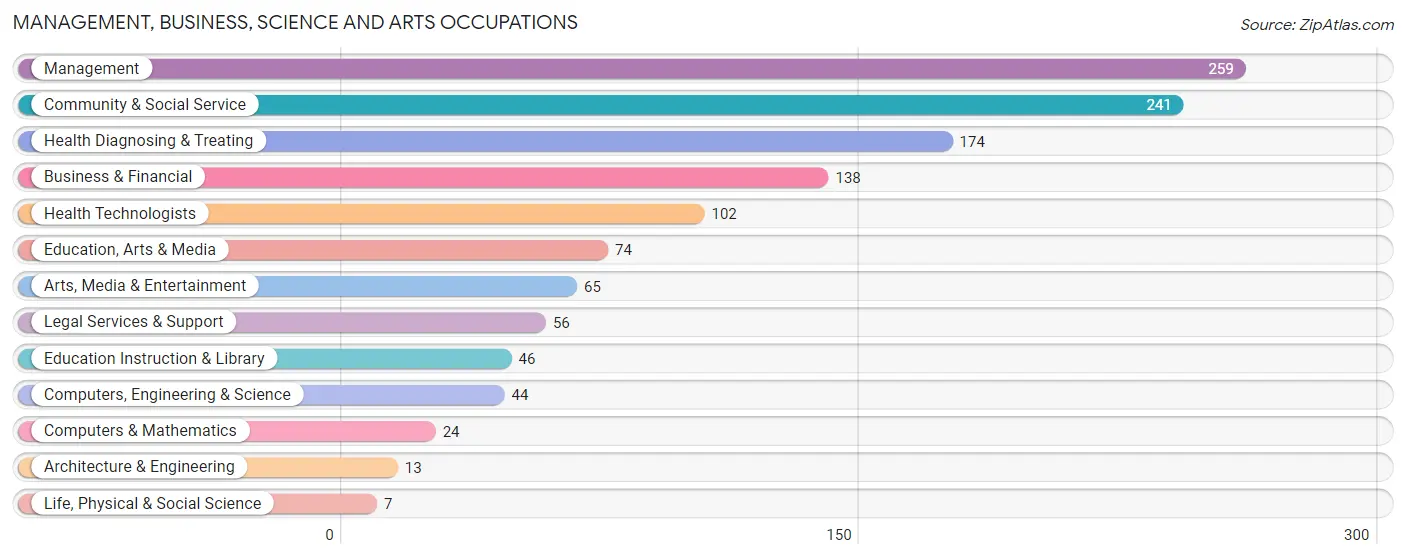
Management, Business, Science and Arts Occupations
The most common Management, Business, Science and Arts occupations in Rushville are Management (259 | 9.4%), Community & Social Service (241 | 8.8%), Health Diagnosing & Treating (174 | 6.3%), Business & Financial (138 | 5.0%), and Health Technologists (102 | 3.7%).
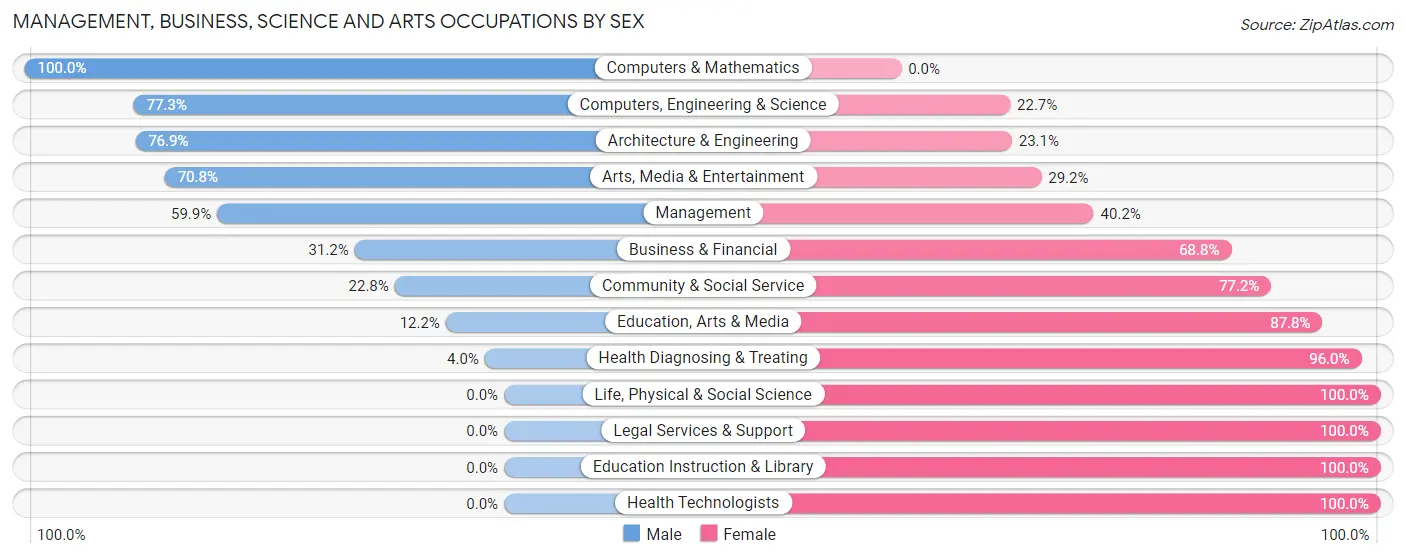
Management, Business, Science and Arts Occupations by Sex
Within the Management, Business, Science and Arts occupations in Rushville, the most male-oriented occupations are Computers & Mathematics (100.0%), Computers, Engineering & Science (77.3%), and Architecture & Engineering (76.9%), while the most female-oriented occupations are Life, Physical & Social Science (100.0%), Legal Services & Support (100.0%), and Education Instruction & Library (100.0%).
| Occupation | Male | Female |
| Management | 155 (59.9%) | 104 (40.2%) |
| Business & Financial | 43 (31.2%) | 95 (68.8%) |
| Computers, Engineering & Science | 34 (77.3%) | 10 (22.7%) |
| Computers & Mathematics | 24 (100.0%) | 0 (0.0%) |
| Architecture & Engineering | 10 (76.9%) | 3 (23.1%) |
| Life, Physical & Social Science | 0 (0.0%) | 7 (100.0%) |
| Community & Social Service | 55 (22.8%) | 186 (77.2%) |
| Education, Arts & Media | 9 (12.2%) | 65 (87.8%) |
| Legal Services & Support | 0 (0.0%) | 56 (100.0%) |
| Education Instruction & Library | 0 (0.0%) | 46 (100.0%) |
| Arts, Media & Entertainment | 46 (70.8%) | 19 (29.2%) |
| Health Diagnosing & Treating | 7 (4.0%) | 167 (96.0%) |
| Health Technologists | 0 (0.0%) | 102 (100.0%) |
| Total (Category) | 294 (34.4%) | 562 (65.6%) |
| Total (Overall) | 1,288 (46.9%) | 1,459 (53.1%) |
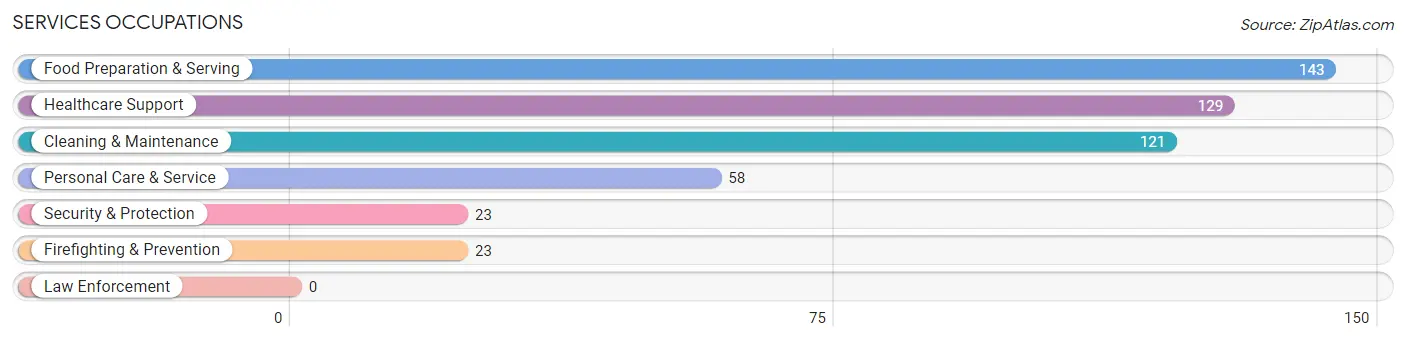
Services Occupations
The most common Services occupations in Rushville are Food Preparation & Serving (143 | 5.2%), Healthcare Support (129 | 4.7%), Cleaning & Maintenance (121 | 4.4%), Personal Care & Service (58 | 2.1%), and Security & Protection (23 | 0.8%).
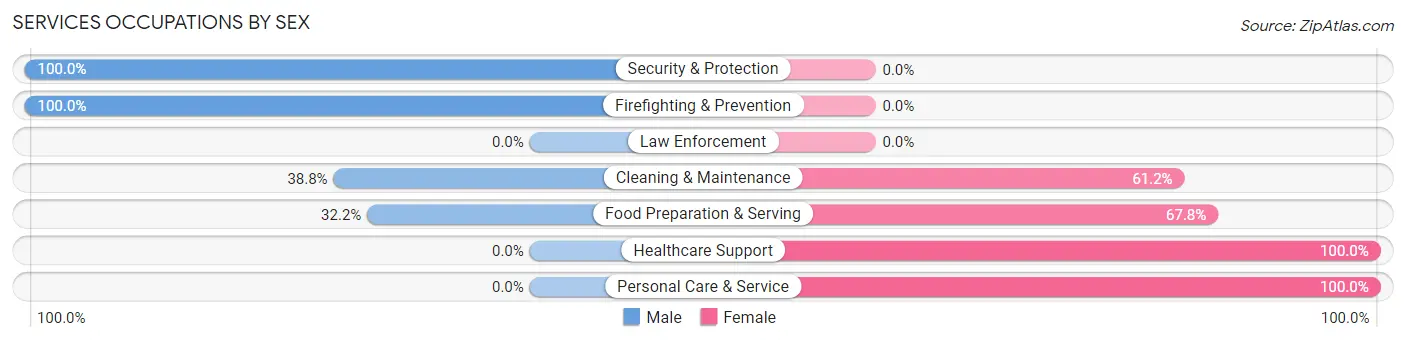
Services Occupations by Sex
Within the Services occupations in Rushville, the most male-oriented occupations are Security & Protection (100.0%), Firefighting & Prevention (100.0%), and Cleaning & Maintenance (38.8%), while the most female-oriented occupations are Healthcare Support (100.0%), Personal Care & Service (100.0%), and Food Preparation & Serving (67.8%).
| Occupation | Male | Female |
| Healthcare Support | 0 (0.0%) | 129 (100.0%) |
| Security & Protection | 23 (100.0%) | 0 (0.0%) |
| Firefighting & Prevention | 23 (100.0%) | 0 (0.0%) |
| Law Enforcement | 0 (0.0%) | 0 (0.0%) |
| Food Preparation & Serving | 46 (32.2%) | 97 (67.8%) |
| Cleaning & Maintenance | 47 (38.8%) | 74 (61.2%) |
| Personal Care & Service | 0 (0.0%) | 58 (100.0%) |
| Total (Category) | 116 (24.5%) | 358 (75.5%) |
| Total (Overall) | 1,288 (46.9%) | 1,459 (53.1%) |
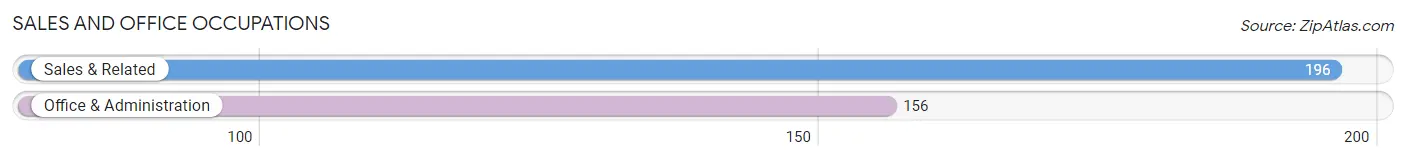
Sales and Office Occupations
The most common Sales and Office occupations in Rushville are Sales & Related (196 | 7.1%), and Office & Administration (156 | 5.7%).
Sales and Office Occupations by Sex
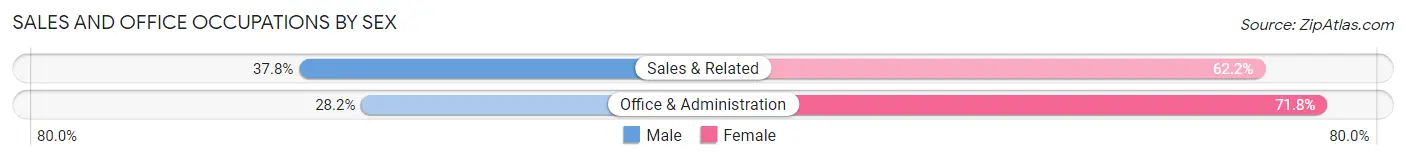
| Occupation | Male | Female |
| Sales & Related | 74 (37.8%) | 122 (62.2%) |
| Office & Administration | 44 (28.2%) | 112 (71.8%) |
| Total (Category) | 118 (33.5%) | 234 (66.5%) |
| Total (Overall) | 1,288 (46.9%) | 1,459 (53.1%) |
Natural Resources, Construction and Maintenance Occupations
The most common Natural Resources, Construction and Maintenance occupations in Rushville are Installation, Maintenance & Repair (124 | 4.5%), Construction & Extraction (108 | 3.9%), and Farming, Fishing & Forestry (32 | 1.2%).

Natural Resources, Construction and Maintenance Occupations by Sex
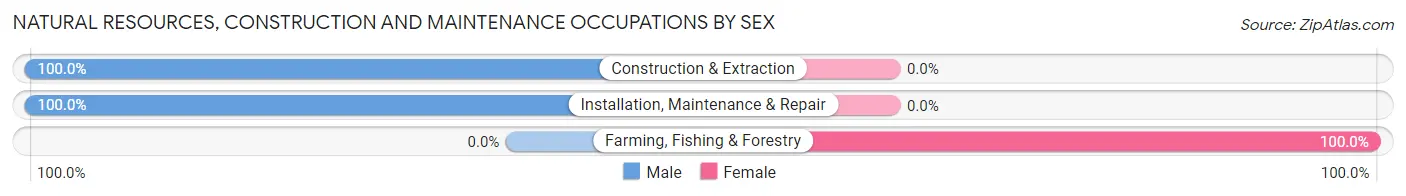
| Occupation | Male | Female |
| Farming, Fishing & Forestry | 0 (0.0%) | 32 (100.0%) |
| Construction & Extraction | 108 (100.0%) | 0 (0.0%) |
| Installation, Maintenance & Repair | 124 (100.0%) | 0 (0.0%) |
| Total (Category) | 232 (87.9%) | 32 (12.1%) |
| Total (Overall) | 1,288 (46.9%) | 1,459 (53.1%) |
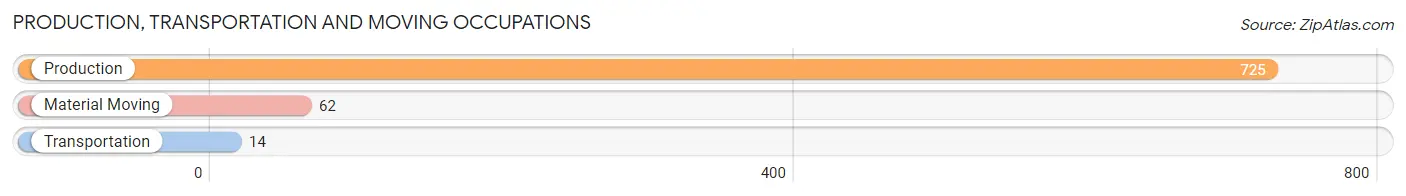
Production, Transportation and Moving Occupations
The most common Production, Transportation and Moving occupations in Rushville are Production (725 | 26.4%), Material Moving (62 | 2.3%), and Transportation (14 | 0.5%).
Production, Transportation and Moving Occupations by Sex
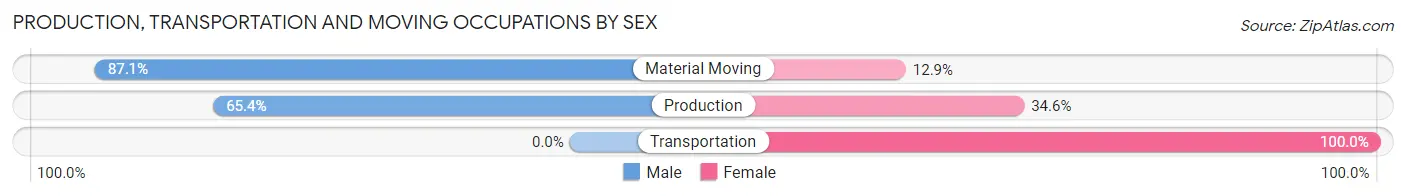
| Occupation | Male | Female |
| Production | 474 (65.4%) | 251 (34.6%) |
| Transportation | 0 (0.0%) | 14 (100.0%) |
| Material Moving | 54 (87.1%) | 8 (12.9%) |
| Total (Category) | 528 (65.9%) | 273 (34.1%) |
| Total (Overall) | 1,288 (46.9%) | 1,459 (53.1%) |
Employment Industries by Sex in Rushville
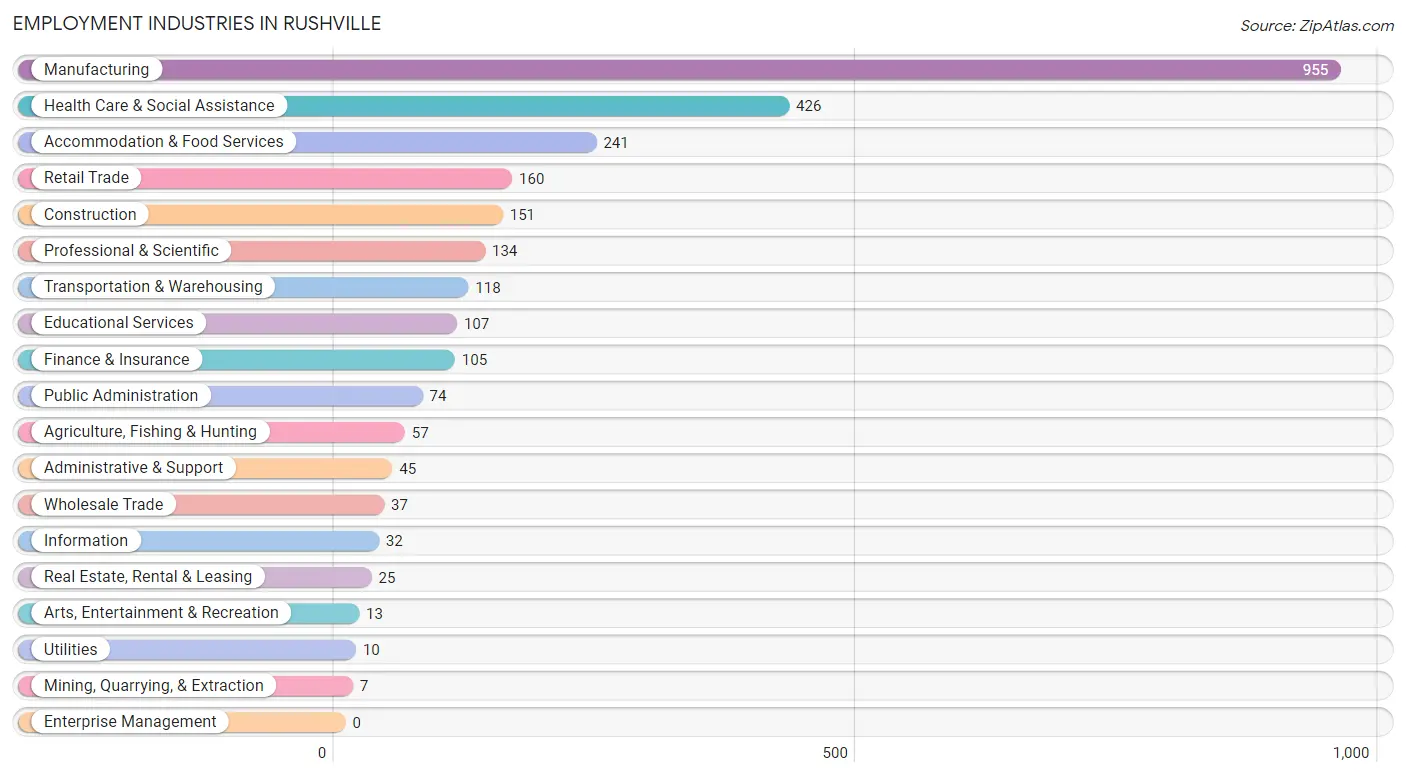
Employment Industries in Rushville
The major employment industries in Rushville include Manufacturing (955 | 34.8%), Health Care & Social Assistance (426 | 15.5%), Accommodation & Food Services (241 | 8.8%), Retail Trade (160 | 5.8%), and Construction (151 | 5.5%).
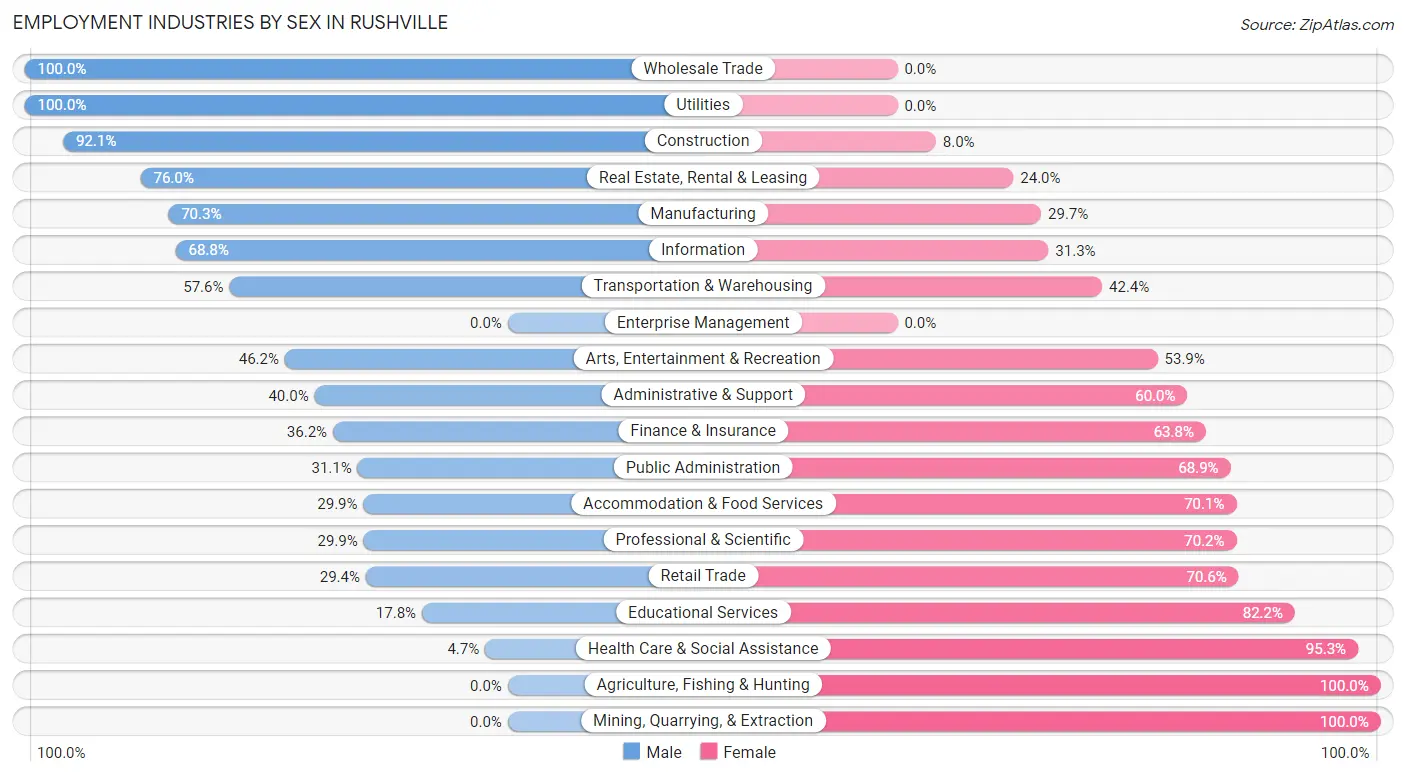
Employment Industries by Sex in Rushville
The Rushville industries that see more men than women are Wholesale Trade (100.0%), Utilities (100.0%), and Construction (92.0%), whereas the industries that tend to have a higher number of women are Agriculture, Fishing & Hunting (100.0%), Mining, Quarrying, & Extraction (100.0%), and Health Care & Social Assistance (95.3%).
| Industry | Male | Female |
| Agriculture, Fishing & Hunting | 0 (0.0%) | 57 (100.0%) |
| Mining, Quarrying, & Extraction | 0 (0.0%) | 7 (100.0%) |
| Construction | 139 (92.0%) | 12 (8.0%) |
| Manufacturing | 671 (70.3%) | 284 (29.7%) |
| Wholesale Trade | 37 (100.0%) | 0 (0.0%) |
| Retail Trade | 47 (29.4%) | 113 (70.6%) |
| Transportation & Warehousing | 68 (57.6%) | 50 (42.4%) |
| Utilities | 10 (100.0%) | 0 (0.0%) |
| Information | 22 (68.8%) | 10 (31.2%) |
| Finance & Insurance | 38 (36.2%) | 67 (63.8%) |
| Real Estate, Rental & Leasing | 19 (76.0%) | 6 (24.0%) |
| Professional & Scientific | 40 (29.8%) | 94 (70.2%) |
| Enterprise Management | 0 (0.0%) | 0 (0.0%) |
| Administrative & Support | 18 (40.0%) | 27 (60.0%) |
| Educational Services | 19 (17.8%) | 88 (82.2%) |
| Health Care & Social Assistance | 20 (4.7%) | 406 (95.3%) |
| Arts, Entertainment & Recreation | 6 (46.2%) | 7 (53.8%) |
| Accommodation & Food Services | 72 (29.9%) | 169 (70.1%) |
| Public Administration | 23 (31.1%) | 51 (68.9%) |
| Total | 1,288 (46.9%) | 1,459 (53.1%) |
Education in Rushville
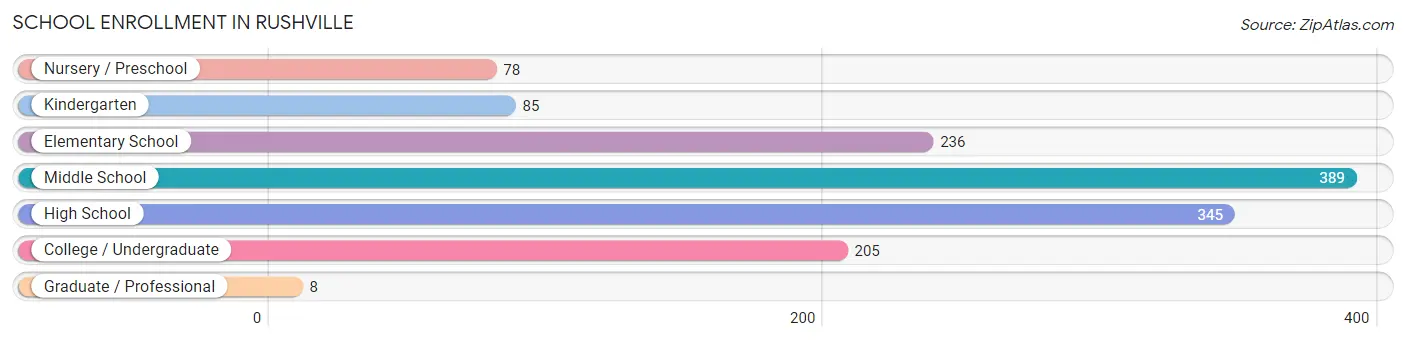
School Enrollment in Rushville
The most common levels of schooling among the 1,346 students in Rushville are middle school (389 | 28.9%), high school (345 | 25.6%), and elementary school (236 | 17.5%).
| School Level | # Students | % Students |
| Nursery / Preschool | 78 | 5.8% |
| Kindergarten | 85 | 6.3% |
| Elementary School | 236 | 17.5% |
| Middle School | 389 | 28.9% |
| High School | 345 | 25.6% |
| College / Undergraduate | 205 | 15.2% |
| Graduate / Professional | 8 | 0.6% |
| Total | 1,346 | 100.0% |
School Enrollment by Age by Funding Source in Rushville
Out of a total of 1,346 students who are enrolled in schools in Rushville, 117 (8.7%) attend a private institution, while the remaining 1,229 (91.3%) are enrolled in public schools. The age group of 3 to 4 year olds has the highest likelihood of being enrolled in private schools, with 65 (100.0% in the age bracket) enrolled. Conversely, the age group of 15 to 17 year olds has the lowest likelihood of being enrolled in a private school, with 308 (100.0% in the age bracket) attending a public institution.
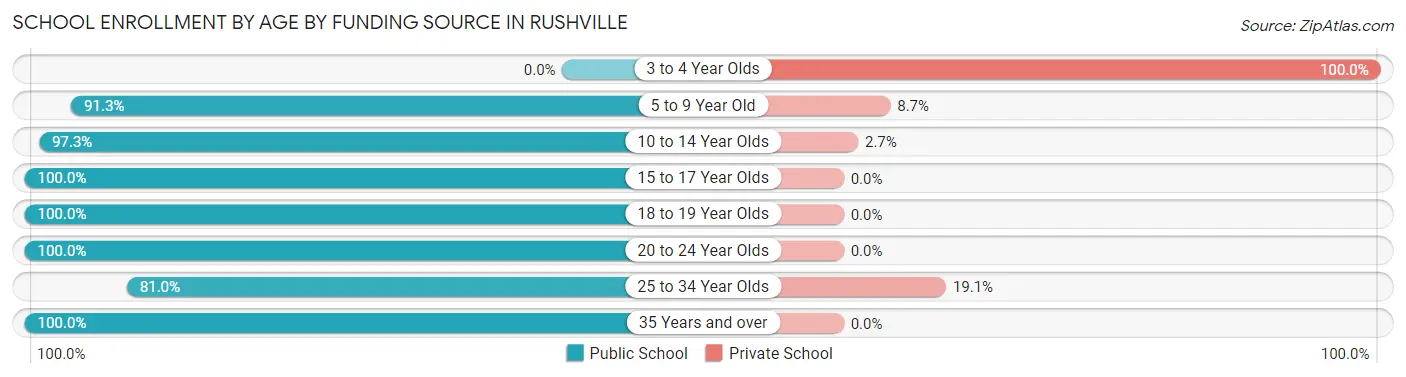
| Age Bracket | Public School | Private School |
| 3 to 4 Year Olds | 0 (0.0%) | 65 (100.0%) |
| 5 to 9 Year Old | 305 (91.3%) | 29 (8.7%) |
| 10 to 14 Year Olds | 400 (97.3%) | 11 (2.7%) |
| 15 to 17 Year Olds | 308 (100.0%) | 0 (0.0%) |
| 18 to 19 Year Olds | 26 (100.0%) | 0 (0.0%) |
| 20 to 24 Year Olds | 96 (100.0%) | 0 (0.0%) |
| 25 to 34 Year Olds | 51 (80.9%) | 12 (19.1%) |
| 35 Years and over | 43 (100.0%) | 0 (0.0%) |
| Total | 1,229 (91.3%) | 117 (8.7%) |
Educational Attainment by Field of Study in Rushville
Business (128 | 20.2%), education (100 | 15.8%), science & technology (79 | 12.5%), computers & mathematics (63 | 10.0%), and psychology (61 | 9.6%) are the most common fields of study among 633 individuals in Rushville who have obtained a bachelor's degree or higher.
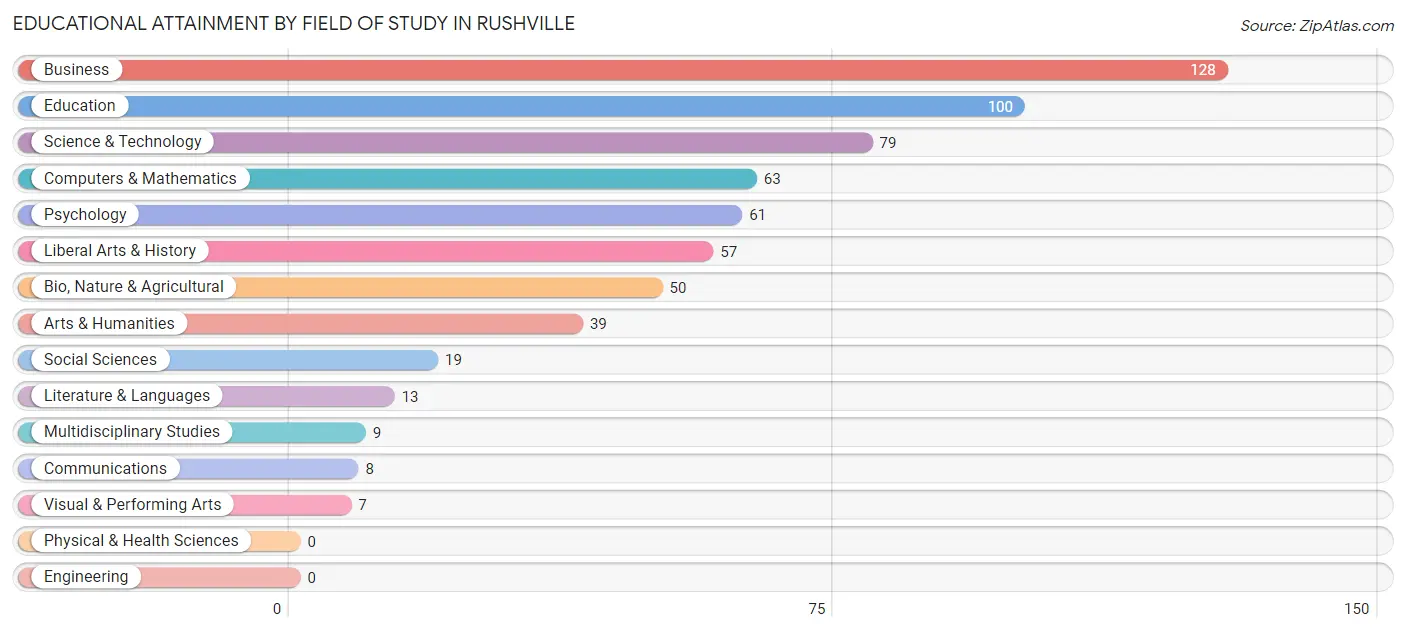
| Field of Study | # Graduates | % Graduates |
| Computers & Mathematics | 63 | 10.0% |
| Bio, Nature & Agricultural | 50 | 7.9% |
| Physical & Health Sciences | 0 | 0.0% |
| Psychology | 61 | 9.6% |
| Social Sciences | 19 | 3.0% |
| Engineering | 0 | 0.0% |
| Multidisciplinary Studies | 9 | 1.4% |
| Science & Technology | 79 | 12.5% |
| Business | 128 | 20.2% |
| Education | 100 | 15.8% |
| Literature & Languages | 13 | 2.1% |
| Liberal Arts & History | 57 | 9.0% |
| Visual & Performing Arts | 7 | 1.1% |
| Communications | 8 | 1.3% |
| Arts & Humanities | 39 | 6.2% |
| Total | 633 | 100.0% |
Transportation & Commute in Rushville
Vehicle Availability by Sex in Rushville
The most prevalent vehicle ownership categories in Rushville are males with 2 vehicles (636, accounting for 52.4%) and females with 2 vehicles (738, making up 46.5%).
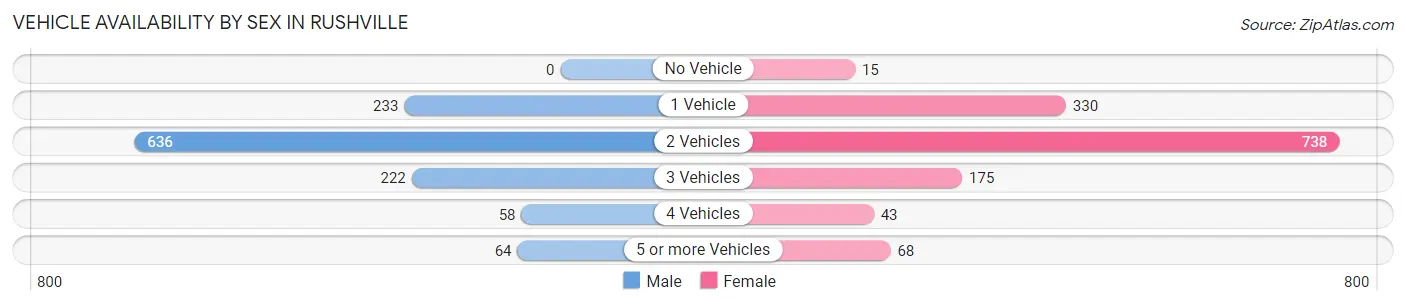
| Vehicles Available | Male | Female |
| No Vehicle | 0 (0.0%) | 15 (1.1%) |
| 1 Vehicle | 233 (19.2%) | 330 (24.1%) |
| 2 Vehicles | 636 (52.4%) | 738 (53.9%) |
| 3 Vehicles | 222 (18.3%) | 175 (12.8%) |
| 4 Vehicles | 58 (4.8%) | 43 (3.1%) |
| 5 or more Vehicles | 64 (5.3%) | 68 (5.0%) |
| Total | 1,213 (100.0%) | 1,369 (100.0%) |
Commute Time in Rushville
The most frequently occuring commute durations in Rushville are 5 to 9 minutes (545 commuters, 21.7%), 15 to 19 minutes (293 commuters, 11.7%), and 25 to 29 minutes (281 commuters, 11.2%).
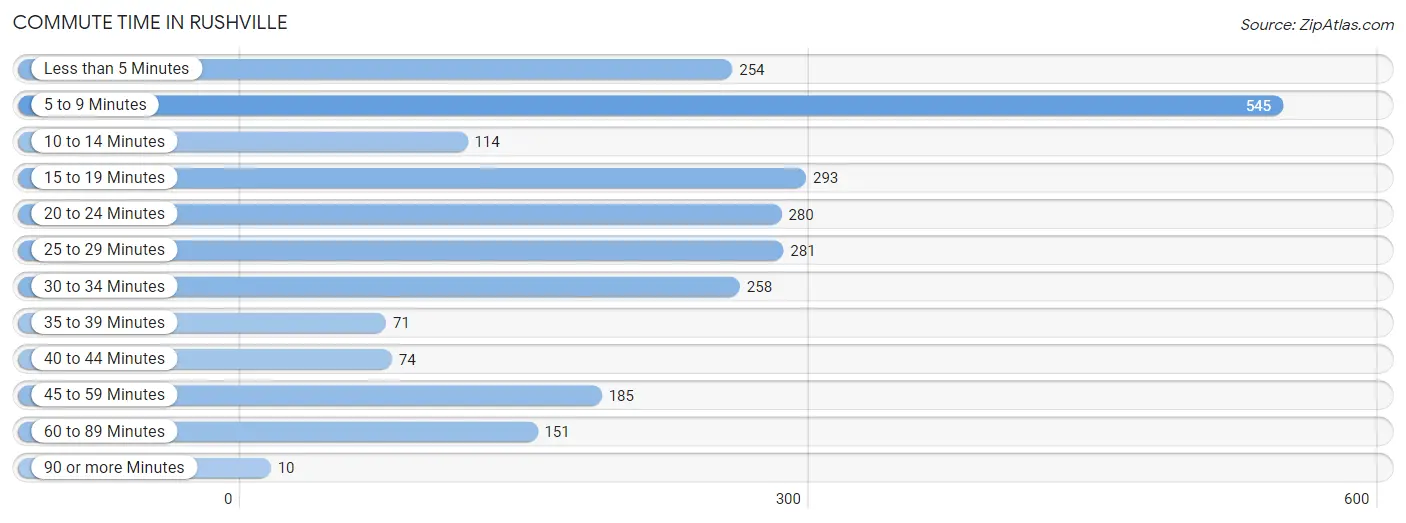
| Commute Time | # Commuters | % Commuters |
| Less than 5 Minutes | 254 | 10.1% |
| 5 to 9 Minutes | 545 | 21.7% |
| 10 to 14 Minutes | 114 | 4.5% |
| 15 to 19 Minutes | 293 | 11.7% |
| 20 to 24 Minutes | 280 | 11.1% |
| 25 to 29 Minutes | 281 | 11.2% |
| 30 to 34 Minutes | 258 | 10.2% |
| 35 to 39 Minutes | 71 | 2.8% |
| 40 to 44 Minutes | 74 | 2.9% |
| 45 to 59 Minutes | 185 | 7.3% |
| 60 to 89 Minutes | 151 | 6.0% |
| 90 or more Minutes | 10 | 0.4% |
Commute Time by Sex in Rushville
The most common commute times in Rushville are 15 to 19 minutes (199 commuters, 16.7%) for males and 5 to 9 minutes (433 commuters, 32.8%) for females.
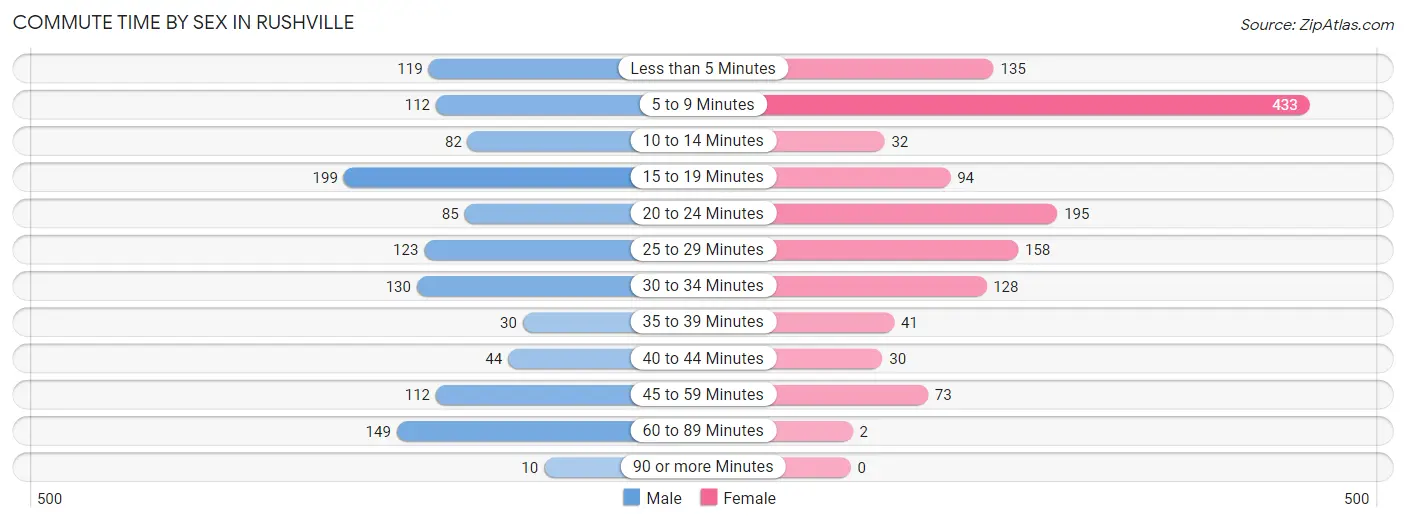
| Commute Time | Male | Female |
| Less than 5 Minutes | 119 (10.0%) | 135 (10.2%) |
| 5 to 9 Minutes | 112 (9.4%) | 433 (32.8%) |
| 10 to 14 Minutes | 82 (6.9%) | 32 (2.4%) |
| 15 to 19 Minutes | 199 (16.7%) | 94 (7.1%) |
| 20 to 24 Minutes | 85 (7.1%) | 195 (14.8%) |
| 25 to 29 Minutes | 123 (10.3%) | 158 (12.0%) |
| 30 to 34 Minutes | 130 (10.9%) | 128 (9.7%) |
| 35 to 39 Minutes | 30 (2.5%) | 41 (3.1%) |
| 40 to 44 Minutes | 44 (3.7%) | 30 (2.3%) |
| 45 to 59 Minutes | 112 (9.4%) | 73 (5.5%) |
| 60 to 89 Minutes | 149 (12.5%) | 2 (0.2%) |
| 90 or more Minutes | 10 (0.8%) | 0 (0.0%) |
Time of Departure to Work by Sex in Rushville
The most frequent times of departure to work in Rushville are 6:00 AM to 6:29 AM (143, 12.0%) for males and 7:30 AM to 7:59 AM (292, 22.1%) for females.
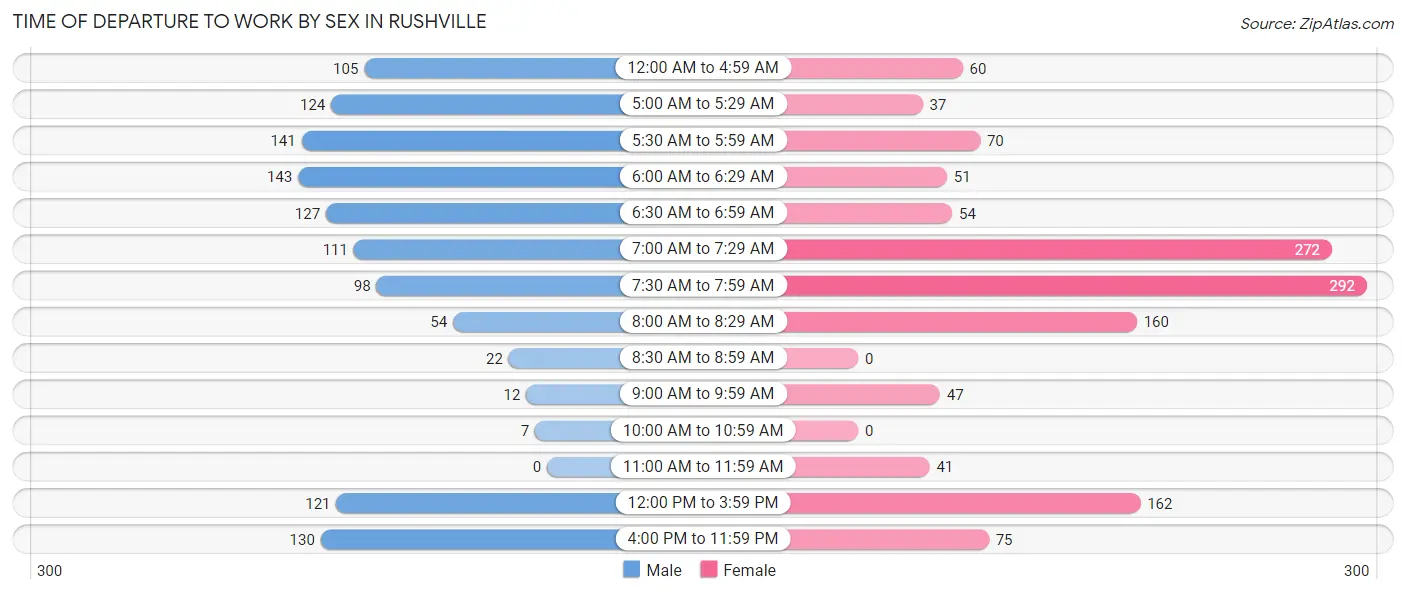
| Time of Departure | Male | Female |
| 12:00 AM to 4:59 AM | 105 (8.8%) | 60 (4.5%) |
| 5:00 AM to 5:29 AM | 124 (10.4%) | 37 (2.8%) |
| 5:30 AM to 5:59 AM | 141 (11.8%) | 70 (5.3%) |
| 6:00 AM to 6:29 AM | 143 (12.0%) | 51 (3.9%) |
| 6:30 AM to 6:59 AM | 127 (10.6%) | 54 (4.1%) |
| 7:00 AM to 7:29 AM | 111 (9.3%) | 272 (20.6%) |
| 7:30 AM to 7:59 AM | 98 (8.2%) | 292 (22.1%) |
| 8:00 AM to 8:29 AM | 54 (4.5%) | 160 (12.1%) |
| 8:30 AM to 8:59 AM | 22 (1.8%) | 0 (0.0%) |
| 9:00 AM to 9:59 AM | 12 (1.0%) | 47 (3.6%) |
| 10:00 AM to 10:59 AM | 7 (0.6%) | 0 (0.0%) |
| 11:00 AM to 11:59 AM | 0 (0.0%) | 41 (3.1%) |
| 12:00 PM to 3:59 PM | 121 (10.1%) | 162 (12.3%) |
| 4:00 PM to 11:59 PM | 130 (10.9%) | 75 (5.7%) |
| Total | 1,195 (100.0%) | 1,321 (100.0%) |
Housing Occupancy in Rushville
Occupancy by Ownership in Rushville
Of the total 2,524 dwellings in Rushville, owner-occupied units account for 1,360 (53.9%), while renter-occupied units make up 1,164 (46.1%).
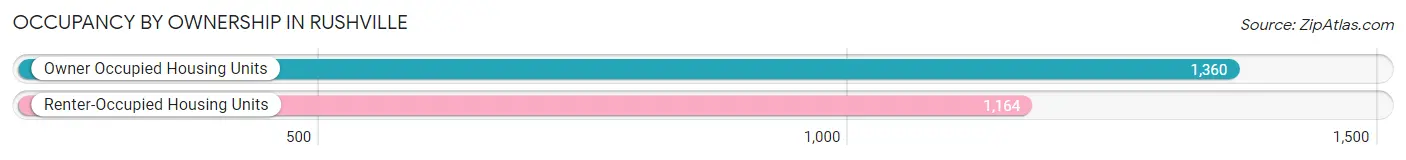
| Occupancy | # Housing Units | % Housing Units |
| Owner Occupied Housing Units | 1,360 | 53.9% |
| Renter-Occupied Housing Units | 1,164 | 46.1% |
| Total Occupied Housing Units | 2,524 | 100.0% |
Occupancy by Household Size in Rushville
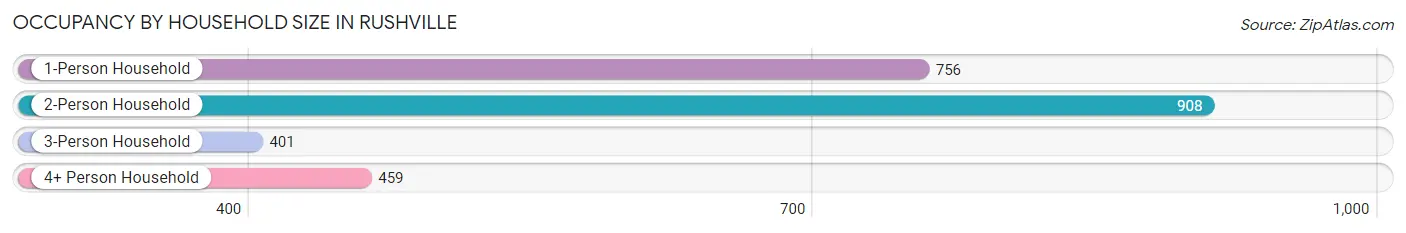
| Household Size | # Housing Units | % Housing Units |
| 1-Person Household | 756 | 29.9% |
| 2-Person Household | 908 | 36.0% |
| 3-Person Household | 401 | 15.9% |
| 4+ Person Household | 459 | 18.2% |
| Total Housing Units | 2,524 | 100.0% |
Occupancy by Ownership by Household Size in Rushville
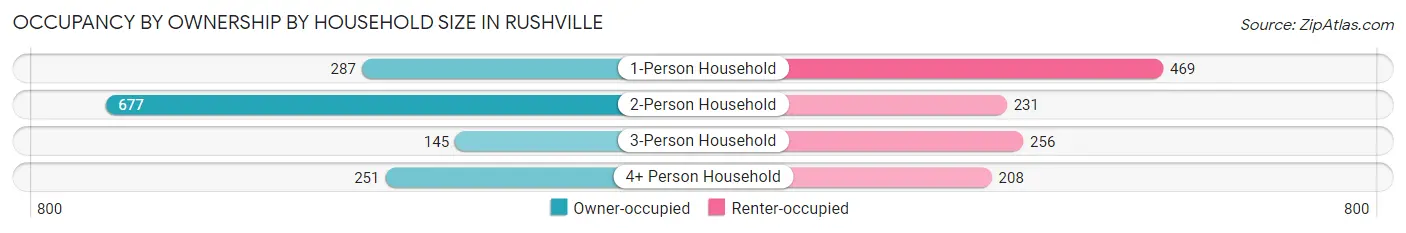
| Household Size | Owner-occupied | Renter-occupied |
| 1-Person Household | 287 (38.0%) | 469 (62.0%) |
| 2-Person Household | 677 (74.6%) | 231 (25.4%) |
| 3-Person Household | 145 (36.2%) | 256 (63.8%) |
| 4+ Person Household | 251 (54.7%) | 208 (45.3%) |
| Total Housing Units | 1,360 (53.9%) | 1,164 (46.1%) |
Occupancy by Educational Attainment in Rushville
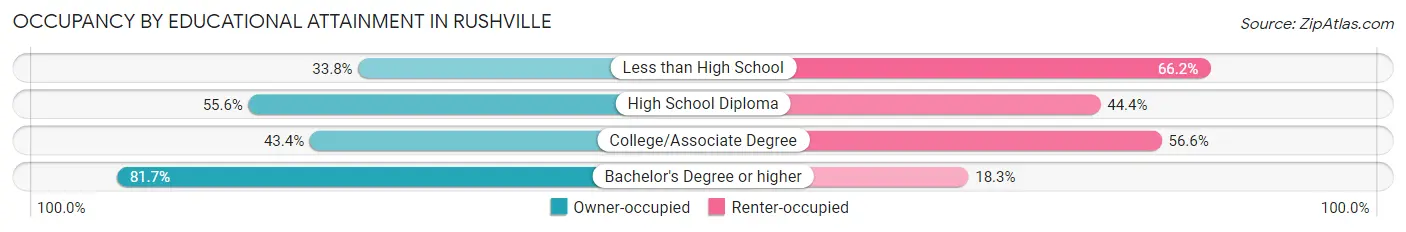
| Household Size | Owner-occupied | Renter-occupied |
| Less than High School | 93 (33.8%) | 182 (66.2%) |
| High School Diploma | 619 (55.6%) | 495 (44.4%) |
| College/Associate Degree | 317 (43.4%) | 413 (56.6%) |
| Bachelor's Degree or higher | 331 (81.7%) | 74 (18.3%) |
Occupancy by Age of Householder in Rushville
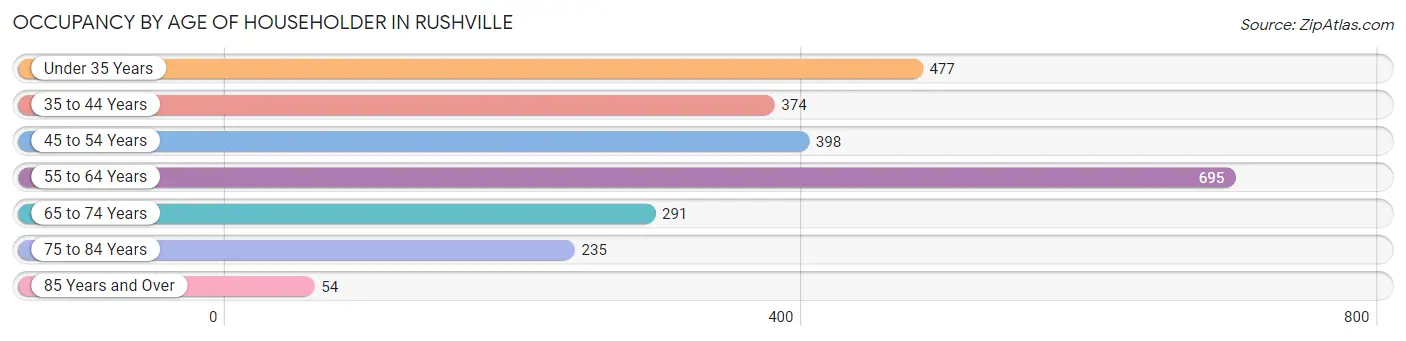
| Age Bracket | # Households | % Households |
| Under 35 Years | 477 | 18.9% |
| 35 to 44 Years | 374 | 14.8% |
| 45 to 54 Years | 398 | 15.8% |
| 55 to 64 Years | 695 | 27.5% |
| 65 to 74 Years | 291 | 11.5% |
| 75 to 84 Years | 235 | 9.3% |
| 85 Years and Over | 54 | 2.1% |
| Total | 2,524 | 100.0% |
Housing Finances in Rushville
Median Income by Occupancy in Rushville
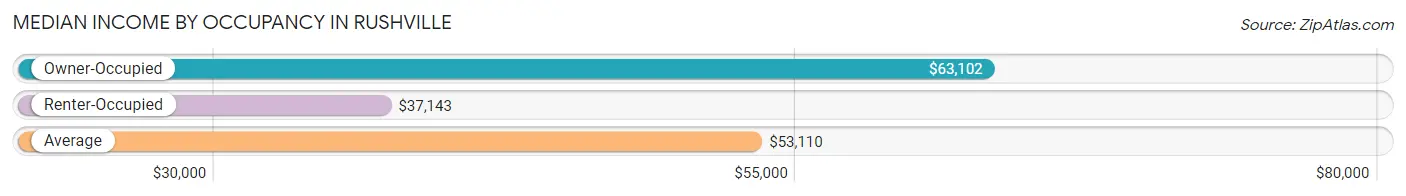
| Occupancy Type | # Households | Median Income |
| Owner-Occupied | 1,360 (53.9%) | $63,102 |
| Renter-Occupied | 1,164 (46.1%) | $37,143 |
| Average | 2,524 (100.0%) | $53,110 |
Occupancy by Householder Income Bracket in Rushville
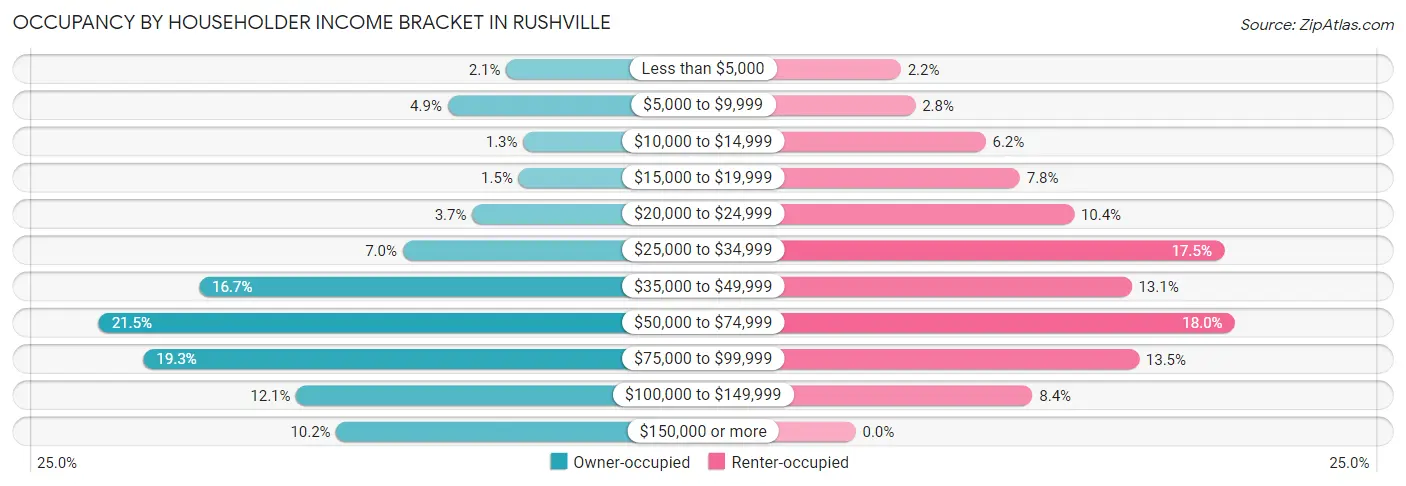
| Income Bracket | Owner-occupied | Renter-occupied |
| Less than $5,000 | 28 (2.1%) | 25 (2.1%) |
| $5,000 to $9,999 | 66 (4.9%) | 33 (2.8%) |
| $10,000 to $14,999 | 17 (1.3%) | 72 (6.2%) |
| $15,000 to $19,999 | 20 (1.5%) | 91 (7.8%) |
| $20,000 to $24,999 | 50 (3.7%) | 121 (10.4%) |
| $25,000 to $34,999 | 95 (7.0%) | 204 (17.5%) |
| $35,000 to $49,999 | 227 (16.7%) | 153 (13.1%) |
| $50,000 to $74,999 | 292 (21.5%) | 210 (18.0%) |
| $75,000 to $99,999 | 263 (19.3%) | 157 (13.5%) |
| $100,000 to $149,999 | 164 (12.1%) | 98 (8.4%) |
| $150,000 or more | 138 (10.2%) | 0 (0.0%) |
| Total | 1,360 (100.0%) | 1,164 (100.0%) |
Monthly Housing Cost Tiers in Rushville
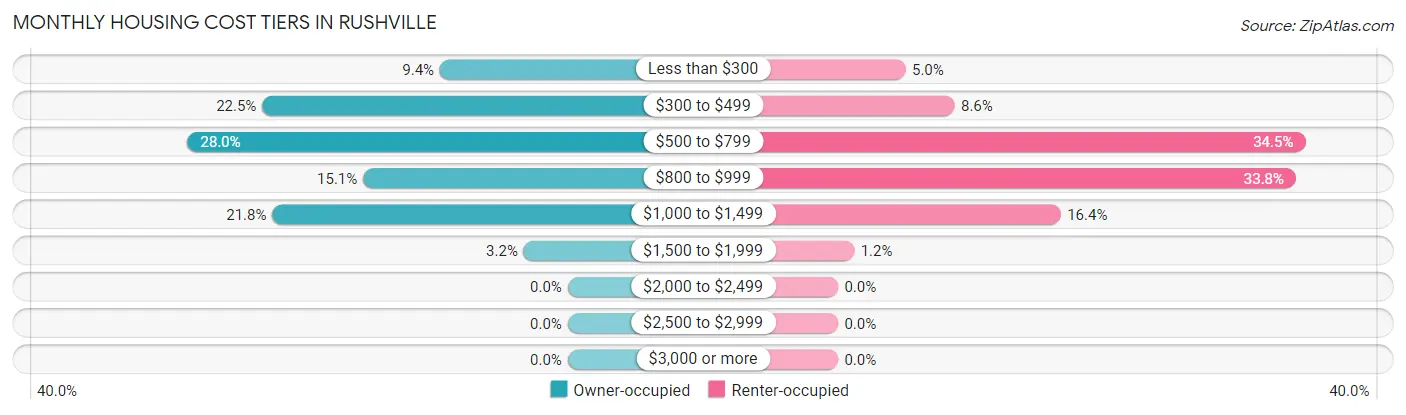
| Monthly Cost | Owner-occupied | Renter-occupied |
| Less than $300 | 128 (9.4%) | 58 (5.0%) |
| $300 to $499 | 306 (22.5%) | 100 (8.6%) |
| $500 to $799 | 381 (28.0%) | 401 (34.4%) |
| $800 to $999 | 205 (15.1%) | 393 (33.8%) |
| $1,000 to $1,499 | 296 (21.8%) | 191 (16.4%) |
| $1,500 to $1,999 | 44 (3.2%) | 14 (1.2%) |
| $2,000 to $2,499 | 0 (0.0%) | 0 (0.0%) |
| $2,500 to $2,999 | 0 (0.0%) | 0 (0.0%) |
| $3,000 or more | 0 (0.0%) | 0 (0.0%) |
| Total | 1,360 (100.0%) | 1,164 (100.0%) |
Physical Housing Characteristics in Rushville
Housing Structures in Rushville
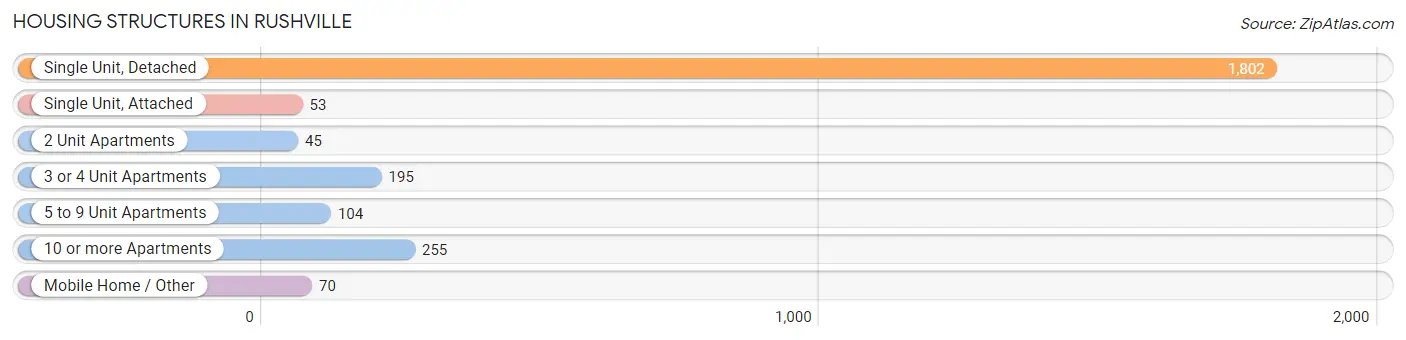
| Structure Type | # Housing Units | % Housing Units |
| Single Unit, Detached | 1,802 | 71.4% |
| Single Unit, Attached | 53 | 2.1% |
| 2 Unit Apartments | 45 | 1.8% |
| 3 or 4 Unit Apartments | 195 | 7.7% |
| 5 to 9 Unit Apartments | 104 | 4.1% |
| 10 or more Apartments | 255 | 10.1% |
| Mobile Home / Other | 70 | 2.8% |
| Total | 2,524 | 100.0% |
Housing Structures by Occupancy in Rushville
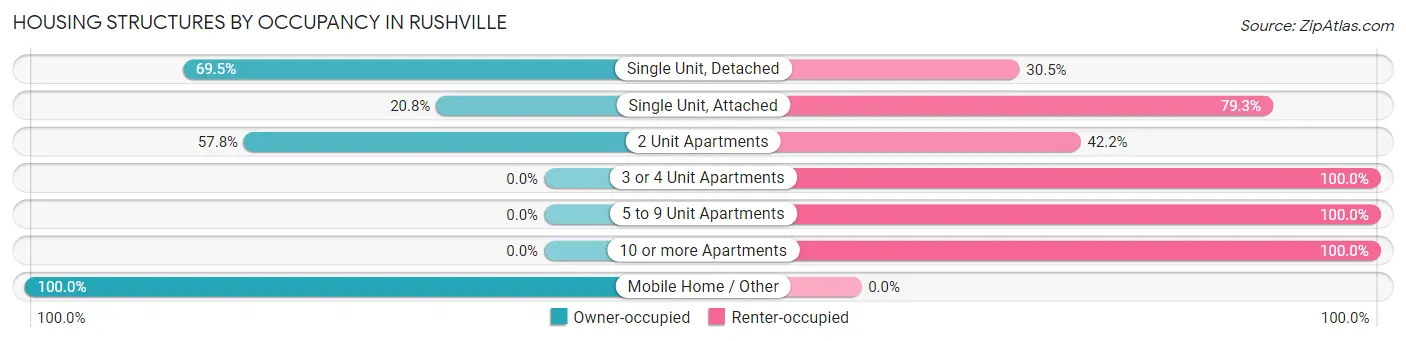
| Structure Type | Owner-occupied | Renter-occupied |
| Single Unit, Detached | 1,253 (69.5%) | 549 (30.5%) |
| Single Unit, Attached | 11 (20.7%) | 42 (79.2%) |
| 2 Unit Apartments | 26 (57.8%) | 19 (42.2%) |
| 3 or 4 Unit Apartments | 0 (0.0%) | 195 (100.0%) |
| 5 to 9 Unit Apartments | 0 (0.0%) | 104 (100.0%) |
| 10 or more Apartments | 0 (0.0%) | 255 (100.0%) |
| Mobile Home / Other | 70 (100.0%) | 0 (0.0%) |
| Total | 1,360 (53.9%) | 1,164 (46.1%) |
Housing Structures by Number of Rooms in Rushville
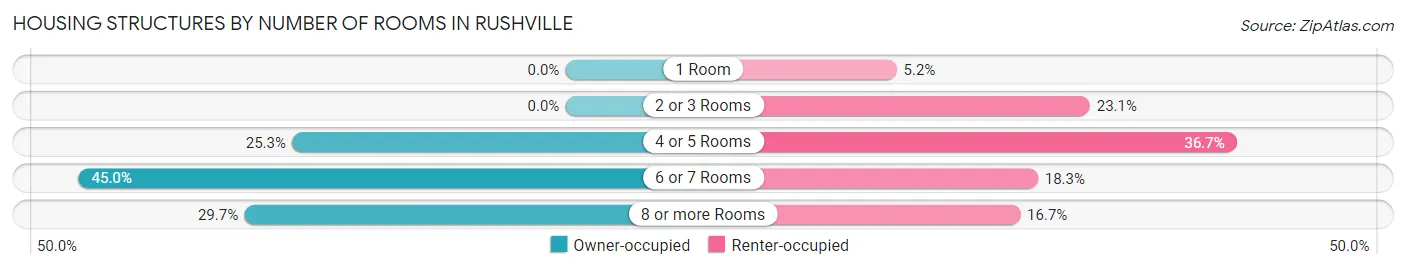
| Number of Rooms | Owner-occupied | Renter-occupied |
| 1 Room | 0 (0.0%) | 61 (5.2%) |
| 2 or 3 Rooms | 0 (0.0%) | 269 (23.1%) |
| 4 or 5 Rooms | 344 (25.3%) | 427 (36.7%) |
| 6 or 7 Rooms | 612 (45.0%) | 213 (18.3%) |
| 8 or more Rooms | 404 (29.7%) | 194 (16.7%) |
| Total | 1,360 (100.0%) | 1,164 (100.0%) |
Housing Structure by Heating Type in Rushville
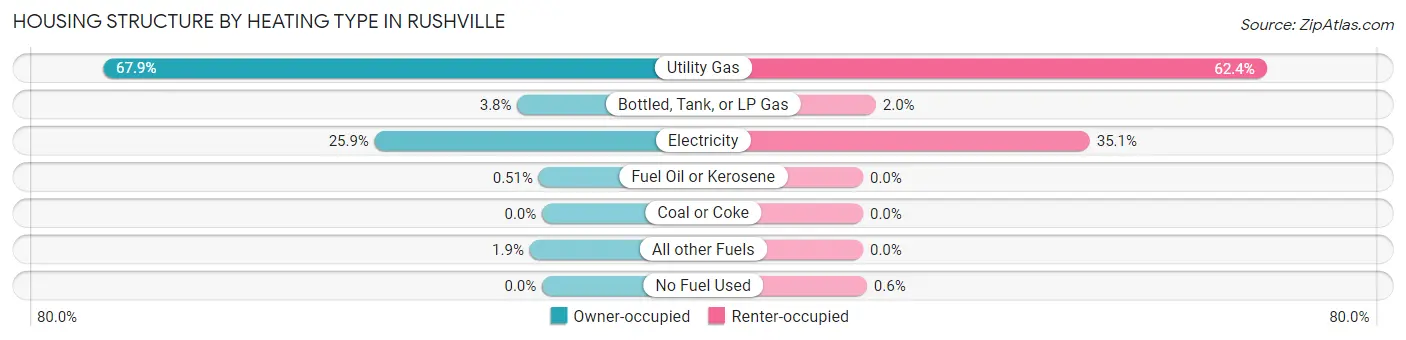
| Heating Type | Owner-occupied | Renter-occupied |
| Utility Gas | 923 (67.9%) | 726 (62.4%) |
| Bottled, Tank, or LP Gas | 52 (3.8%) | 23 (2.0%) |
| Electricity | 352 (25.9%) | 408 (35.0%) |
| Fuel Oil or Kerosene | 7 (0.5%) | 0 (0.0%) |
| Coal or Coke | 0 (0.0%) | 0 (0.0%) |
| All other Fuels | 26 (1.9%) | 0 (0.0%) |
| No Fuel Used | 0 (0.0%) | 7 (0.6%) |
| Total | 1,360 (100.0%) | 1,164 (100.0%) |
Household Vehicle Usage in Rushville
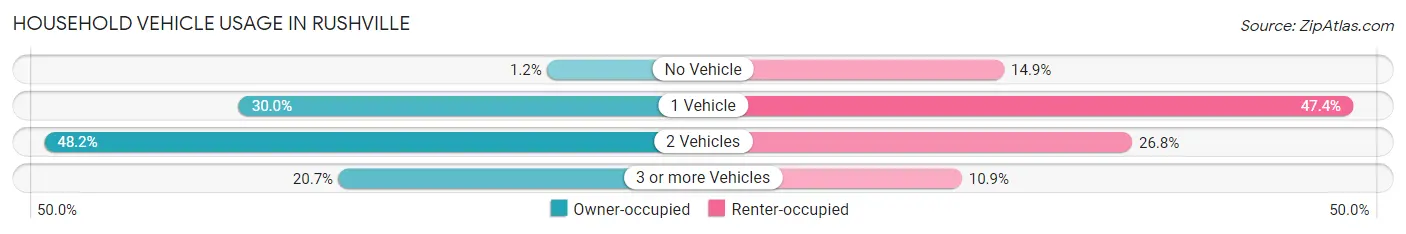
| Vehicles per Household | Owner-occupied | Renter-occupied |
| No Vehicle | 16 (1.2%) | 173 (14.9%) |
| 1 Vehicle | 408 (30.0%) | 552 (47.4%) |
| 2 Vehicles | 655 (48.2%) | 312 (26.8%) |
| 3 or more Vehicles | 281 (20.7%) | 127 (10.9%) |
| Total | 1,360 (100.0%) | 1,164 (100.0%) |
Real Estate & Mortgages in Rushville
Real Estate and Mortgage Overview in Rushville
| Characteristic | Without Mortgage | With Mortgage |
| Housing Units | 553 | 807 |
| Median Property Value | $89,400 | $113,000 |
| Median Household Income | $52,896 | $120 |
| Monthly Housing Costs | $419 | $0 |
| Real Estate Taxes | $729 | $61 |
Property Value by Mortgage Status in Rushville
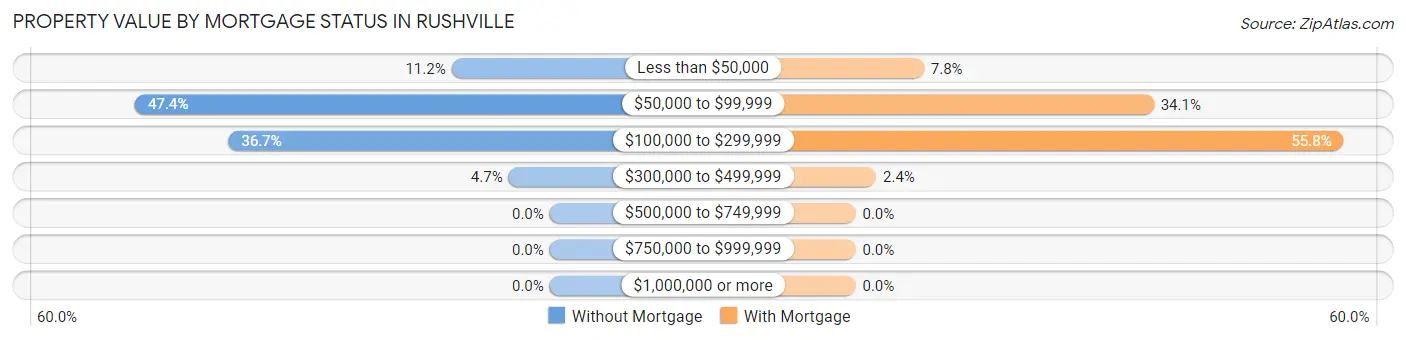
| Property Value | Without Mortgage | With Mortgage |
| Less than $50,000 | 62 (11.2%) | 63 (7.8%) |
| $50,000 to $99,999 | 262 (47.4%) | 275 (34.1%) |
| $100,000 to $299,999 | 203 (36.7%) | 450 (55.8%) |
| $300,000 to $499,999 | 26 (4.7%) | 19 (2.4%) |
| $500,000 to $749,999 | 0 (0.0%) | 0 (0.0%) |
| $750,000 to $999,999 | 0 (0.0%) | 0 (0.0%) |
| $1,000,000 or more | 0 (0.0%) | 0 (0.0%) |
| Total | 553 (100.0%) | 807 (100.0%) |
Household Income by Mortgage Status in Rushville
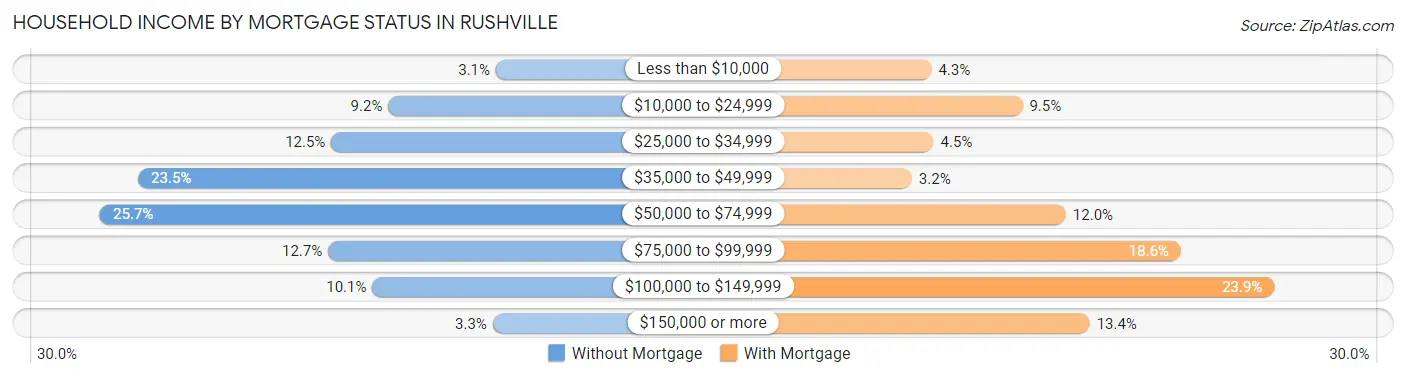
| Household Income | Without Mortgage | With Mortgage |
| Less than $10,000 | 17 (3.1%) | 35 (4.3%) |
| $10,000 to $24,999 | 51 (9.2%) | 77 (9.5%) |
| $25,000 to $34,999 | 69 (12.5%) | 36 (4.5%) |
| $35,000 to $49,999 | 130 (23.5%) | 26 (3.2%) |
| $50,000 to $74,999 | 142 (25.7%) | 97 (12.0%) |
| $75,000 to $99,999 | 70 (12.7%) | 150 (18.6%) |
| $100,000 to $149,999 | 56 (10.1%) | 193 (23.9%) |
| $150,000 or more | 18 (3.3%) | 108 (13.4%) |
| Total | 553 (100.0%) | 807 (100.0%) |
Property Value to Household Income Ratio in Rushville
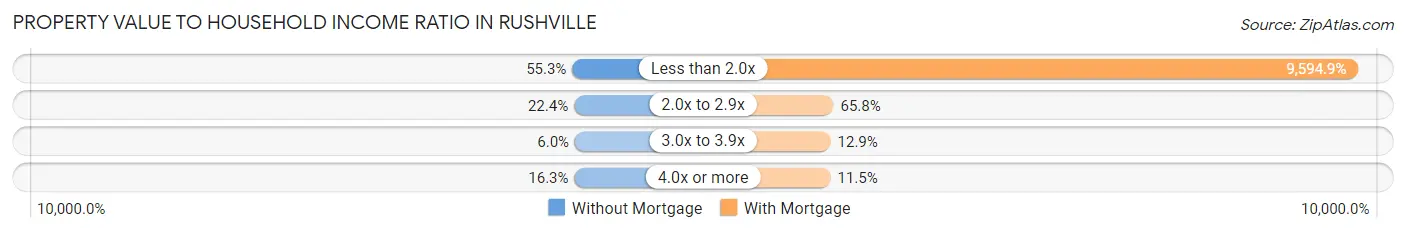
| Value-to-Income Ratio | Without Mortgage | With Mortgage |
| Less than 2.0x | 306 (55.3%) | 77,431 (9,594.9%) |
| 2.0x to 2.9x | 124 (22.4%) | 531 (65.8%) |
| 3.0x to 3.9x | 33 (6.0%) | 104 (12.9%) |
| 4.0x or more | 90 (16.3%) | 93 (11.5%) |
| Total | 553 (100.0%) | 807 (100.0%) |
Real Estate Taxes by Mortgage Status in Rushville
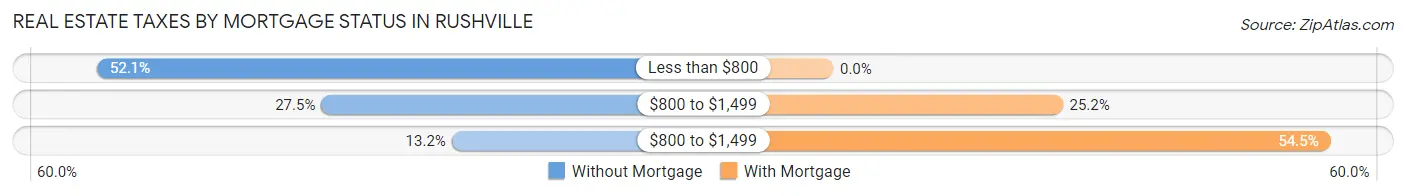
| Property Taxes | Without Mortgage | With Mortgage |
| Less than $800 | 288 (52.1%) | 0 (0.0%) |
| $800 to $1,499 | 152 (27.5%) | 203 (25.2%) |
| $800 to $1,499 | 73 (13.2%) | 440 (54.5%) |
| Total | 553 (100.0%) | 807 (100.0%) |
Health & Disability in Rushville
Health Insurance Coverage by Age in Rushville
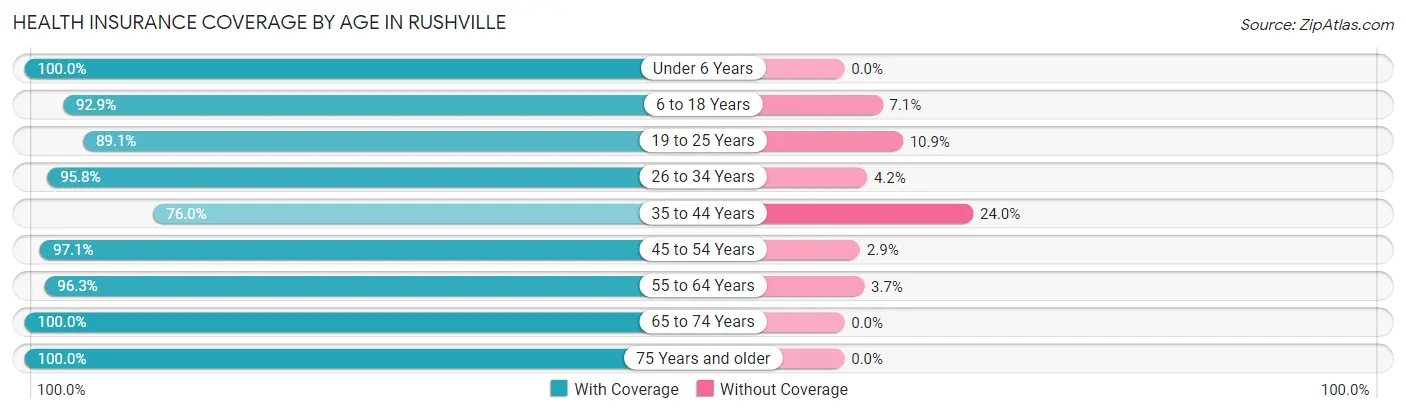
| Age Bracket | With Coverage | Without Coverage |
| Under 6 Years | 326 (100.0%) | 0 (0.0%) |
| 6 to 18 Years | 1,042 (92.9%) | 80 (7.1%) |
| 19 to 25 Years | 630 (89.1%) | 77 (10.9%) |
| 26 to 34 Years | 724 (95.8%) | 32 (4.2%) |
| 35 to 44 Years | 560 (76.0%) | 177 (24.0%) |
| 45 to 54 Years | 701 (97.1%) | 21 (2.9%) |
| 55 to 64 Years | 1,015 (96.3%) | 39 (3.7%) |
| 65 to 74 Years | 386 (100.0%) | 0 (0.0%) |
| 75 Years and older | 428 (100.0%) | 0 (0.0%) |
| Total | 5,812 (93.2%) | 426 (6.8%) |
Health Insurance Coverage by Citizenship Status in Rushville
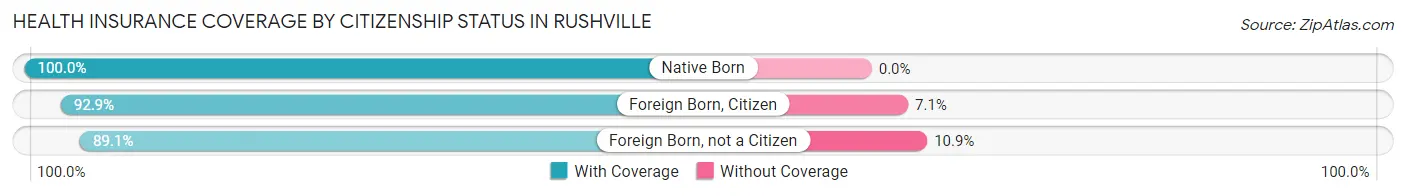
| Citizenship Status | With Coverage | Without Coverage |
| Native Born | 326 (100.0%) | 0 (0.0%) |
| Foreign Born, Citizen | 1,042 (92.9%) | 80 (7.1%) |
| Foreign Born, not a Citizen | 630 (89.1%) | 77 (10.9%) |
Health Insurance Coverage by Household Income in Rushville
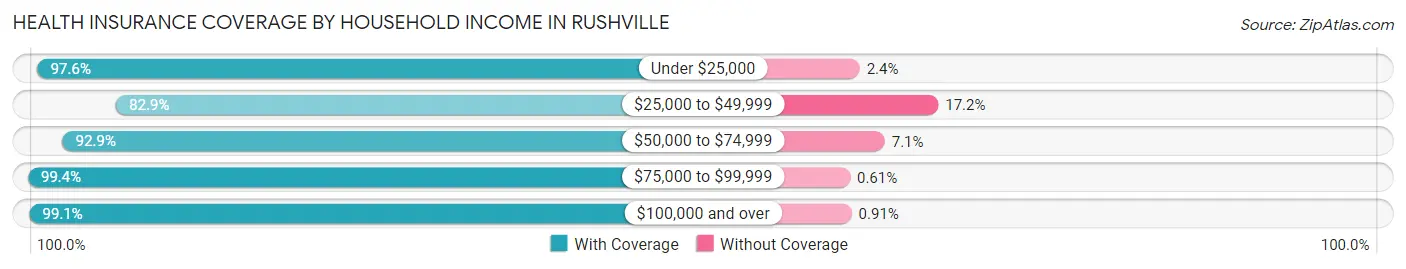
| Household Income | With Coverage | Without Coverage |
| Under $25,000 | 726 (97.6%) | 18 (2.4%) |
| $25,000 to $49,999 | 1,324 (82.9%) | 274 (17.2%) |
| $50,000 to $74,999 | 1,526 (92.9%) | 117 (7.1%) |
| $75,000 to $99,999 | 1,141 (99.4%) | 7 (0.6%) |
| $100,000 and over | 1,088 (99.1%) | 10 (0.9%) |
Public vs Private Health Insurance Coverage by Age in Rushville
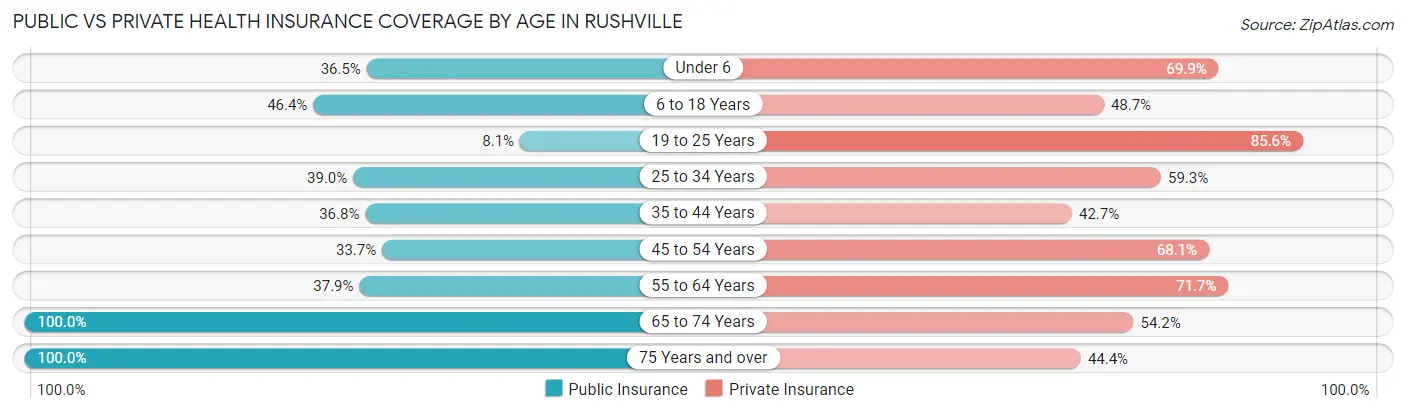
| Age Bracket | Public Insurance | Private Insurance |
| Under 6 | 119 (36.5%) | 228 (69.9%) |
| 6 to 18 Years | 521 (46.4%) | 546 (48.7%) |
| 19 to 25 Years | 57 (8.1%) | 605 (85.6%) |
| 25 to 34 Years | 295 (39.0%) | 448 (59.3%) |
| 35 to 44 Years | 271 (36.8%) | 315 (42.7%) |
| 45 to 54 Years | 243 (33.7%) | 492 (68.1%) |
| 55 to 64 Years | 399 (37.9%) | 756 (71.7%) |
| 65 to 74 Years | 386 (100.0%) | 209 (54.1%) |
| 75 Years and over | 428 (100.0%) | 190 (44.4%) |
| Total | 2,719 (43.6%) | 3,789 (60.7%) |
Disability Status by Sex by Age in Rushville
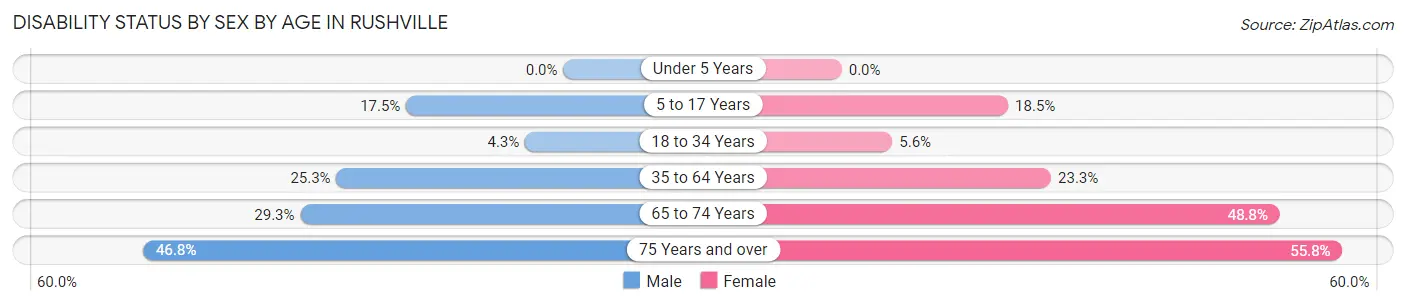
| Age Bracket | Male | Female |
| Under 5 Years | 0 (0.0%) | 0 (0.0%) |
| 5 to 17 Years | 95 (17.5%) | 98 (18.5%) |
| 18 to 34 Years | 32 (4.3%) | 44 (5.6%) |
| 35 to 64 Years | 324 (25.3%) | 287 (23.3%) |
| 65 to 74 Years | 41 (29.3%) | 120 (48.8%) |
| 75 Years and over | 66 (46.8%) | 160 (55.7%) |
Disability Class by Sex by Age in Rushville
Disability Class: Hearing Difficulty
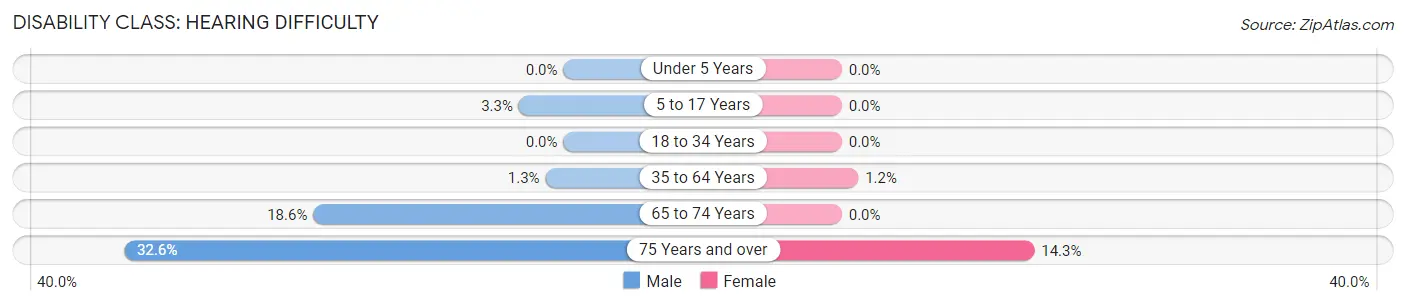
| Age Bracket | Male | Female |
| Under 5 Years | 0 (0.0%) | 0 (0.0%) |
| 5 to 17 Years | 18 (3.3%) | 0 (0.0%) |
| 18 to 34 Years | 0 (0.0%) | 0 (0.0%) |
| 35 to 64 Years | 17 (1.3%) | 15 (1.2%) |
| 65 to 74 Years | 26 (18.6%) | 0 (0.0%) |
| 75 Years and over | 46 (32.6%) | 41 (14.3%) |
Disability Class: Vision Difficulty
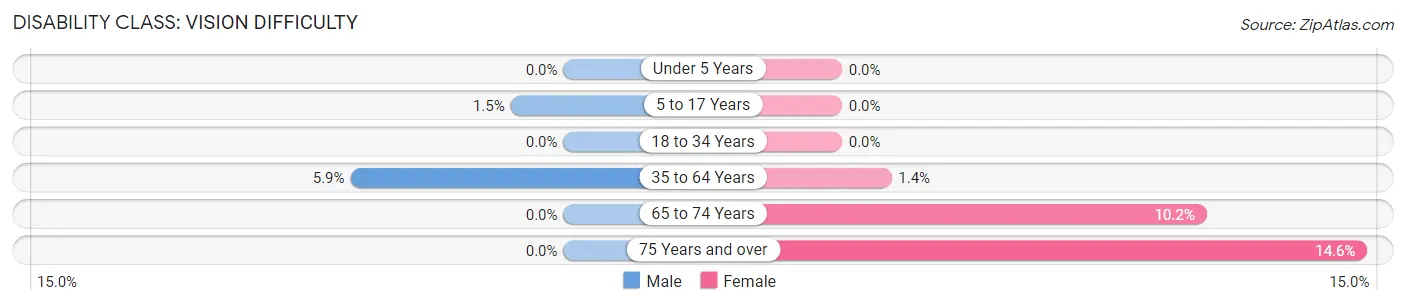
| Age Bracket | Male | Female |
| Under 5 Years | 0 (0.0%) | 0 (0.0%) |
| 5 to 17 Years | 8 (1.5%) | 0 (0.0%) |
| 18 to 34 Years | 0 (0.0%) | 0 (0.0%) |
| 35 to 64 Years | 76 (5.9%) | 17 (1.4%) |
| 65 to 74 Years | 0 (0.0%) | 25 (10.2%) |
| 75 Years and over | 0 (0.0%) | 42 (14.6%) |
Disability Class: Cognitive Difficulty
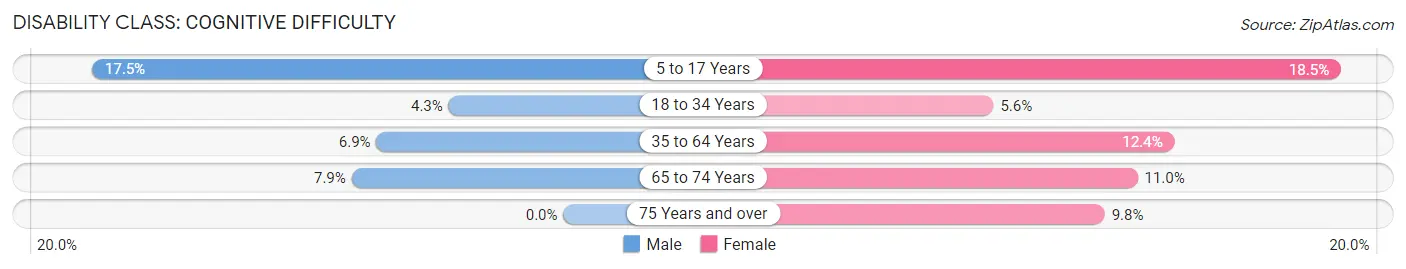
| Age Bracket | Male | Female |
| 5 to 17 Years | 95 (17.5%) | 98 (18.5%) |
| 18 to 34 Years | 32 (4.3%) | 44 (5.6%) |
| 35 to 64 Years | 89 (6.9%) | 152 (12.3%) |
| 65 to 74 Years | 11 (7.9%) | 27 (11.0%) |
| 75 Years and over | 0 (0.0%) | 28 (9.8%) |
Disability Class: Ambulatory Difficulty

| Age Bracket | Male | Female |
| 5 to 17 Years | 0 (0.0%) | 28 (5.3%) |
| 18 to 34 Years | 0 (0.0%) | 0 (0.0%) |
| 35 to 64 Years | 191 (14.9%) | 238 (19.3%) |
| 65 to 74 Years | 14 (10.0%) | 85 (34.5%) |
| 75 Years and over | 30 (21.3%) | 86 (30.0%) |
Disability Class: Self-Care Difficulty
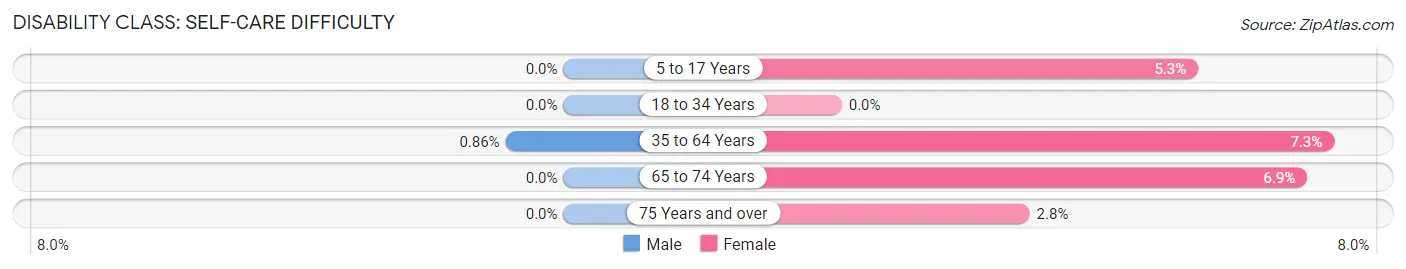
| Age Bracket | Male | Female |
| 5 to 17 Years | 0 (0.0%) | 28 (5.3%) |
| 18 to 34 Years | 0 (0.0%) | 0 (0.0%) |
| 35 to 64 Years | 11 (0.9%) | 90 (7.3%) |
| 65 to 74 Years | 0 (0.0%) | 17 (6.9%) |
| 75 Years and over | 0 (0.0%) | 8 (2.8%) |
Technology Access in Rushville
Computing Device Access in Rushville
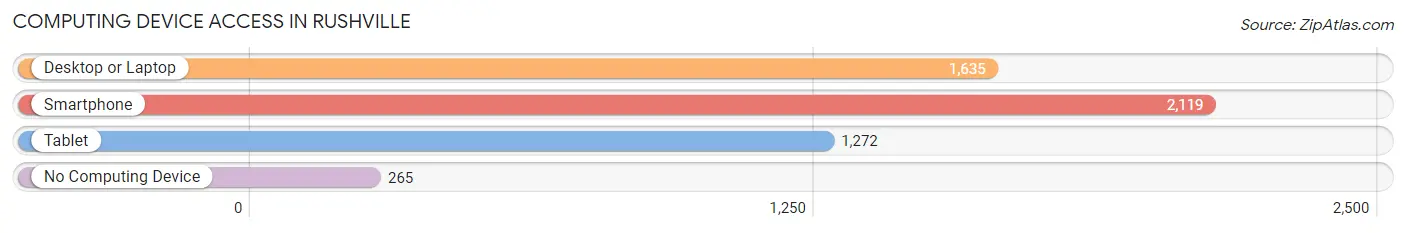
| Device Type | # Households | % Households |
| Desktop or Laptop | 1,635 | 64.8% |
| Smartphone | 2,119 | 84.0% |
| Tablet | 1,272 | 50.4% |
| No Computing Device | 265 | 10.5% |
| Total | 2,524 | 100.0% |
Internet Access in Rushville
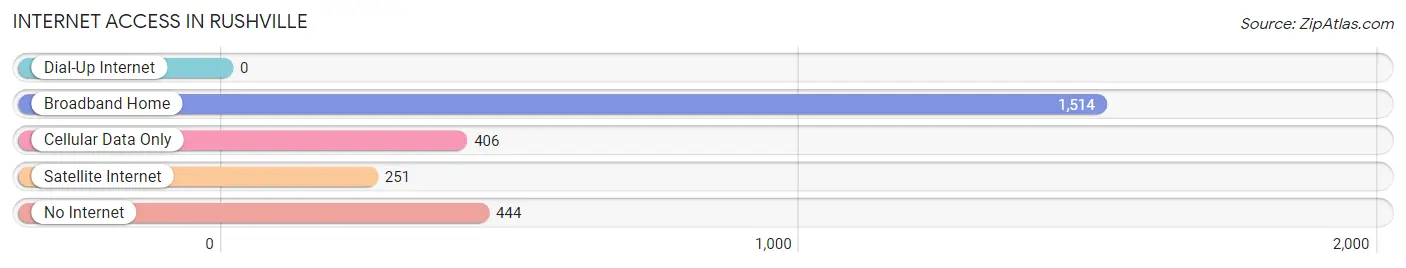
| Internet Type | # Households | % Households |
| Dial-Up Internet | 0 | 0.0% |
| Broadband Home | 1,514 | 60.0% |
| Cellular Data Only | 406 | 16.1% |
| Satellite Internet | 251 | 9.9% |
| No Internet | 444 | 17.6% |
| Total | 2,524 | 100.0% |
Rushville Summary
History
The town of Rushville, Indiana is located in the heart of Rush County, about 40 miles southeast of Indianapolis. The town was founded in 1822 by William N. Rush, a Revolutionary War veteran, and was named after him. The town was originally a small farming community, but it quickly grew into a bustling town with a variety of businesses and industries.
The first industry to come to Rushville was a woolen mill, which was established in 1825. This mill was the first of its kind in the state of Indiana and it helped to spur the growth of the town. The woolen mill was followed by a variety of other businesses, including a sawmill, a gristmill, a tannery, a distillery, and a variety of other small businesses.
In the late 1800s, the town of Rushville experienced a period of rapid growth. This growth was due in part to the construction of the Indianapolis, Cincinnati & Lafayette Railroad, which connected Rushville to Indianapolis and other major cities. This railroad allowed for the transportation of goods and people, which helped to spur the growth of the town.
In the early 1900s, Rushville experienced a period of decline. This decline was due in part to the Great Depression, which caused many businesses to close their doors. However, the town was able to recover and by the 1950s, it had become a thriving community once again.
Today, Rushville is a small town with a population of around 6,000 people. The town is home to a variety of businesses, including a hospital, a library, a movie theater, and a variety of restaurants and shops. The town is also home to a variety of historic sites, including the Rush County Courthouse, the Rushville Opera House, and the Rushville State Bank.
Geography
Rushville is located in the central part of Rush County, Indiana. The town is situated on the banks of the Big Blue River, which flows through the town. The town is surrounded by rolling hills and farmland, and is located about 40 miles southeast of Indianapolis.
The town of Rushville has a total area of 2.3 square miles, all of which is land. The town has a humid continental climate, with hot summers and cold winters. The average temperature in the summer is around 75 degrees Fahrenheit, while the average temperature in the winter is around 30 degrees Fahrenheit.
Economy
The economy of Rushville is largely based on agriculture and manufacturing. The town is home to a variety of agricultural businesses, including dairy farms, grain farms, and livestock farms. The town is also home to a variety of manufacturing businesses, including a furniture factory, a plastics factory, and a metal fabrication plant.
The town is also home to a variety of retail businesses, including a variety of restaurants, shops, and other businesses. The town is also home to a variety of service businesses, including a hospital, a library, and a movie theater.
Demographics
As of the 2010 census, the town of Rushville had a population of 6,341 people. The racial makeup of the town was 95.3% White, 1.2% African American, 0.3% Native American, 0.4% Asian, 0.1% Pacific Islander, 1.2% from other races, and 1.5% from two or more races. Hispanic or Latino of any race were 3.2% of the population.
The median household income in Rushville was $37,917, and the median family income was $45,938. The per capita income for the town was $19,945. About 11.2% of families and 14.2% of the population were below the poverty line, including 19.2% of those under age 18 and 8.2% of those age 65 or over.
Common Questions
What is Per Capita Income in Rushville?
Per Capita income in Rushville is $25,715.
What is the Median Family Income in Rushville?
Median Family Income in Rushville is $61,607.
What is the Median Household income in Rushville?
Median Household Income in Rushville is $53,110.
What is Income or Wage Gap in Rushville?
Income or Wage Gap in Rushville is 17.4%.
Women in Rushville earn 82.6 cents for every dollar earned by a man.
What is Inequality or Gini Index in Rushville?
Inequality or Gini Index in Rushville is 0.39.
What is the Total Population of Rushville?
Total Population of Rushville is 6,412.
What is the Total Male Population of Rushville?
Total Male Population of Rushville is 3,114.
What is the Total Female Population of Rushville?
Total Female Population of Rushville is 3,298.
What is the Ratio of Males per 100 Females in Rushville?
There are 94.42 Males per 100 Females in Rushville.
What is the Ratio of Females per 100 Males in Rushville?
There are 105.91 Females per 100 Males in Rushville.
What is the Median Population Age in Rushville?
Median Population Age in Rushville is 40.3 Years.
What is the Average Family Size in Rushville
Average Family Size in Rushville is 3.1 People.
What is the Average Household Size in Rushville
Average Household Size in Rushville is 2.5 People.
How Large is the Labor Force in Rushville?
There are 3,040 People in the Labor Forcein in Rushville.
What is the Percentage of People in the Labor Force in Rushville?
57.9% of People are in the Labor Force in Rushville.
What is the Unemployment Rate in Rushville?
Unemployment Rate in Rushville is 9.6%.