Rensselaer, IN Map & Demographics
Rensselaer Map
Rensselaer Overview
$28,888
PER CAPITA INCOME
$79,070
AVG FAMILY INCOME
$58,659
AVG HOUSEHOLD INCOME
40.3%
WAGE / INCOME GAP [ % ]
59.7¢/ $1
WAGE / INCOME GAP [ $ ]
0.36
INEQUALITY / GINI INDEX
5,330
TOTAL POPULATION
2,554
MALE POPULATION
2,776
FEMALE POPULATION
92.00
MALES / 100 FEMALES
108.69
FEMALES / 100 MALES
37.3
MEDIAN AGE
3.3
AVG FAMILY SIZE
2.4
AVG HOUSEHOLD SIZE
2,791
LABOR FORCE [ PEOPLE ]
65.4%
PERCENT IN LABOR FORCE
2.7%
UNEMPLOYMENT RATE
Rensselaer Zip Codes
Rensselaer Area Codes
Income in Rensselaer
Income Overview in Rensselaer
Per Capita Income in Rensselaer is $28,888, while median incomes of families and households are $79,070 and $58,659 respectively.
| Characteristic | Number | Measure |
| Per Capita Income | 5,330 | $28,888 |
| Median Family Income | 1,086 | $79,070 |
| Mean Family Income | 1,086 | $81,450 |
| Median Household Income | 2,162 | $58,659 |
| Mean Household Income | 2,162 | $68,492 |
| Income Deficit | 1,086 | $0 |
| Wage / Income Gap (%) | 5,330 | 40.29% |
| Wage / Income Gap ($) | 5,330 | 59.71¢ per $1 |
| Gini / Inequality Index | 5,330 | 0.36 |
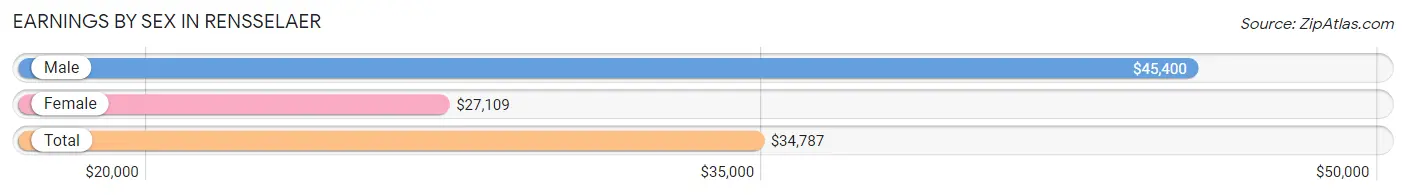
Earnings by Sex in Rensselaer
Average Earnings in Rensselaer are $34,787, $45,400 for men and $27,109 for women, a difference of 40.3%.
| Sex | Number | Average Earnings |
| Male | 1,446 (49.8%) | $45,400 |
| Female | 1,455 (50.2%) | $27,109 |
| Total | 2,901 (100.0%) | $34,787 |
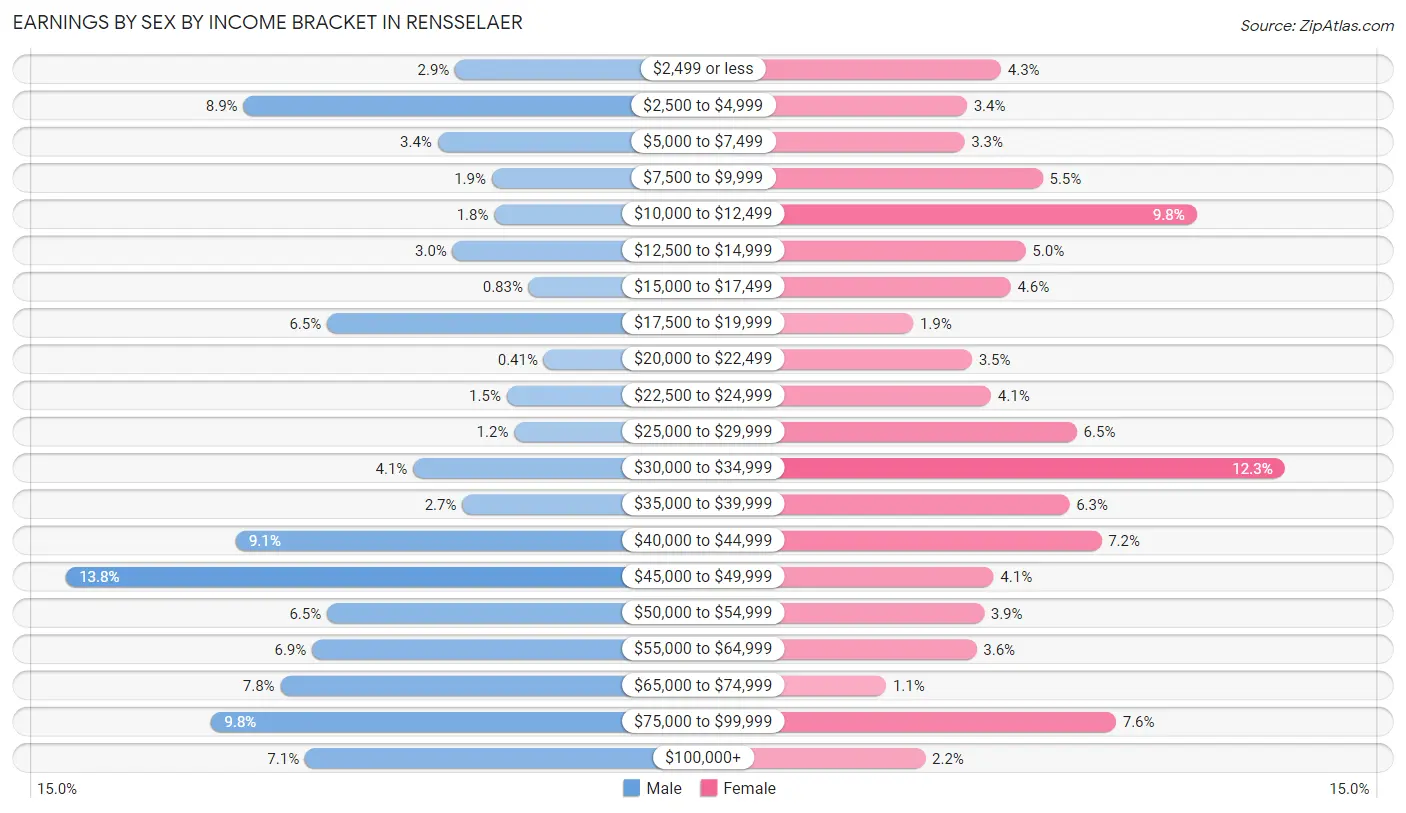
Earnings by Sex by Income Bracket in Rensselaer
The most common earnings brackets in Rensselaer are $45,000 to $49,999 for men (200 | 13.8%) and $30,000 to $34,999 for women (179 | 12.3%).
| Income | Male | Female |
| $2,499 or less | 42 (2.9%) | 63 (4.3%) |
| $2,500 to $4,999 | 128 (8.8%) | 49 (3.4%) |
| $5,000 to $7,499 | 49 (3.4%) | 48 (3.3%) |
| $7,500 to $9,999 | 27 (1.9%) | 80 (5.5%) |
| $10,000 to $12,499 | 26 (1.8%) | 143 (9.8%) |
| $12,500 to $14,999 | 43 (3.0%) | 73 (5.0%) |
| $15,000 to $17,499 | 12 (0.8%) | 67 (4.6%) |
| $17,500 to $19,999 | 94 (6.5%) | 27 (1.9%) |
| $20,000 to $22,499 | 6 (0.4%) | 51 (3.5%) |
| $22,500 to $24,999 | 21 (1.5%) | 59 (4.1%) |
| $25,000 to $29,999 | 18 (1.2%) | 94 (6.5%) |
| $30,000 to $34,999 | 59 (4.1%) | 179 (12.3%) |
| $35,000 to $39,999 | 39 (2.7%) | 91 (6.2%) |
| $40,000 to $44,999 | 131 (9.1%) | 104 (7.1%) |
| $45,000 to $49,999 | 200 (13.8%) | 60 (4.1%) |
| $50,000 to $54,999 | 94 (6.5%) | 56 (3.8%) |
| $55,000 to $64,999 | 100 (6.9%) | 53 (3.6%) |
| $65,000 to $74,999 | 113 (7.8%) | 16 (1.1%) |
| $75,000 to $99,999 | 141 (9.8%) | 110 (7.6%) |
| $100,000+ | 103 (7.1%) | 32 (2.2%) |
| Total | 1,446 (100.0%) | 1,455 (100.0%) |
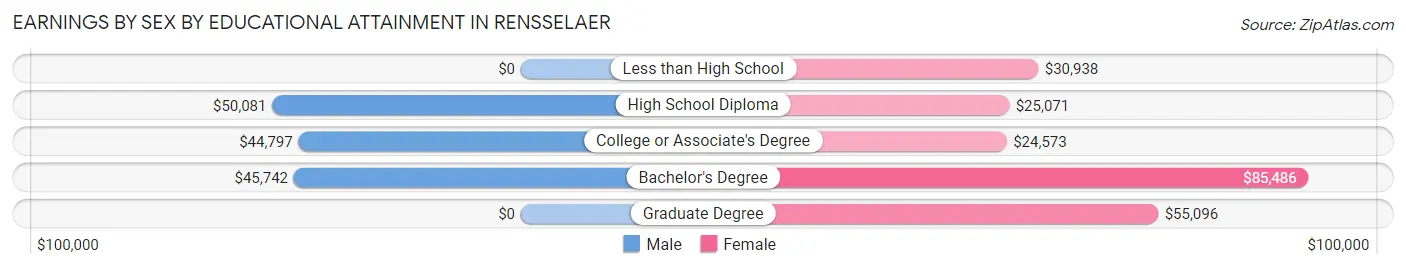
Earnings by Sex by Educational Attainment in Rensselaer
Average earnings in Rensselaer are $46,586 for men and $31,003 for women, a difference of 33.5%. Men with an educational attainment of high school diploma enjoy the highest average annual earnings of $50,081, while those with college or associate's degree education earn the least with $44,797. Women with an educational attainment of bachelor's degree earn the most with the average annual earnings of $85,486, while those with college or associate's degree education have the smallest earnings of $24,573.
| Educational Attainment | Male Income | Female Income |
| Less than High School | - | - |
| High School Diploma | $50,081 | $25,071 |
| College or Associate's Degree | $44,797 | $24,573 |
| Bachelor's Degree | $45,742 | $85,486 |
| Graduate Degree | - | - |
| Total | $46,586 | $31,003 |
Family Income in Rensselaer
Family Income Brackets in Rensselaer
According to the Rensselaer family income data, there are 279 families falling into the $75,000 to $99,999 income range, which is the most common income bracket and makes up 25.7% of all families.
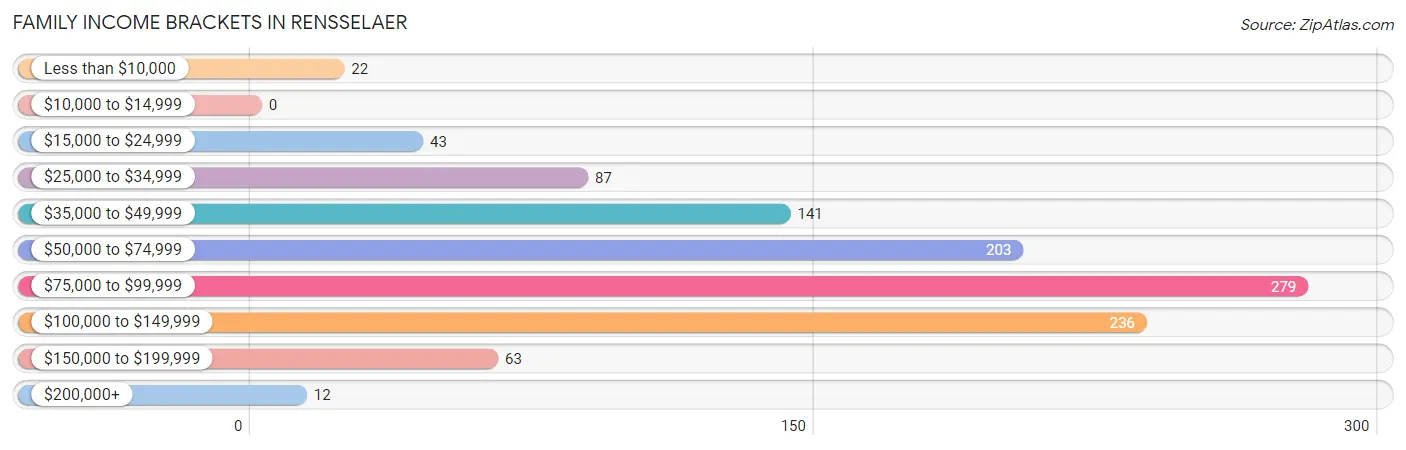
| Income Bracket | # Families | % Families |
| Less than $10,000 | 22 | 2.0% |
| $10,000 to $14,999 | 0 | 0.0% |
| $15,000 to $24,999 | 43 | 4.0% |
| $25,000 to $34,999 | 87 | 8.0% |
| $35,000 to $49,999 | 141 | 13.0% |
| $50,000 to $74,999 | 203 | 18.7% |
| $75,000 to $99,999 | 279 | 25.7% |
| $100,000 to $149,999 | 236 | 21.7% |
| $150,000 to $199,999 | 63 | 5.8% |
| $200,000+ | 12 | 1.1% |
Family Income by Famaliy Size in Rensselaer
7+ person families (37 | 3.4%) account for the highest median family income in Rensselaer with $105,066 per family, while 2-person families (572 | 52.7%) have the highest median income of $36,776 per family member.
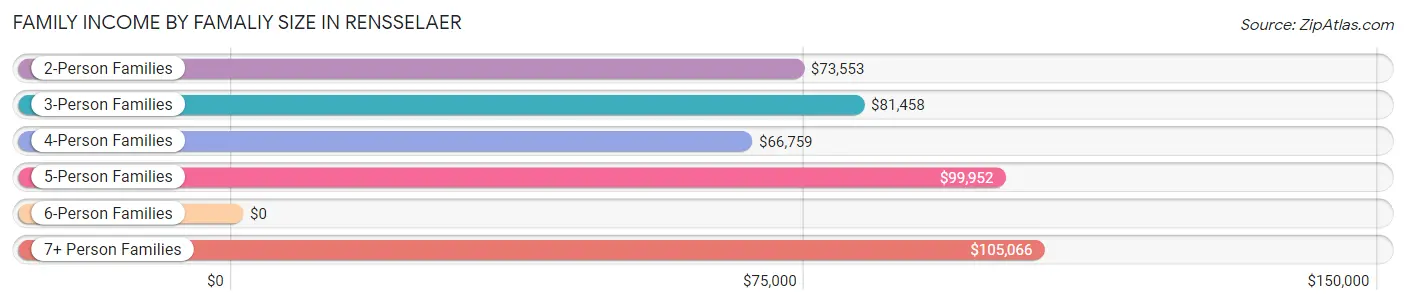
| Income Bracket | # Families | Median Income |
| 2-Person Families | 572 (52.7%) | $73,553 |
| 3-Person Families | 226 (20.8%) | $81,458 |
| 4-Person Families | 154 (14.2%) | $66,759 |
| 5-Person Families | 87 (8.0%) | $99,952 |
| 6-Person Families | 10 (0.9%) | $0 |
| 7+ Person Families | 37 (3.4%) | $105,066 |
| Total | 1,086 (100.0%) | $79,070 |
Family Income by Number of Earners in Rensselaer
The median family income in Rensselaer is $79,070, with families comprising 3+ earners (118) having the highest median family income of $105,789, while families with 1 earner (268) have the lowest median family income of $45,278, accounting for 10.9% and 24.7% of families, respectively.
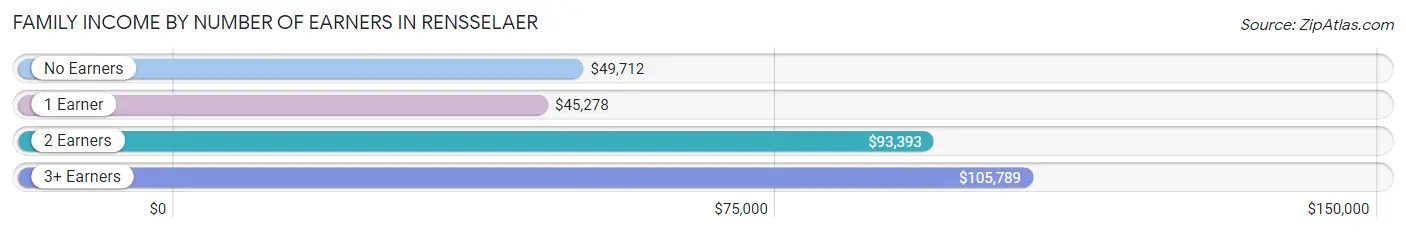
| Number of Earners | # Families | Median Income |
| No Earners | 155 (14.3%) | $49,712 |
| 1 Earner | 268 (24.7%) | $45,278 |
| 2 Earners | 545 (50.2%) | $93,393 |
| 3+ Earners | 118 (10.9%) | $105,789 |
| Total | 1,086 (100.0%) | $79,070 |
Household Income in Rensselaer
Household Income Brackets in Rensselaer
With 458 households falling in the category, the $75,000 to $99,999 income range is the most frequent in Rensselaer, accounting for 21.2% of all households. In contrast, only 13 households (0.6%) fall into the $200,000+ income bracket, making it the least populous group.
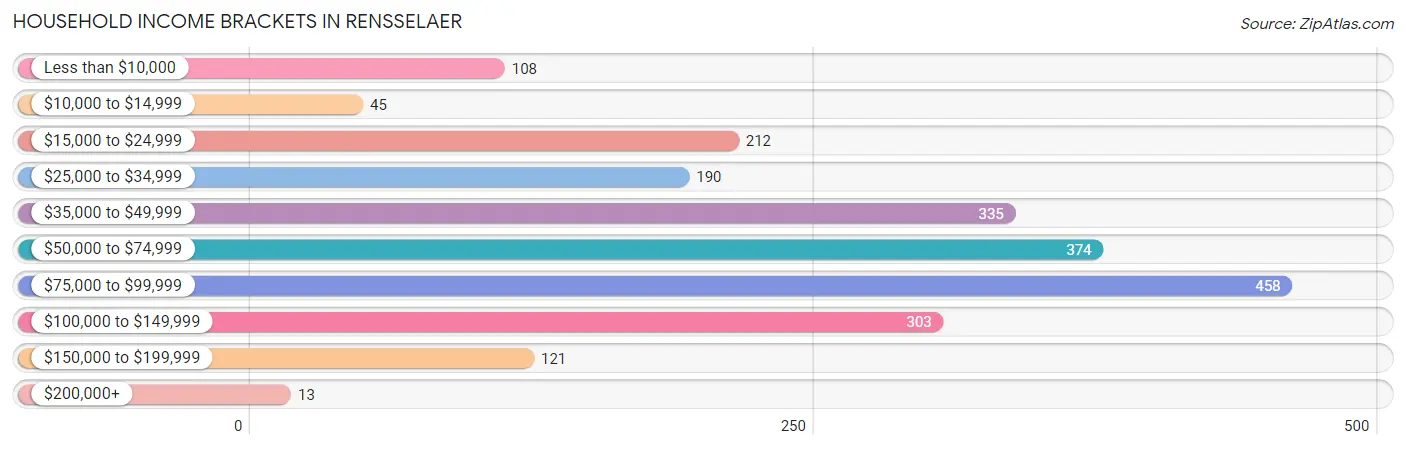
| Income Bracket | # Households | % Households |
| Less than $10,000 | 108 | 5.0% |
| $10,000 to $14,999 | 45 | 2.1% |
| $15,000 to $24,999 | 212 | 9.8% |
| $25,000 to $34,999 | 190 | 8.8% |
| $35,000 to $49,999 | 335 | 15.5% |
| $50,000 to $74,999 | 374 | 17.3% |
| $75,000 to $99,999 | 458 | 21.2% |
| $100,000 to $149,999 | 303 | 14.0% |
| $150,000 to $199,999 | 121 | 5.6% |
| $200,000+ | 13 | 0.6% |
Household Income by Householder Age in Rensselaer
The median household income in Rensselaer is $58,659, with the highest median household income of $74,803 found in the 45 to 64 years age bracket for the primary householder. A total of 717 households (33.2%) fall into this category. Meanwhile, the 15 to 24 years age bracket for the primary householder has the lowest median household income of $31,750, with 111 households (5.1%) in this group.
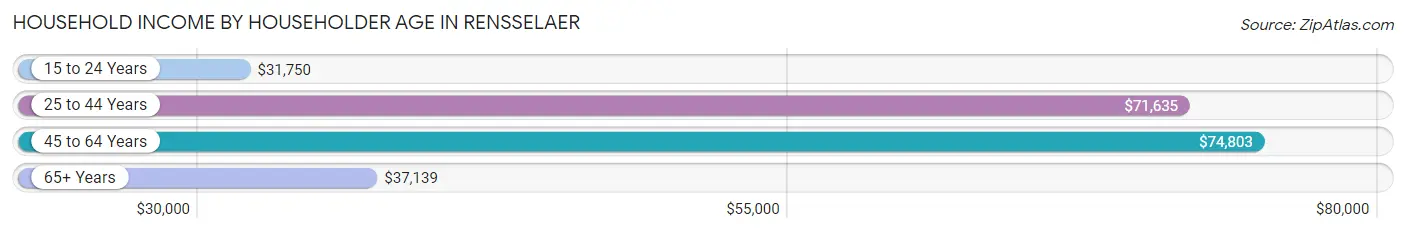
| Income Bracket | # Households | Median Income |
| 15 to 24 Years | 111 (5.1%) | $31,750 |
| 25 to 44 Years | 723 (33.4%) | $71,635 |
| 45 to 64 Years | 717 (33.2%) | $74,803 |
| 65+ Years | 611 (28.3%) | $37,139 |
| Total | 2,162 (100.0%) | $58,659 |
Poverty in Rensselaer
Income Below Poverty by Sex and Age in Rensselaer
With 9.0% poverty level for males and 8.9% for females among the residents of Rensselaer, 18 to 24 year old males and 16 and 17 year old females are the most vulnerable to poverty, with 108 males (49.3%) and 13 females (26.5%) in their respective age groups living below the poverty level.
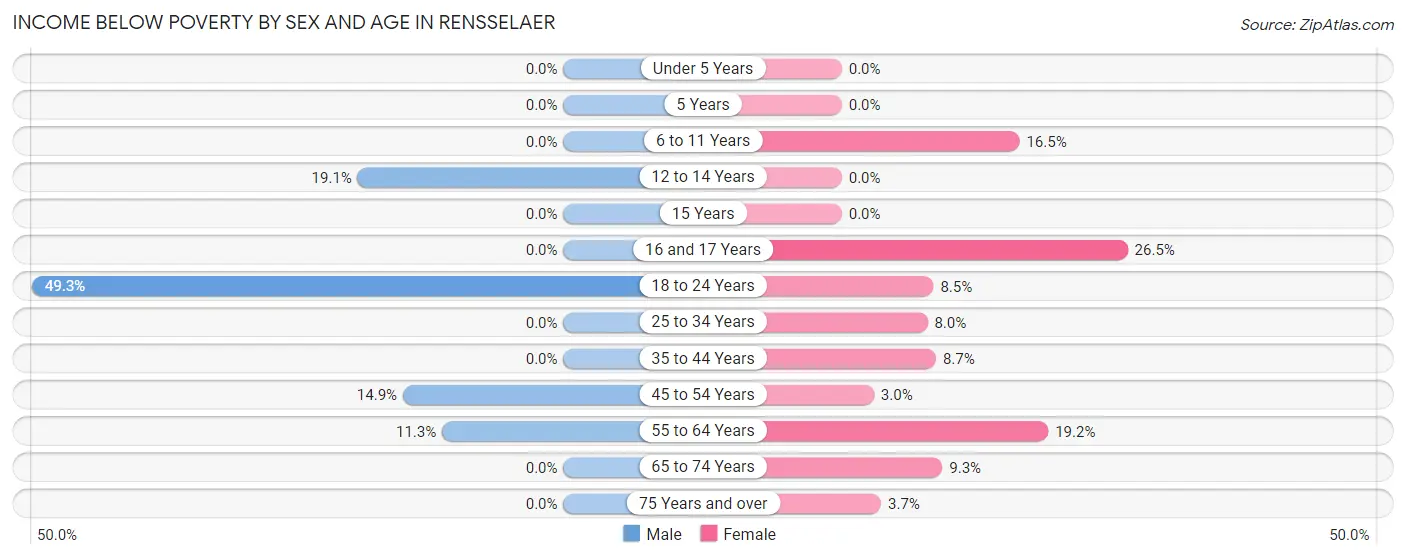
| Age Bracket | Male | Female |
| Under 5 Years | 0 (0.0%) | 0 (0.0%) |
| 5 Years | 0 (0.0%) | 0 (0.0%) |
| 6 to 11 Years | 0 (0.0%) | 48 (16.5%) |
| 12 to 14 Years | 21 (19.1%) | 0 (0.0%) |
| 15 Years | 0 (0.0%) | 0 (0.0%) |
| 16 and 17 Years | 0 (0.0%) | 13 (26.5%) |
| 18 to 24 Years | 108 (49.3%) | 24 (8.5%) |
| 25 to 34 Years | 0 (0.0%) | 28 (8.0%) |
| 35 to 44 Years | 0 (0.0%) | 27 (8.7%) |
| 45 to 54 Years | 56 (14.9%) | 9 (3.0%) |
| 55 to 64 Years | 33 (11.3%) | 50 (19.2%) |
| 65 to 74 Years | 0 (0.0%) | 35 (9.3%) |
| 75 Years and over | 0 (0.0%) | 7 (3.6%) |
| Total | 218 (9.0%) | 241 (8.9%) |
Income Above Poverty by Sex and Age in Rensselaer
According to the poverty statistics in Rensselaer, males aged under 5 years and females aged under 5 years are the age groups that are most secure financially, with 100.0% of males and 100.0% of females in these age groups living above the poverty line.
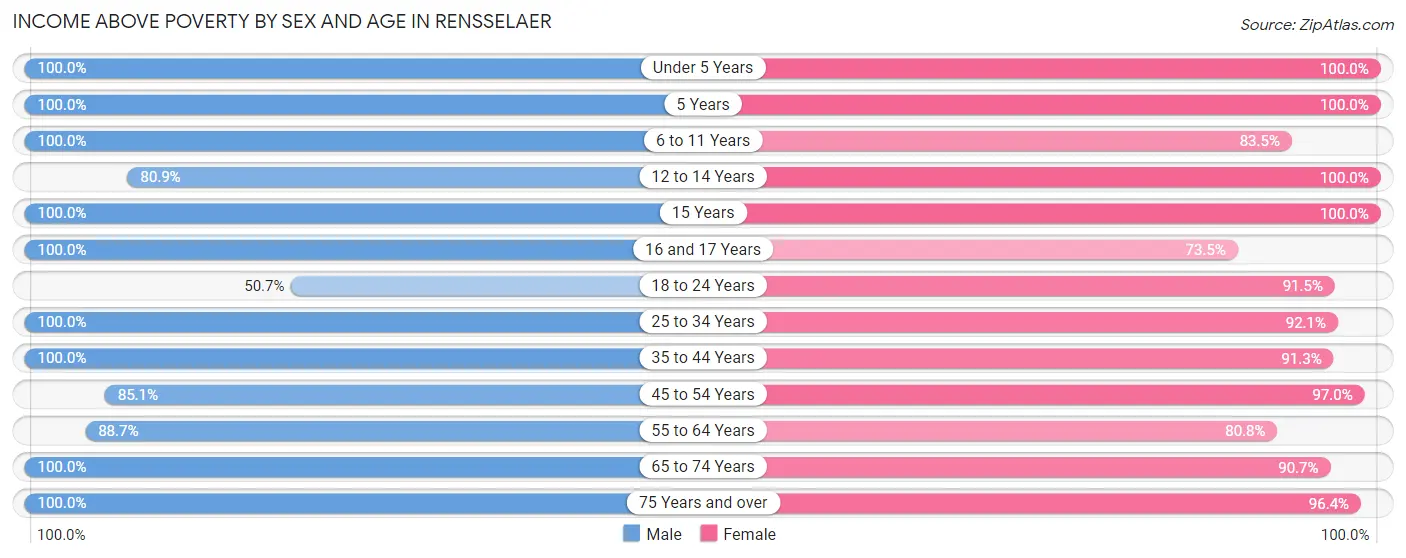
| Age Bracket | Male | Female |
| Under 5 Years | 120 (100.0%) | 131 (100.0%) |
| 5 Years | 46 (100.0%) | 21 (100.0%) |
| 6 to 11 Years | 127 (100.0%) | 243 (83.5%) |
| 12 to 14 Years | 89 (80.9%) | 104 (100.0%) |
| 15 Years | 65 (100.0%) | 33 (100.0%) |
| 16 and 17 Years | 60 (100.0%) | 36 (73.5%) |
| 18 to 24 Years | 111 (50.7%) | 258 (91.5%) |
| 25 to 34 Years | 426 (100.0%) | 324 (92.0%) |
| 35 to 44 Years | 223 (100.0%) | 282 (91.3%) |
| 45 to 54 Years | 320 (85.1%) | 293 (97.0%) |
| 55 to 64 Years | 260 (88.7%) | 211 (80.8%) |
| 65 to 74 Years | 186 (100.0%) | 340 (90.7%) |
| 75 Years and over | 157 (100.0%) | 185 (96.4%) |
| Total | 2,190 (90.9%) | 2,461 (91.1%) |
Income Below Poverty Among Married-Couple Families in Rensselaer
The poverty statistics for married-couple families in Rensselaer show that 3.7% or 30 of the total 801 families live below the poverty line. Families with 5 or more children have the highest poverty rate of 100.0%, comprising of 8 families. On the other hand, families with 1 or 2 children have the lowest poverty rate of 0.0%, which includes 0 families.
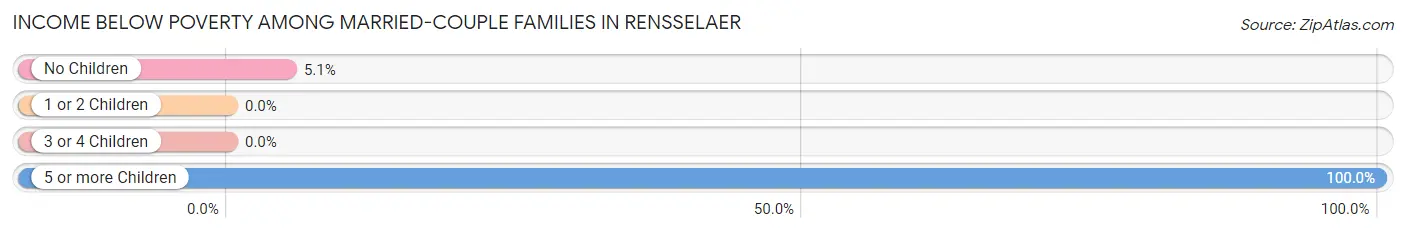
| Children | Above Poverty | Below Poverty |
| No Children | 407 (94.9%) | 22 (5.1%) |
| 1 or 2 Children | 253 (100.0%) | 0 (0.0%) |
| 3 or 4 Children | 111 (100.0%) | 0 (0.0%) |
| 5 or more Children | 0 (0.0%) | 8 (100.0%) |
| Total | 771 (96.3%) | 30 (3.7%) |
Income Below Poverty Among Single-Parent Households in Rensselaer
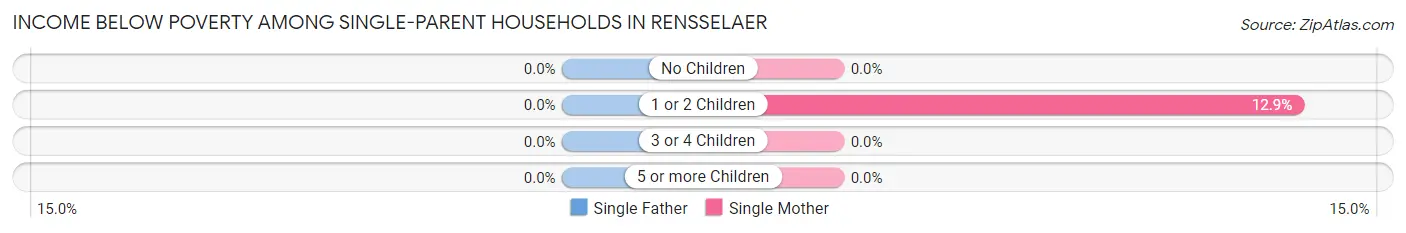
| Children | Single Father | Single Mother |
| No Children | 0 (0.0%) | 0 (0.0%) |
| 1 or 2 Children | 0 (0.0%) | 18 (12.9%) |
| 3 or 4 Children | 0 (0.0%) | 0 (0.0%) |
| 5 or more Children | 0 (0.0%) | 0 (0.0%) |
| Total | 0 (0.0%) | 18 (8.0%) |
Income Below Poverty Among Married-Couple vs Single-Parent Households in Rensselaer
The poverty data for Rensselaer shows that 30 of the married-couple family households (3.7%) and 18 of the single-parent households (6.3%) are living below the poverty level. Within the married-couple family households, those with 5 or more children have the highest poverty rate, with 8 households (100.0%) falling below the poverty line. Among the single-parent households, those with 1 or 2 children have the highest poverty rate, with 18 household (10.3%) living below poverty.
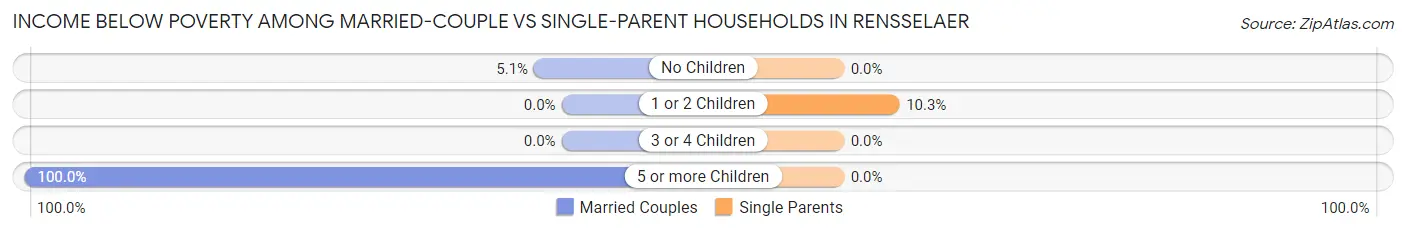
| Children | Married-Couple Families | Single-Parent Households |
| No Children | 22 (5.1%) | 0 (0.0%) |
| 1 or 2 Children | 0 (0.0%) | 18 (10.3%) |
| 3 or 4 Children | 0 (0.0%) | 0 (0.0%) |
| 5 or more Children | 8 (100.0%) | 0 (0.0%) |
| Total | 30 (3.7%) | 18 (6.3%) |
Race in Rensselaer
The most populous races in Rensselaer are White / Caucasian (4,743 | 89.0%), Hispanic or Latino (415 | 7.8%), and Two or more Races (319 | 6.0%).
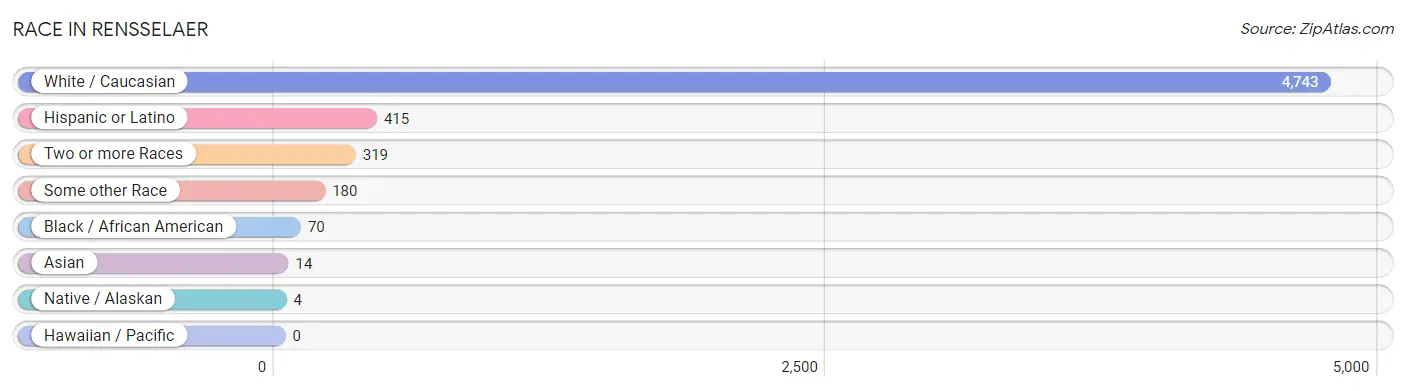
| Race | # Population | % Population |
| Asian | 14 | 0.3% |
| Black / African American | 70 | 1.3% |
| Hawaiian / Pacific | 0 | 0.0% |
| Hispanic or Latino | 415 | 7.8% |
| Native / Alaskan | 4 | 0.1% |
| White / Caucasian | 4,743 | 89.0% |
| Two or more Races | 319 | 6.0% |
| Some other Race | 180 | 3.4% |
| Total | 5,330 | 100.0% |
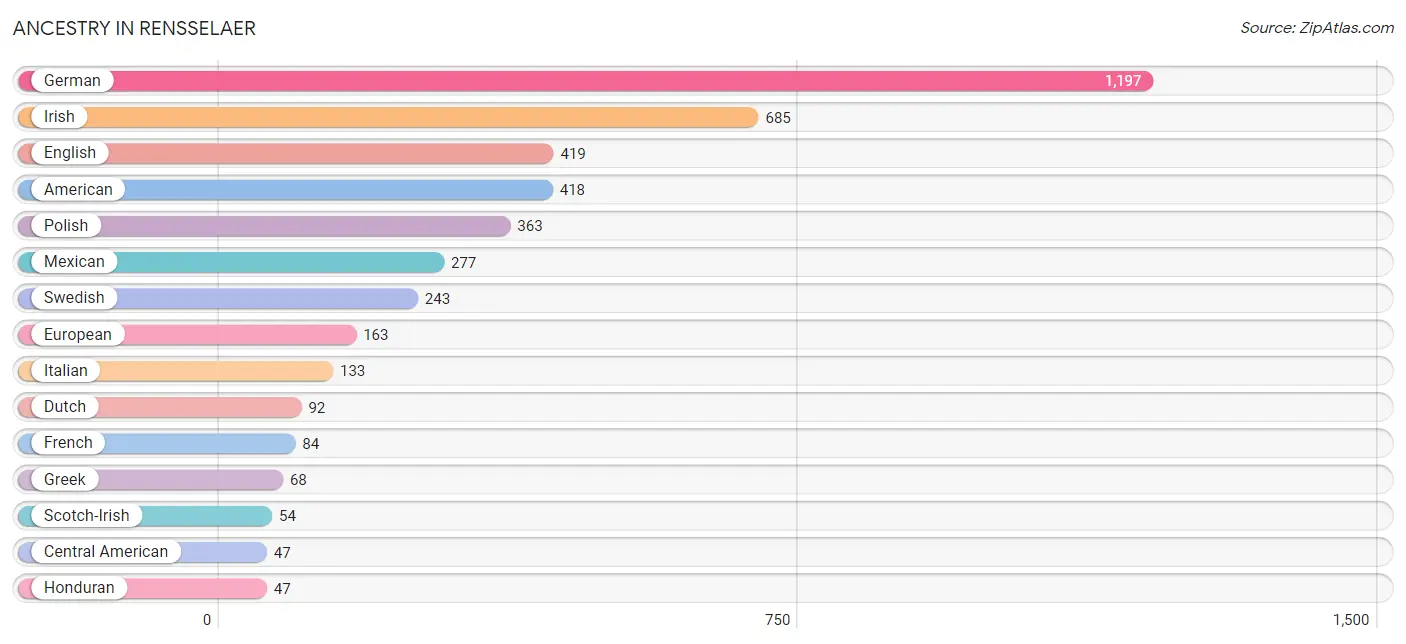
Ancestry in Rensselaer
The most populous ancestries reported in Rensselaer are German (1,197 | 22.5%), Irish (685 | 12.9%), English (419 | 7.9%), American (418 | 7.8%), and Polish (363 | 6.8%), together accounting for 57.8% of all Rensselaer residents.
| Ancestry | # Population | % Population |
| American | 418 | 7.8% |
| Belizean | 40 | 0.7% |
| Blackfeet | 3 | 0.1% |
| British | 9 | 0.2% |
| Central American | 47 | 0.9% |
| Cherokee | 8 | 0.2% |
| Czech | 26 | 0.5% |
| Dutch | 92 | 1.7% |
| Eastern European | 17 | 0.3% |
| English | 419 | 7.9% |
| European | 163 | 3.1% |
| French | 84 | 1.6% |
| German | 1,197 | 22.5% |
| Greek | 68 | 1.3% |
| Honduran | 47 | 0.9% |
| Hungarian | 20 | 0.4% |
| Indian (Asian) | 14 | 0.3% |
| Irish | 685 | 12.9% |
| Italian | 133 | 2.5% |
| Mexican | 277 | 5.2% |
| Norwegian | 4 | 0.1% |
| Polish | 363 | 6.8% |
| Puerto Rican | 19 | 0.4% |
| Romanian | 6 | 0.1% |
| Russian | 19 | 0.4% |
| Scotch-Irish | 54 | 1.0% |
| Scottish | 22 | 0.4% |
| Swedish | 243 | 4.6% |
| Yugoslavian | 13 | 0.2% | View All 29 Rows |
Immigrants in Rensselaer
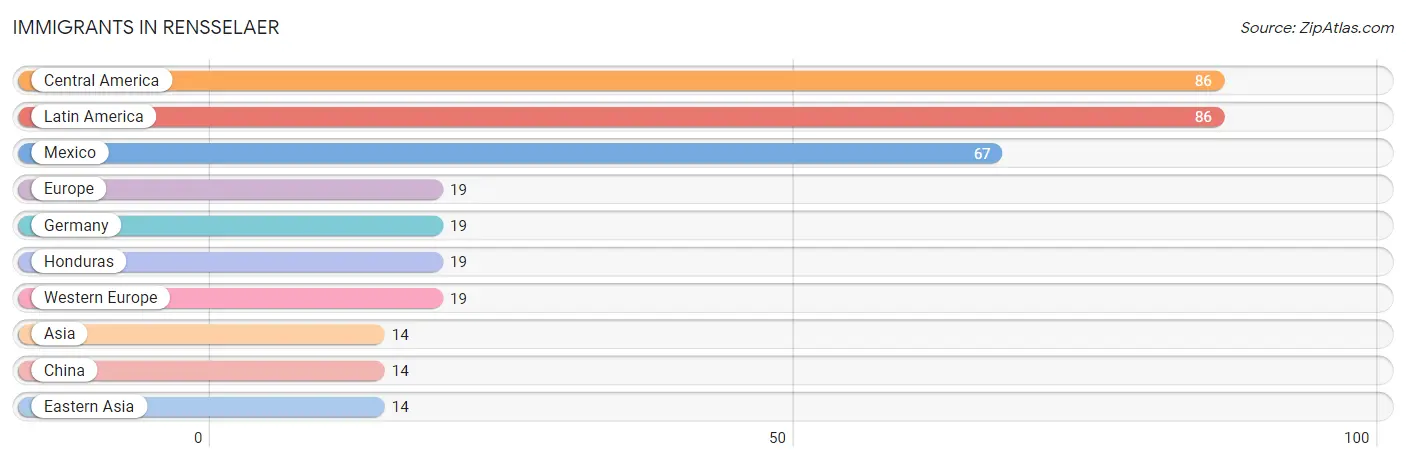
The most numerous immigrant groups reported in Rensselaer came from Central America (86 | 1.6%), Latin America (86 | 1.6%), Mexico (67 | 1.3%), Europe (19 | 0.4%), and Germany (19 | 0.4%), together accounting for 5.2% of all Rensselaer residents.
| Immigration Origin | # Population | % Population |
| Asia | 14 | 0.3% |
| Central America | 86 | 1.6% |
| China | 14 | 0.3% |
| Eastern Asia | 14 | 0.3% |
| Europe | 19 | 0.4% |
| Germany | 19 | 0.4% |
| Honduras | 19 | 0.4% |
| Latin America | 86 | 1.6% |
| Mexico | 67 | 1.3% |
| Western Europe | 19 | 0.4% | View All 10 Rows |
Sex and Age in Rensselaer
Sex and Age in Rensselaer
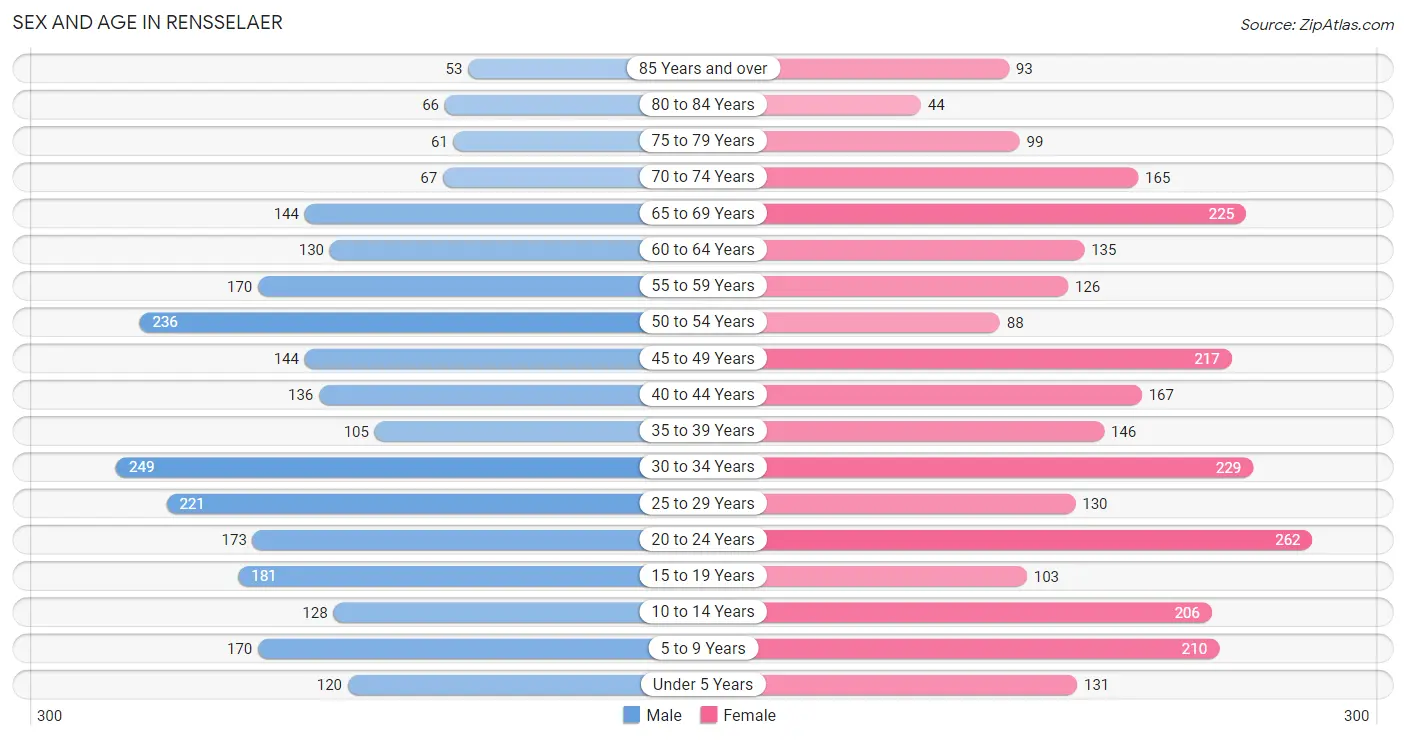
The most populous age groups in Rensselaer are 30 to 34 Years (249 | 9.8%) for men and 20 to 24 Years (262 | 9.4%) for women.
| Age Bracket | Male | Female |
| Under 5 Years | 120 (4.7%) | 131 (4.7%) |
| 5 to 9 Years | 170 (6.7%) | 210 (7.6%) |
| 10 to 14 Years | 128 (5.0%) | 206 (7.4%) |
| 15 to 19 Years | 181 (7.1%) | 103 (3.7%) |
| 20 to 24 Years | 173 (6.8%) | 262 (9.4%) |
| 25 to 29 Years | 221 (8.6%) | 130 (4.7%) |
| 30 to 34 Years | 249 (9.8%) | 229 (8.3%) |
| 35 to 39 Years | 105 (4.1%) | 146 (5.3%) |
| 40 to 44 Years | 136 (5.3%) | 167 (6.0%) |
| 45 to 49 Years | 144 (5.6%) | 217 (7.8%) |
| 50 to 54 Years | 236 (9.2%) | 88 (3.2%) |
| 55 to 59 Years | 170 (6.7%) | 126 (4.5%) |
| 60 to 64 Years | 130 (5.1%) | 135 (4.9%) |
| 65 to 69 Years | 144 (5.6%) | 225 (8.1%) |
| 70 to 74 Years | 67 (2.6%) | 165 (5.9%) |
| 75 to 79 Years | 61 (2.4%) | 99 (3.6%) |
| 80 to 84 Years | 66 (2.6%) | 44 (1.6%) |
| 85 Years and over | 53 (2.1%) | 93 (3.4%) |
| Total | 2,554 (100.0%) | 2,776 (100.0%) |
Families and Households in Rensselaer
Median Family Size in Rensselaer
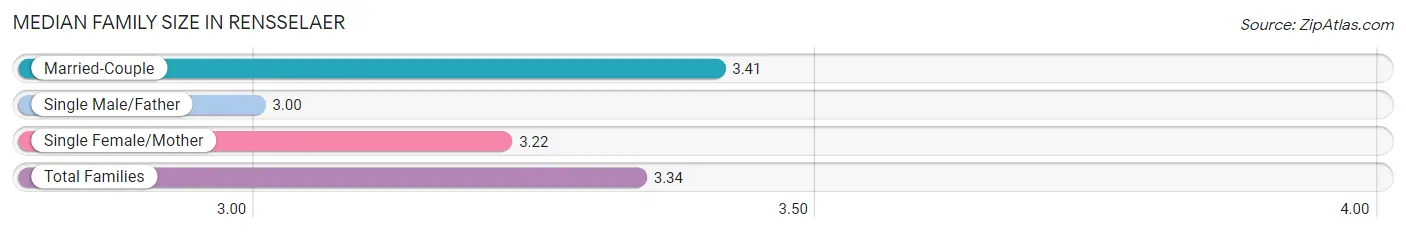
The median family size in Rensselaer is 3.34 persons per family, with married-couple families (801 | 73.8%) accounting for the largest median family size of 3.41 persons per family. On the other hand, single male/father families (60 | 5.5%) represent the smallest median family size with 3.00 persons per family.
| Family Type | # Families | Family Size |
| Married-Couple | 801 (73.8%) | 3.41 |
| Single Male/Father | 60 (5.5%) | 3.00 |
| Single Female/Mother | 225 (20.7%) | 3.22 |
| Total Families | 1,086 (100.0%) | 3.34 |
Median Household Size in Rensselaer
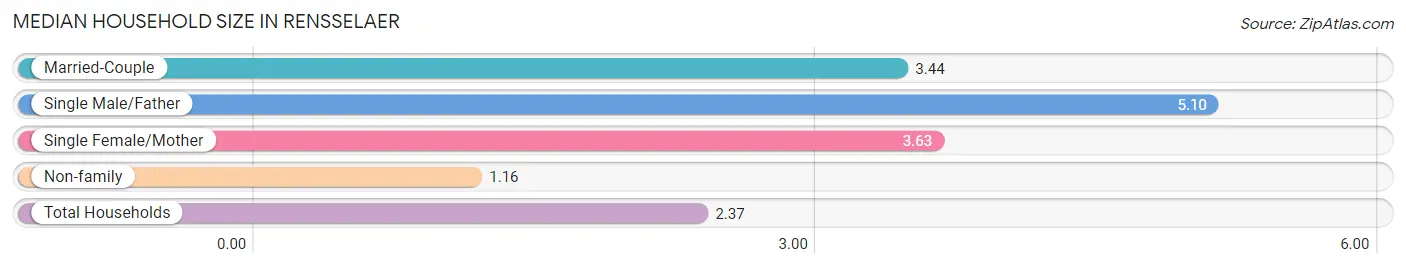
The median household size in Rensselaer is 2.37 persons per household, with single male/father households (60 | 2.8%) accounting for the largest median household size of 5.1 persons per household. non-family households (1,076 | 49.8%) represent the smallest median household size with 1.16 persons per household.
| Household Type | # Households | Household Size |
| Married-Couple | 801 (37.0%) | 3.44 |
| Single Male/Father | 60 (2.8%) | 5.10 |
| Single Female/Mother | 225 (10.4%) | 3.63 |
| Non-family | 1,076 (49.8%) | 1.16 |
| Total Households | 2,162 (100.0%) | 2.37 |
Household Size by Marriage Status in Rensselaer
Out of a total of 2,162 households in Rensselaer, 1,086 (50.2%) are family households, while 1,076 (49.8%) are nonfamily households. The most numerous type of family households are 2-person households, comprising 566, and the most common type of nonfamily households are 1-person households, comprising 942.
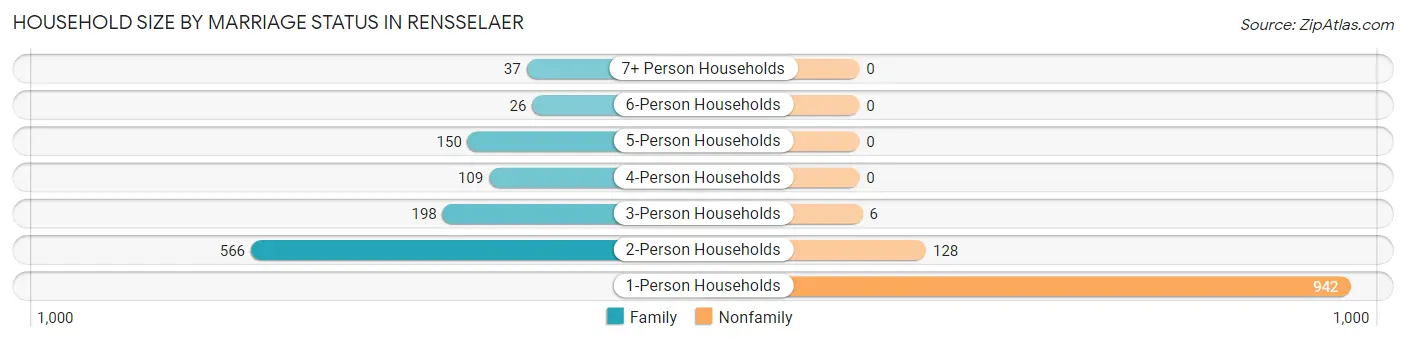
| Household Size | Family Households | Nonfamily Households |
| 1-Person Households | - | 942 (43.6%) |
| 2-Person Households | 566 (26.2%) | 128 (5.9%) |
| 3-Person Households | 198 (9.2%) | 6 (0.3%) |
| 4-Person Households | 109 (5.0%) | 0 (0.0%) |
| 5-Person Households | 150 (6.9%) | 0 (0.0%) |
| 6-Person Households | 26 (1.2%) | 0 (0.0%) |
| 7+ Person Households | 37 (1.7%) | 0 (0.0%) |
| Total | 1,086 (50.2%) | 1,076 (49.8%) |
Female Fertility in Rensselaer
Fertility by Age in Rensselaer
Average fertility rate in Rensselaer is 46.0 births per 1,000 women. Women in the age bracket of 20 to 34 years have the highest fertility rate with 63.0 births per 1,000 women. Women in the age bracket of 20 to 34 years acount for 67.2% of all women with births.
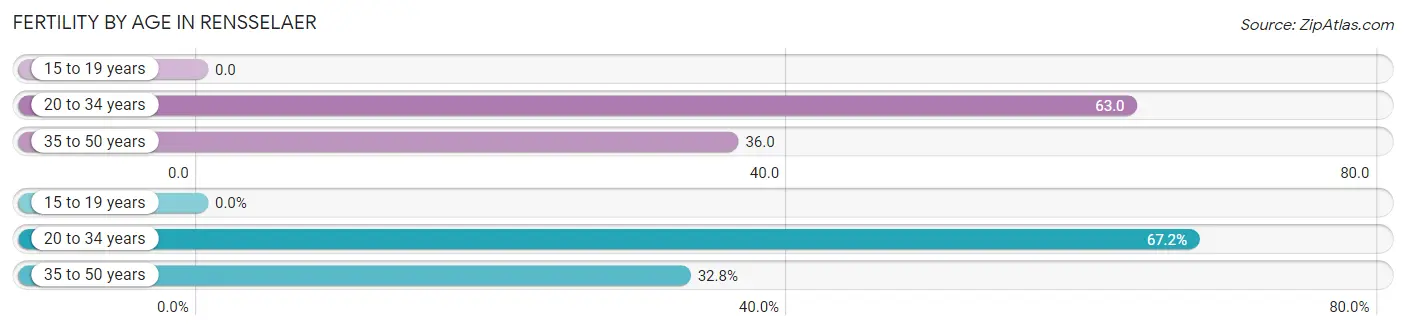
| Age Bracket | Women with Births | Births / 1,000 Women |
| 15 to 19 years | 0 (0.0%) | 0.0 |
| 20 to 34 years | 39 (67.2%) | 63.0 |
| 35 to 50 years | 19 (32.8%) | 36.0 |
| Total | 58 (100.0%) | 46.0 |
Fertility by Age by Marriage Status in Rensselaer
84.5% of women with births (58) in Rensselaer are married. The highest percentage of unmarried women with births falls into 20 to 34 years age bracket with 23.1% of them unmarried at the time of birth, while the lowest percentage of unmarried women with births belong to 35 to 50 years age bracket with 0.0% of them unmarried.
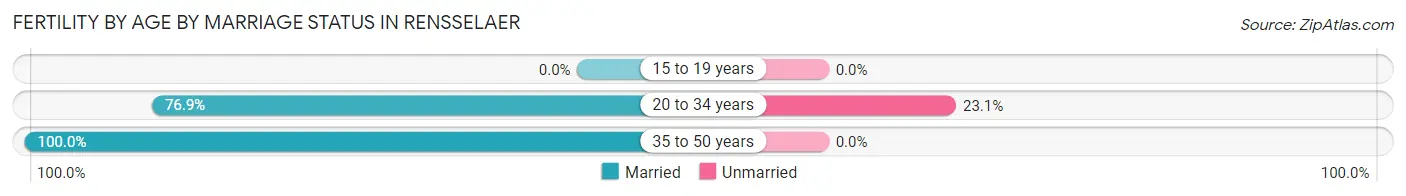
| Age Bracket | Married | Unmarried |
| 15 to 19 years | 0 (0.0%) | 0 (0.0%) |
| 20 to 34 years | 30 (76.9%) | 9 (23.1%) |
| 35 to 50 years | 19 (100.0%) | 0 (0.0%) |
| Total | 49 (84.5%) | 9 (15.5%) |
Fertility by Education in Rensselaer
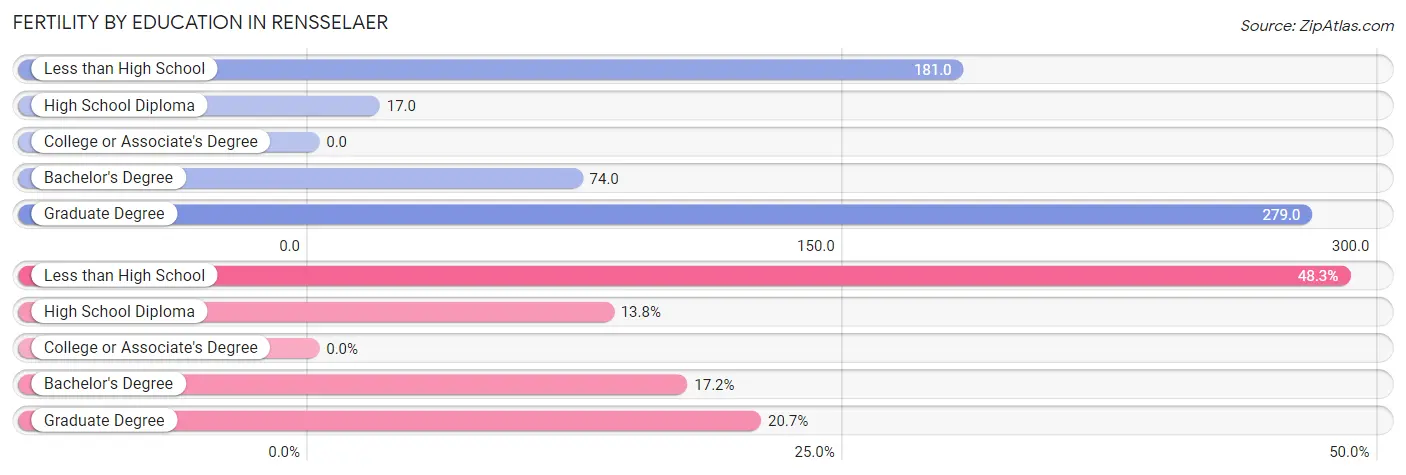
| Educational Attainment | Women with Births | Births / 1,000 Women |
| Less than High School | 28 (48.3%) | 181.0 |
| High School Diploma | 8 (13.8%) | 17.0 |
| College or Associate's Degree | 0 (0.0%) | 0.0 |
| Bachelor's Degree | 10 (17.2%) | 74.0 |
| Graduate Degree | 12 (20.7%) | 279.0 |
| Total | 58 (100.0%) | 46.0 |
Fertility by Education by Marriage Status in Rensselaer
15.5% of women with births in Rensselaer are unmarried. Women with the educational attainment of high school diploma are most likely to be married with 100.0% of them married at childbirth, while women with the educational attainment of less than high school are least likely to be married with 32.1% of them unmarried at childbirth.
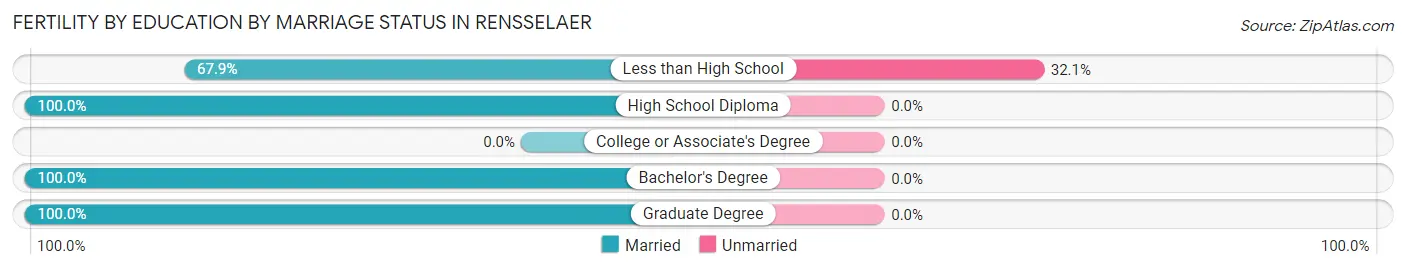
| Educational Attainment | Married | Unmarried |
| Less than High School | 19 (67.9%) | 9 (32.1%) |
| High School Diploma | 8 (100.0%) | 0 (0.0%) |
| College or Associate's Degree | 0 (0.0%) | 0 (0.0%) |
| Bachelor's Degree | 10 (100.0%) | 0 (0.0%) |
| Graduate Degree | 12 (100.0%) | 0 (0.0%) |
| Total | 49 (84.5%) | 9 (15.5%) |
Employment Characteristics in Rensselaer
Employment by Class of Employer in Rensselaer
Among the 2,683 employed individuals in Rensselaer, private company employees (1,965 | 73.2%), local government employees (253 | 9.4%), and not-for-profit organizations (176 | 6.6%) make up the most common classes of employment.
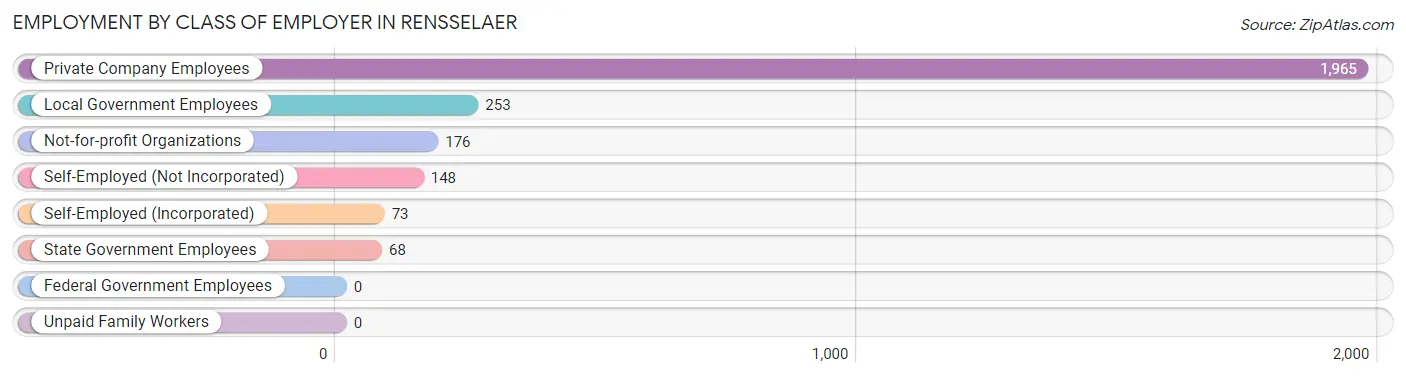
| Employer Class | # Employees | % Employees |
| Private Company Employees | 1,965 | 73.2% |
| Self-Employed (Incorporated) | 73 | 2.7% |
| Self-Employed (Not Incorporated) | 148 | 5.5% |
| Not-for-profit Organizations | 176 | 6.6% |
| Local Government Employees | 253 | 9.4% |
| State Government Employees | 68 | 2.5% |
| Federal Government Employees | 0 | 0.0% |
| Unpaid Family Workers | 0 | 0.0% |
| Total | 2,683 | 100.0% |
Employment Status by Age in Rensselaer
According to the labor force statistics for Rensselaer, out of the total population over 16 years of age (4,267), 65.4% or 2,791 individuals are in the labor force, with 2.7% or 75 of them unemployed. The age group with the highest labor force participation rate is 35 to 44 years, with 91.3% or 506 individuals in the labor force. Within the labor force, the 20 to 24 years age range has the highest percentage of unemployed individuals, with 7.1% or 23 of them being unemployed.
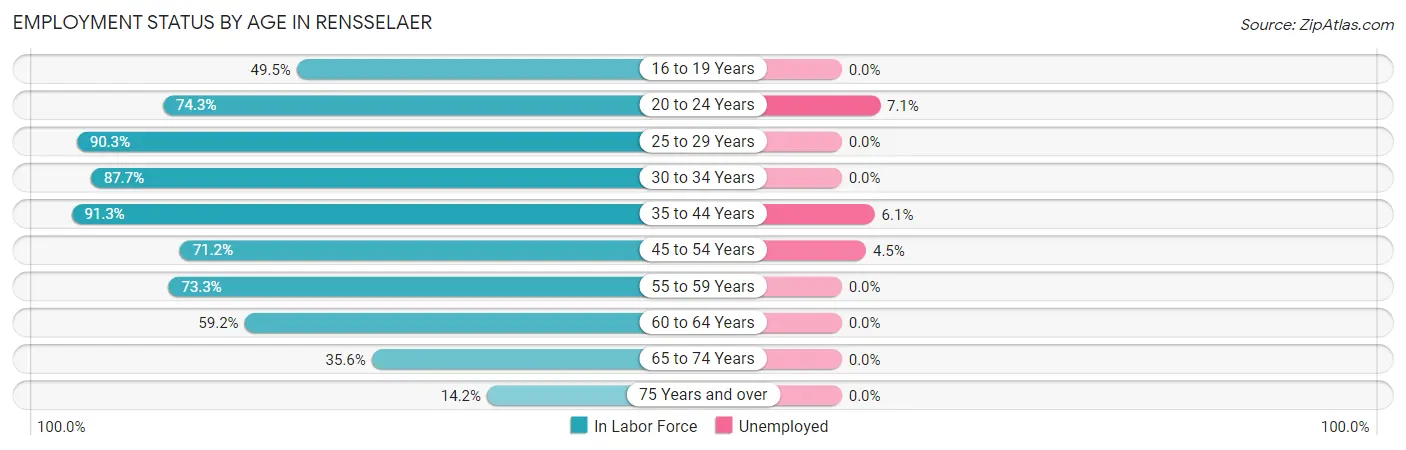
| Age Bracket | In Labor Force | Unemployed |
| 16 to 19 Years | 92 (49.5%) | 0 (0.0%) |
| 20 to 24 Years | 323 (74.3%) | 23 (7.1%) |
| 25 to 29 Years | 317 (90.3%) | 0 (0.0%) |
| 30 to 34 Years | 419 (87.7%) | 0 (0.0%) |
| 35 to 44 Years | 506 (91.3%) | 31 (6.1%) |
| 45 to 54 Years | 488 (71.2%) | 22 (4.5%) |
| 55 to 59 Years | 217 (73.3%) | 0 (0.0%) |
| 60 to 64 Years | 157 (59.2%) | 0 (0.0%) |
| 65 to 74 Years | 214 (35.6%) | 0 (0.0%) |
| 75 Years and over | 59 (14.2%) | 0 (0.0%) |
| Total | 2,791 (65.4%) | 75 (2.7%) |
Employment Status by Educational Attainment in Rensselaer
According to labor force statistics for Rensselaer, 80.0% of individuals (2,103) out of the total population between 25 and 64 years of age (2,629) are in the labor force, with 2.5% or 53 of them being unemployed. The group with the highest labor force participation rate are those with the educational attainment of bachelor's degree or higher, with 90.7% or 427 individuals in the labor force. Within the labor force, individuals with high school diploma education have the highest percentage of unemployment, with 4.3% or 31 of them being unemployed.
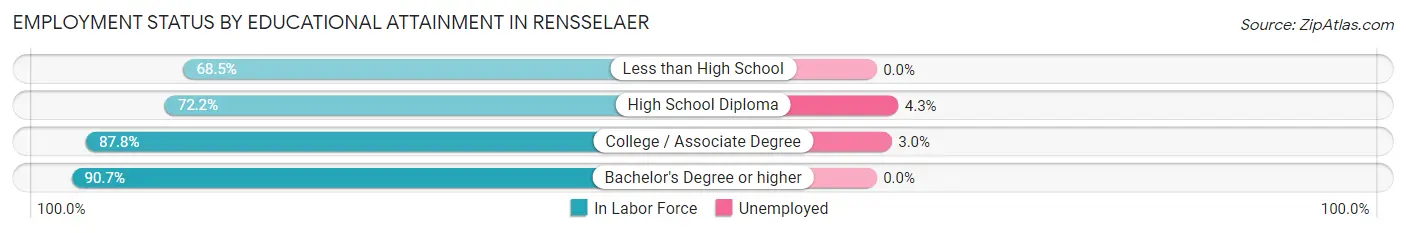
| Educational Attainment | In Labor Force | Unemployed |
| Less than High School | 217 (68.5%) | 0 (0.0%) |
| High School Diploma | 726 (72.2%) | 43 (4.3%) |
| College / Associate Degree | 734 (87.8%) | 25 (3.0%) |
| Bachelor's Degree or higher | 427 (90.7%) | 0 (0.0%) |
| Total | 2,103 (80.0%) | 66 (2.5%) |
Employment Occupations by Sex in Rensselaer
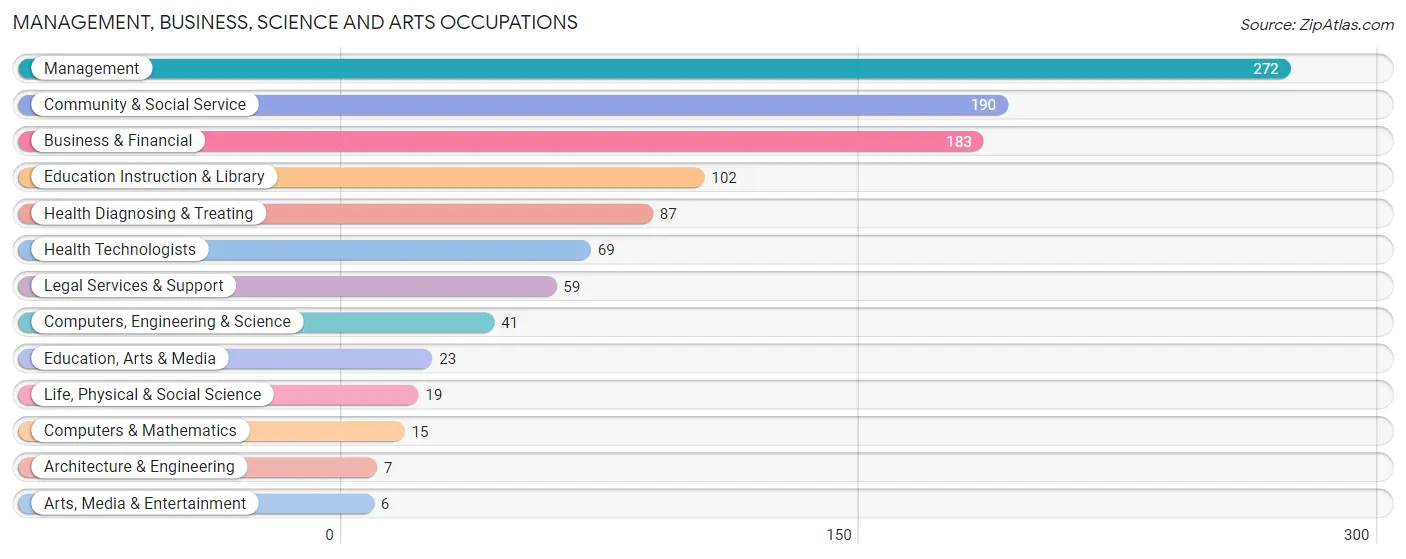
Management, Business, Science and Arts Occupations
The most common Management, Business, Science and Arts occupations in Rensselaer are Management (272 | 10.0%), Community & Social Service (190 | 7.0%), Business & Financial (183 | 6.7%), Education Instruction & Library (102 | 3.8%), and Health Diagnosing & Treating (87 | 3.2%).
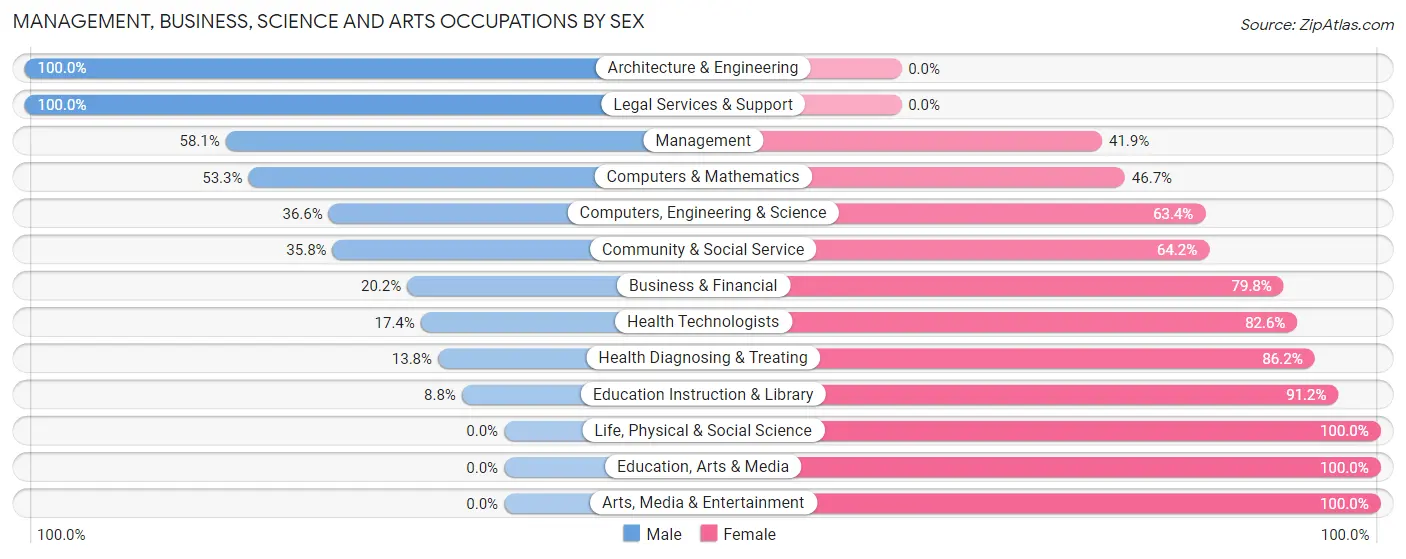
Management, Business, Science and Arts Occupations by Sex
Within the Management, Business, Science and Arts occupations in Rensselaer, the most male-oriented occupations are Architecture & Engineering (100.0%), Legal Services & Support (100.0%), and Management (58.1%), while the most female-oriented occupations are Life, Physical & Social Science (100.0%), Education, Arts & Media (100.0%), and Arts, Media & Entertainment (100.0%).
| Occupation | Male | Female |
| Management | 158 (58.1%) | 114 (41.9%) |
| Business & Financial | 37 (20.2%) | 146 (79.8%) |
| Computers, Engineering & Science | 15 (36.6%) | 26 (63.4%) |
| Computers & Mathematics | 8 (53.3%) | 7 (46.7%) |
| Architecture & Engineering | 7 (100.0%) | 0 (0.0%) |
| Life, Physical & Social Science | 0 (0.0%) | 19 (100.0%) |
| Community & Social Service | 68 (35.8%) | 122 (64.2%) |
| Education, Arts & Media | 0 (0.0%) | 23 (100.0%) |
| Legal Services & Support | 59 (100.0%) | 0 (0.0%) |
| Education Instruction & Library | 9 (8.8%) | 93 (91.2%) |
| Arts, Media & Entertainment | 0 (0.0%) | 6 (100.0%) |
| Health Diagnosing & Treating | 12 (13.8%) | 75 (86.2%) |
| Health Technologists | 12 (17.4%) | 57 (82.6%) |
| Total (Category) | 290 (37.5%) | 483 (62.5%) |
| Total (Overall) | 1,356 (49.9%) | 1,360 (50.1%) |
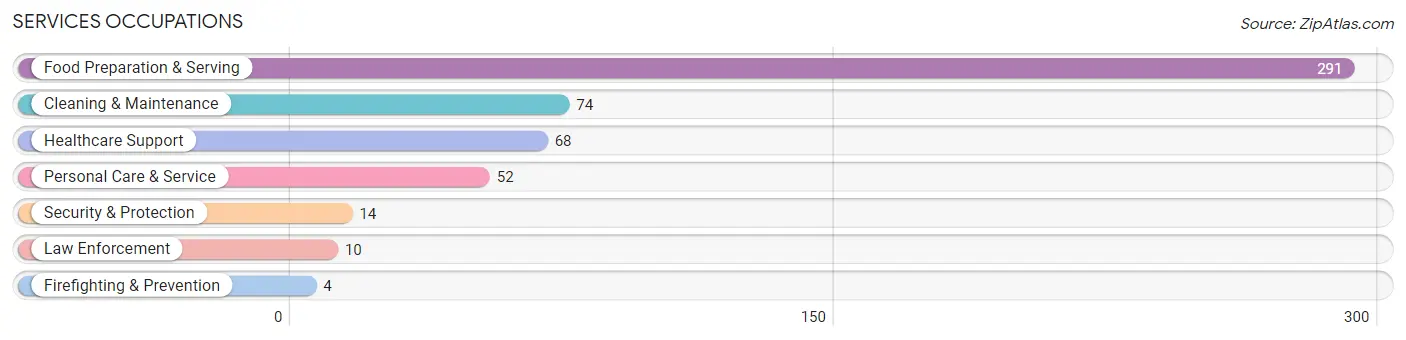
Services Occupations
The most common Services occupations in Rensselaer are Food Preparation & Serving (291 | 10.7%), Cleaning & Maintenance (74 | 2.7%), Healthcare Support (68 | 2.5%), Personal Care & Service (52 | 1.9%), and Security & Protection (14 | 0.5%).
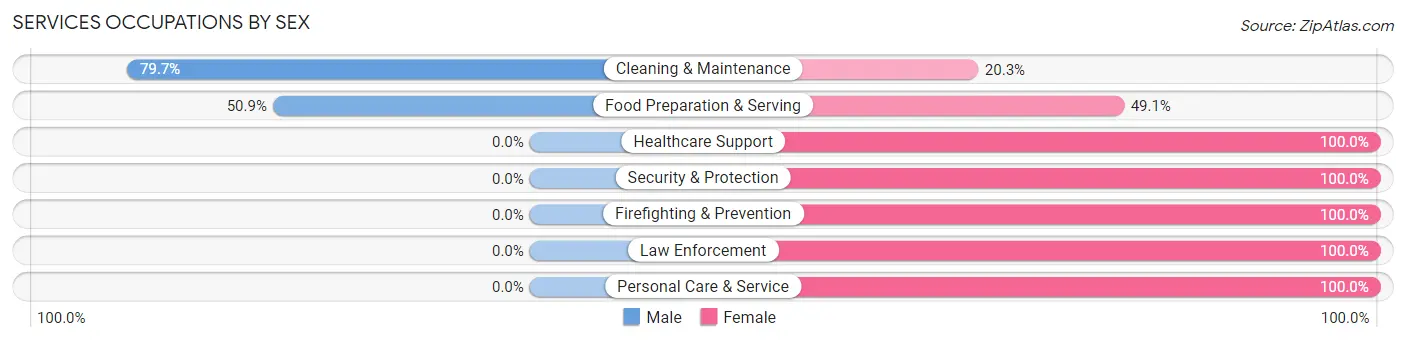
Services Occupations by Sex
Within the Services occupations in Rensselaer, the most male-oriented occupations are Cleaning & Maintenance (79.7%), and Food Preparation & Serving (50.9%), while the most female-oriented occupations are Healthcare Support (100.0%), Security & Protection (100.0%), and Firefighting & Prevention (100.0%).
| Occupation | Male | Female |
| Healthcare Support | 0 (0.0%) | 68 (100.0%) |
| Security & Protection | 0 (0.0%) | 14 (100.0%) |
| Firefighting & Prevention | 0 (0.0%) | 4 (100.0%) |
| Law Enforcement | 0 (0.0%) | 10 (100.0%) |
| Food Preparation & Serving | 148 (50.9%) | 143 (49.1%) |
| Cleaning & Maintenance | 59 (79.7%) | 15 (20.3%) |
| Personal Care & Service | 0 (0.0%) | 52 (100.0%) |
| Total (Category) | 207 (41.5%) | 292 (58.5%) |
| Total (Overall) | 1,356 (49.9%) | 1,360 (50.1%) |
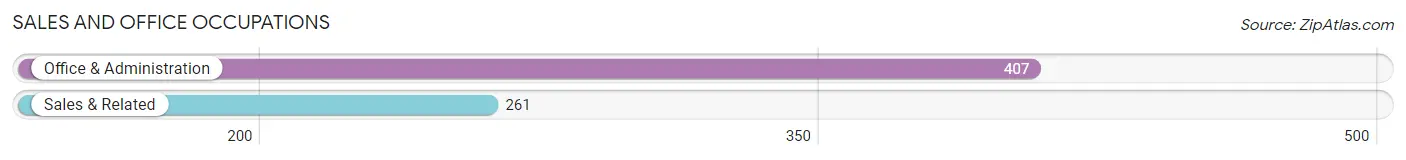
Sales and Office Occupations
The most common Sales and Office occupations in Rensselaer are Office & Administration (407 | 15.0%), and Sales & Related (261 | 9.6%).
Sales and Office Occupations by Sex
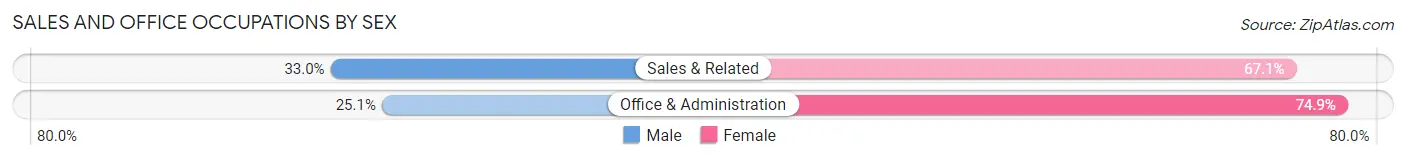
| Occupation | Male | Female |
| Sales & Related | 86 (33.0%) | 175 (67.0%) |
| Office & Administration | 102 (25.1%) | 305 (74.9%) |
| Total (Category) | 188 (28.1%) | 480 (71.9%) |
| Total (Overall) | 1,356 (49.9%) | 1,360 (50.1%) |
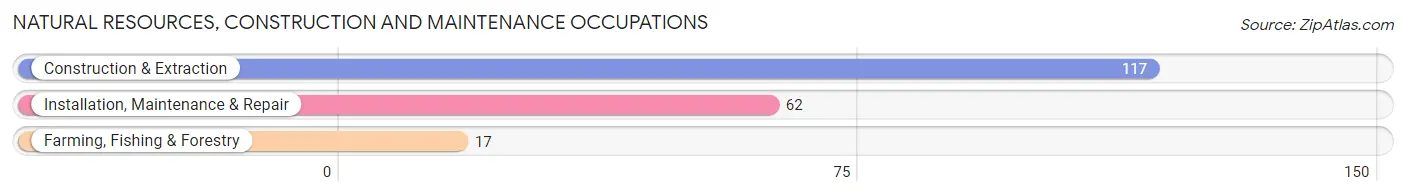
Natural Resources, Construction and Maintenance Occupations
The most common Natural Resources, Construction and Maintenance occupations in Rensselaer are Construction & Extraction (117 | 4.3%), Installation, Maintenance & Repair (62 | 2.3%), and Farming, Fishing & Forestry (17 | 0.6%).
Natural Resources, Construction and Maintenance Occupations by Sex
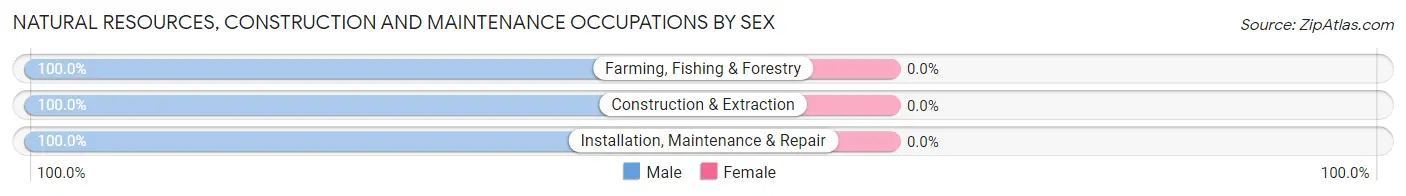
| Occupation | Male | Female |
| Farming, Fishing & Forestry | 17 (100.0%) | 0 (0.0%) |
| Construction & Extraction | 117 (100.0%) | 0 (0.0%) |
| Installation, Maintenance & Repair | 62 (100.0%) | 0 (0.0%) |
| Total (Category) | 196 (100.0%) | 0 (0.0%) |
| Total (Overall) | 1,356 (49.9%) | 1,360 (50.1%) |
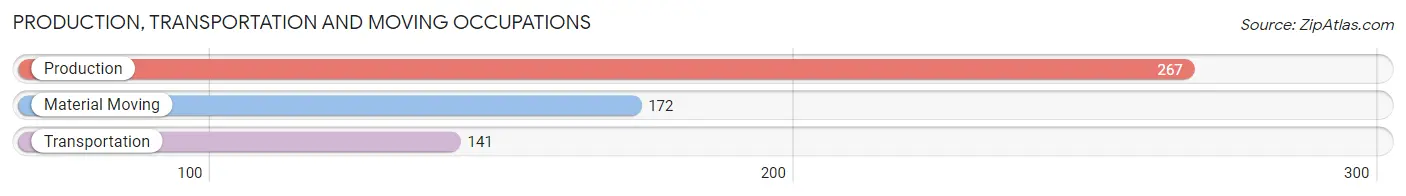
Production, Transportation and Moving Occupations
The most common Production, Transportation and Moving occupations in Rensselaer are Production (267 | 9.8%), Material Moving (172 | 6.3%), and Transportation (141 | 5.2%).
Production, Transportation and Moving Occupations by Sex
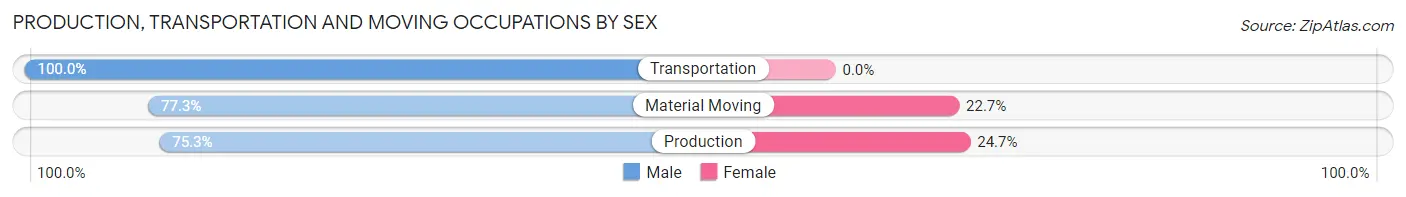
| Occupation | Male | Female |
| Production | 201 (75.3%) | 66 (24.7%) |
| Transportation | 141 (100.0%) | 0 (0.0%) |
| Material Moving | 133 (77.3%) | 39 (22.7%) |
| Total (Category) | 475 (81.9%) | 105 (18.1%) |
| Total (Overall) | 1,356 (49.9%) | 1,360 (50.1%) |
Employment Industries by Sex in Rensselaer
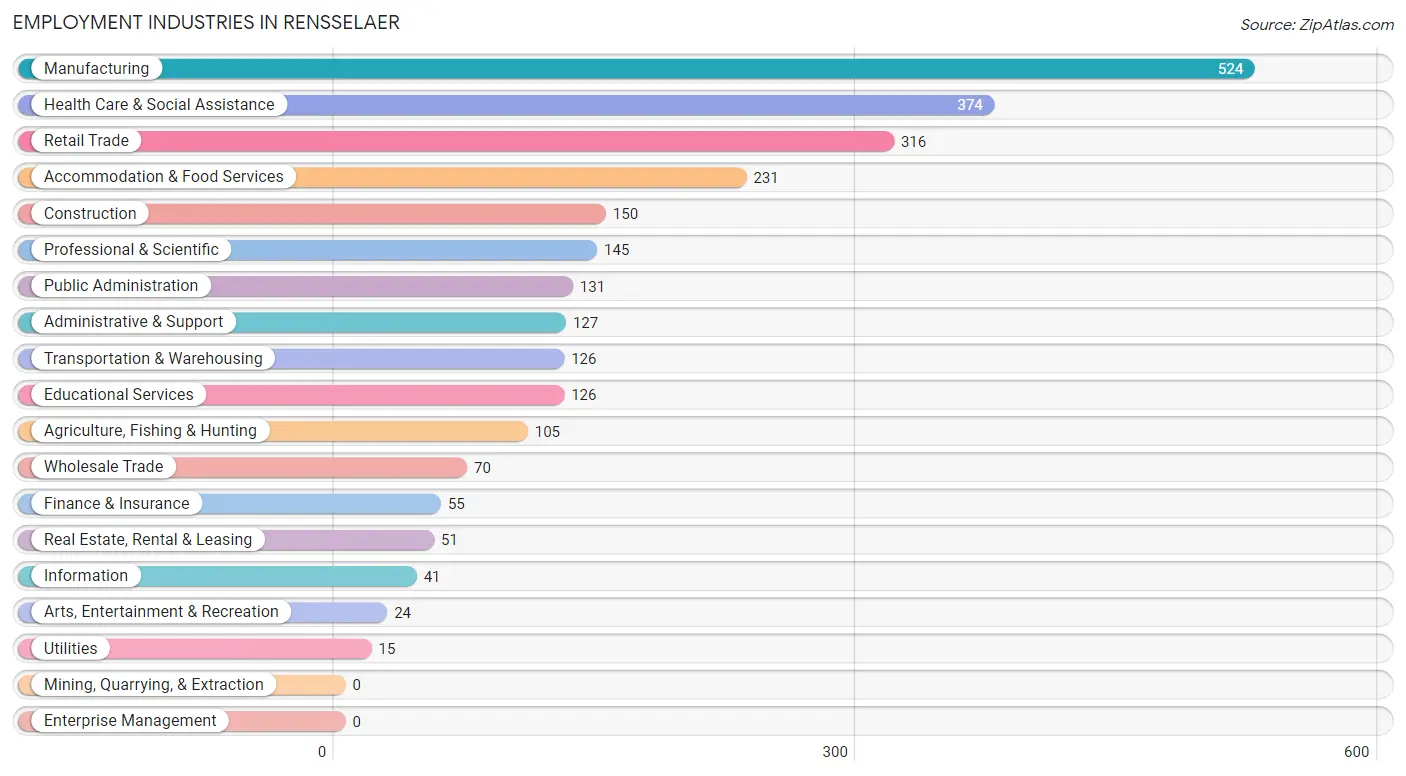
Employment Industries in Rensselaer
The major employment industries in Rensselaer include Manufacturing (524 | 19.3%), Health Care & Social Assistance (374 | 13.8%), Retail Trade (316 | 11.6%), Accommodation & Food Services (231 | 8.5%), and Construction (150 | 5.5%).
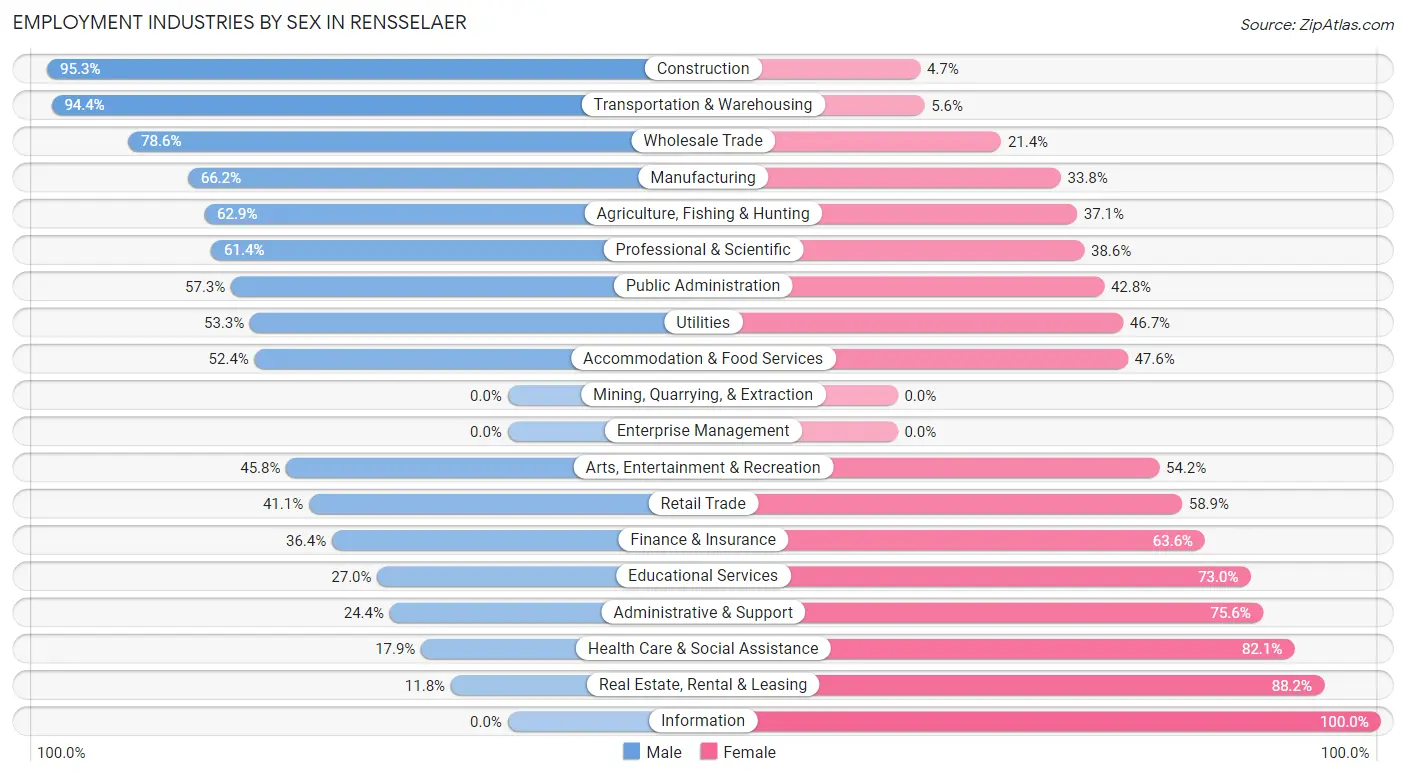
Employment Industries by Sex in Rensselaer
The Rensselaer industries that see more men than women are Construction (95.3%), Transportation & Warehousing (94.4%), and Wholesale Trade (78.6%), whereas the industries that tend to have a higher number of women are Information (100.0%), Real Estate, Rental & Leasing (88.2%), and Health Care & Social Assistance (82.1%).
| Industry | Male | Female |
| Agriculture, Fishing & Hunting | 66 (62.9%) | 39 (37.1%) |
| Mining, Quarrying, & Extraction | 0 (0.0%) | 0 (0.0%) |
| Construction | 143 (95.3%) | 7 (4.7%) |
| Manufacturing | 347 (66.2%) | 177 (33.8%) |
| Wholesale Trade | 55 (78.6%) | 15 (21.4%) |
| Retail Trade | 130 (41.1%) | 186 (58.9%) |
| Transportation & Warehousing | 119 (94.4%) | 7 (5.6%) |
| Utilities | 8 (53.3%) | 7 (46.7%) |
| Information | 0 (0.0%) | 41 (100.0%) |
| Finance & Insurance | 20 (36.4%) | 35 (63.6%) |
| Real Estate, Rental & Leasing | 6 (11.8%) | 45 (88.2%) |
| Professional & Scientific | 89 (61.4%) | 56 (38.6%) |
| Enterprise Management | 0 (0.0%) | 0 (0.0%) |
| Administrative & Support | 31 (24.4%) | 96 (75.6%) |
| Educational Services | 34 (27.0%) | 92 (73.0%) |
| Health Care & Social Assistance | 67 (17.9%) | 307 (82.1%) |
| Arts, Entertainment & Recreation | 11 (45.8%) | 13 (54.2%) |
| Accommodation & Food Services | 121 (52.4%) | 110 (47.6%) |
| Public Administration | 75 (57.3%) | 56 (42.7%) |
| Total | 1,356 (49.9%) | 1,360 (50.1%) |
Education in Rensselaer
School Enrollment in Rensselaer
The most common levels of schooling among the 1,172 students in Rensselaer are elementary school (301 | 25.7%), middle school (269 | 23.0%), and high school (239 | 20.4%).
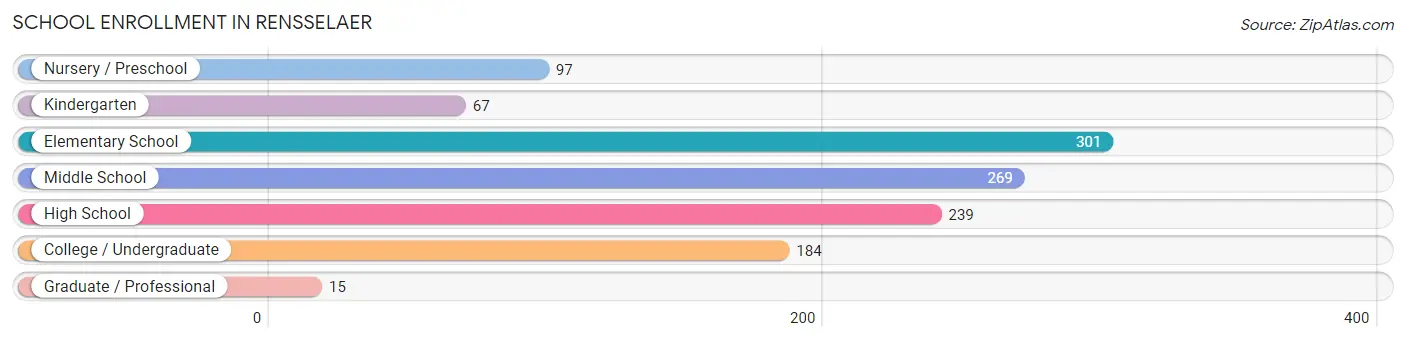
| School Level | # Students | % Students |
| Nursery / Preschool | 97 | 8.3% |
| Kindergarten | 67 | 5.7% |
| Elementary School | 301 | 25.7% |
| Middle School | 269 | 23.0% |
| High School | 239 | 20.4% |
| College / Undergraduate | 184 | 15.7% |
| Graduate / Professional | 15 | 1.3% |
| Total | 1,172 | 100.0% |
School Enrollment by Age by Funding Source in Rensselaer
Out of a total of 1,172 students who are enrolled in schools in Rensselaer, 165 (14.1%) attend a private institution, while the remaining 1,007 (85.9%) are enrolled in public schools. The age group of 20 to 24 year olds has the highest likelihood of being enrolled in private schools, with 45 (33.3% in the age bracket) enrolled. Conversely, the age group of 3 to 4 year olds has the lowest likelihood of being enrolled in a private school, with 51 (100.0% in the age bracket) attending a public institution.
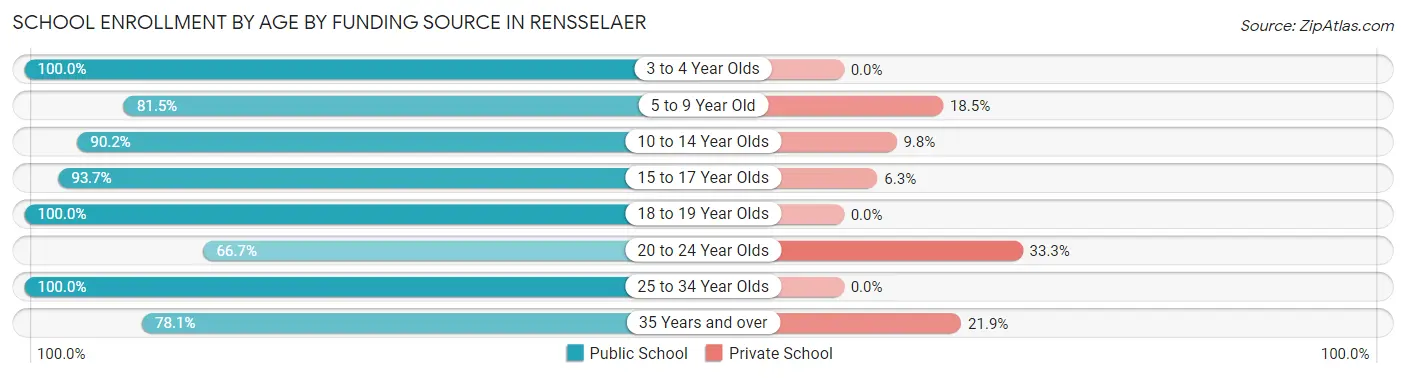
| Age Bracket | Public School | Private School |
| 3 to 4 Year Olds | 51 (100.0%) | 0 (0.0%) |
| 5 to 9 Year Old | 304 (81.5%) | 69 (18.5%) |
| 10 to 14 Year Olds | 284 (90.2%) | 31 (9.8%) |
| 15 to 17 Year Olds | 194 (93.7%) | 13 (6.3%) |
| 18 to 19 Year Olds | 33 (100.0%) | 0 (0.0%) |
| 20 to 24 Year Olds | 90 (66.7%) | 45 (33.3%) |
| 25 to 34 Year Olds | 26 (100.0%) | 0 (0.0%) |
| 35 Years and over | 25 (78.1%) | 7 (21.9%) |
| Total | 1,007 (85.9%) | 165 (14.1%) |
Educational Attainment by Field of Study in Rensselaer
Business (150 | 19.5%), social sciences (101 | 13.2%), arts & humanities (92 | 12.0%), education (88 | 11.5%), and science & technology (71 | 9.2%) are the most common fields of study among 768 individuals in Rensselaer who have obtained a bachelor's degree or higher.
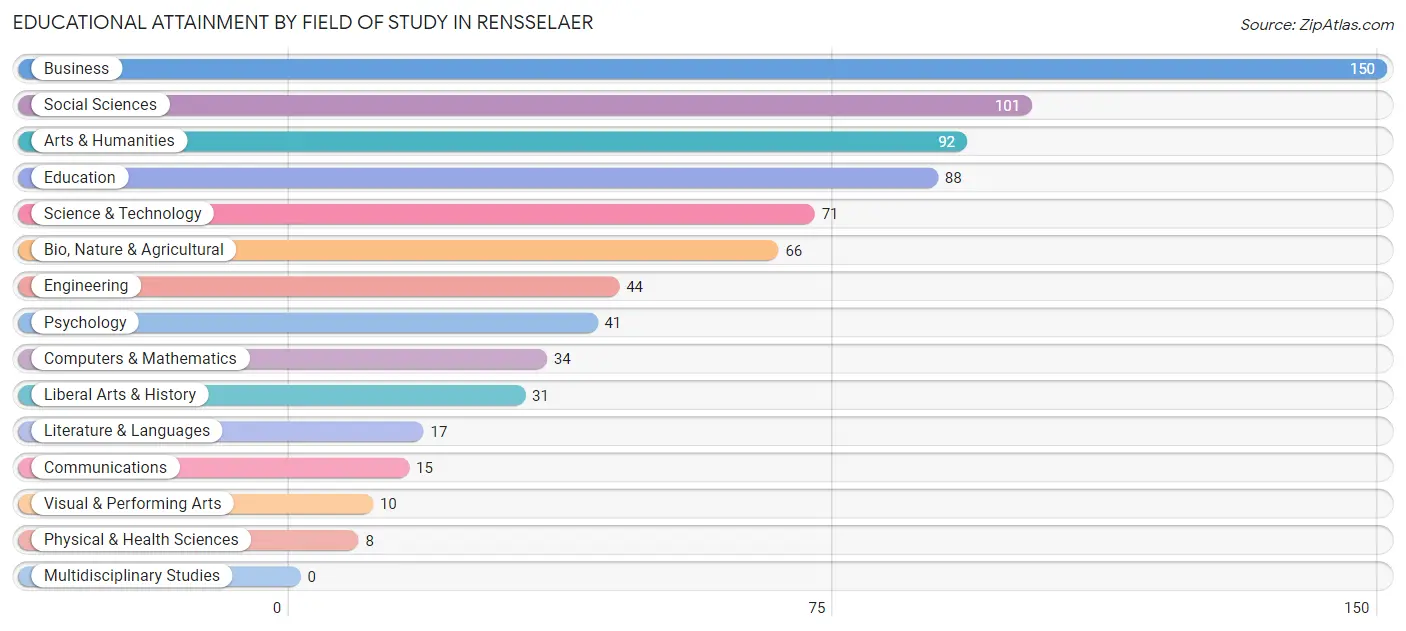
| Field of Study | # Graduates | % Graduates |
| Computers & Mathematics | 34 | 4.4% |
| Bio, Nature & Agricultural | 66 | 8.6% |
| Physical & Health Sciences | 8 | 1.0% |
| Psychology | 41 | 5.3% |
| Social Sciences | 101 | 13.2% |
| Engineering | 44 | 5.7% |
| Multidisciplinary Studies | 0 | 0.0% |
| Science & Technology | 71 | 9.2% |
| Business | 150 | 19.5% |
| Education | 88 | 11.5% |
| Literature & Languages | 17 | 2.2% |
| Liberal Arts & History | 31 | 4.0% |
| Visual & Performing Arts | 10 | 1.3% |
| Communications | 15 | 1.9% |
| Arts & Humanities | 92 | 12.0% |
| Total | 768 | 100.0% |
Transportation & Commute in Rensselaer
Vehicle Availability by Sex in Rensselaer
The most prevalent vehicle ownership categories in Rensselaer are males with 2 vehicles (570, accounting for 42.3%) and females with 2 vehicles (504, making up 42.7%).
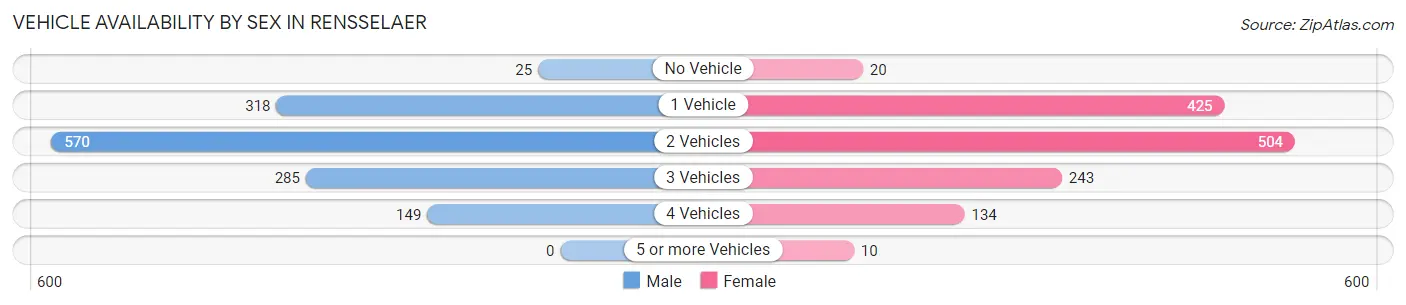
| Vehicles Available | Male | Female |
| No Vehicle | 25 (1.9%) | 20 (1.5%) |
| 1 Vehicle | 318 (23.6%) | 425 (31.8%) |
| 2 Vehicles | 570 (42.3%) | 504 (37.7%) |
| 3 Vehicles | 285 (21.2%) | 243 (18.2%) |
| 4 Vehicles | 149 (11.1%) | 134 (10.0%) |
| 5 or more Vehicles | 0 (0.0%) | 10 (0.7%) |
| Total | 1,347 (100.0%) | 1,336 (100.0%) |
Commute Time in Rensselaer
The most frequently occuring commute durations in Rensselaer are 5 to 9 minutes (819 commuters, 31.4%), less than 5 minutes (443 commuters, 17.0%), and 10 to 14 minutes (438 commuters, 16.8%).
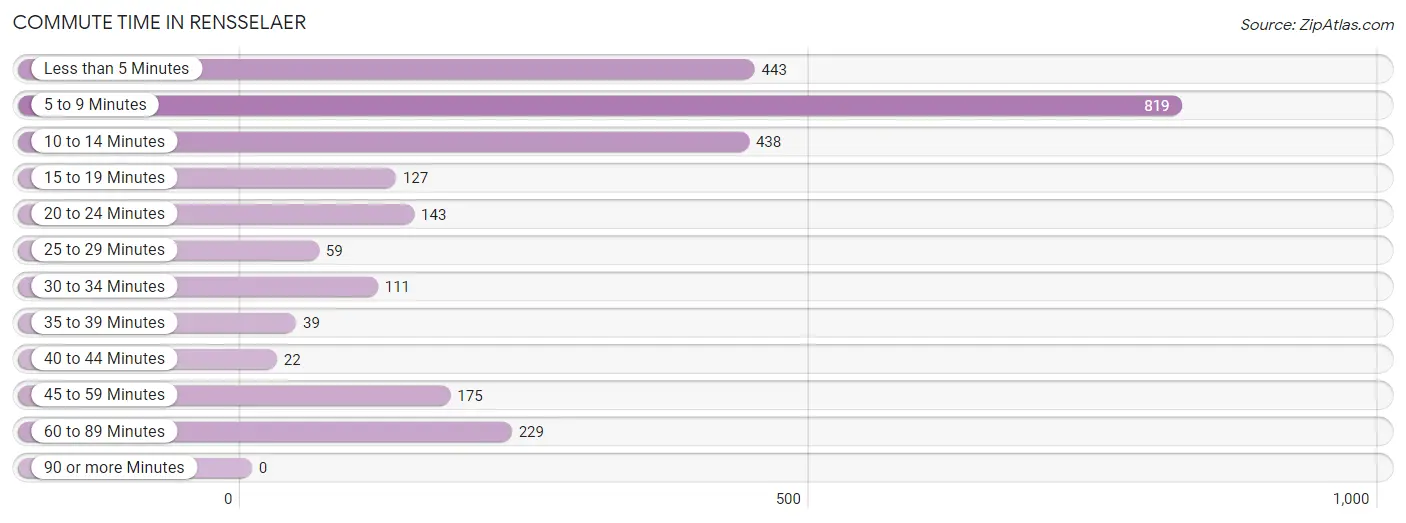
| Commute Time | # Commuters | % Commuters |
| Less than 5 Minutes | 443 | 17.0% |
| 5 to 9 Minutes | 819 | 31.4% |
| 10 to 14 Minutes | 438 | 16.8% |
| 15 to 19 Minutes | 127 | 4.9% |
| 20 to 24 Minutes | 143 | 5.5% |
| 25 to 29 Minutes | 59 | 2.3% |
| 30 to 34 Minutes | 111 | 4.3% |
| 35 to 39 Minutes | 39 | 1.5% |
| 40 to 44 Minutes | 22 | 0.8% |
| 45 to 59 Minutes | 175 | 6.7% |
| 60 to 89 Minutes | 229 | 8.8% |
| 90 or more Minutes | 0 | 0.0% |
Commute Time by Sex in Rensselaer
The most common commute times in Rensselaer are 5 to 9 minutes (345 commuters, 25.8%) for males and 5 to 9 minutes (474 commuters, 37.3%) for females.
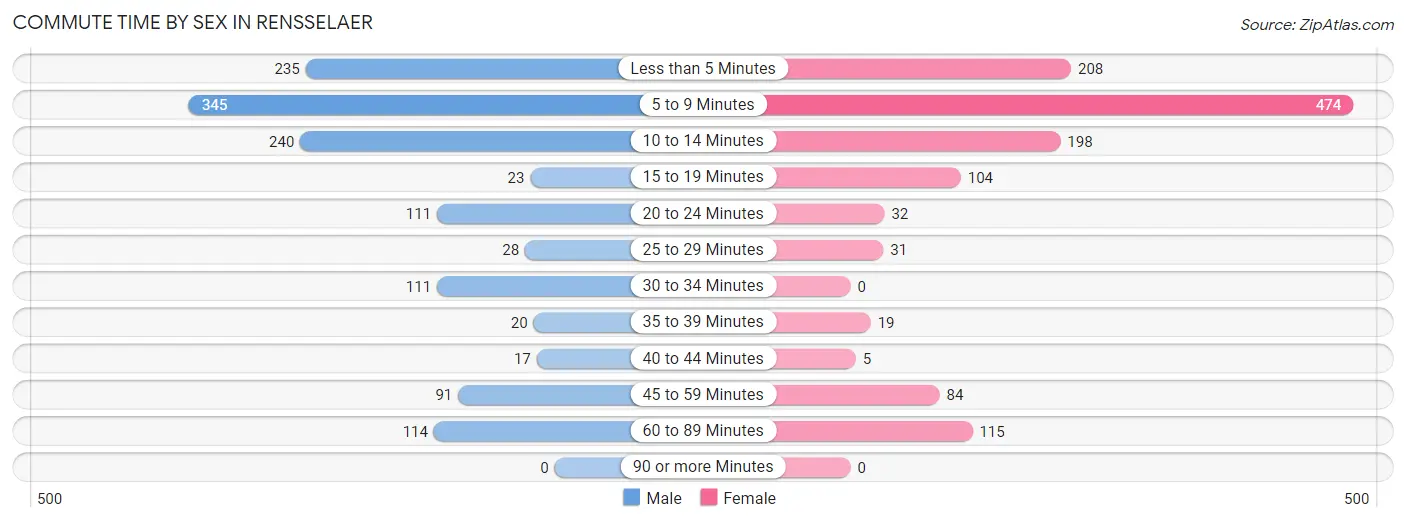
| Commute Time | Male | Female |
| Less than 5 Minutes | 235 (17.6%) | 208 (16.4%) |
| 5 to 9 Minutes | 345 (25.8%) | 474 (37.3%) |
| 10 to 14 Minutes | 240 (18.0%) | 198 (15.6%) |
| 15 to 19 Minutes | 23 (1.7%) | 104 (8.2%) |
| 20 to 24 Minutes | 111 (8.3%) | 32 (2.5%) |
| 25 to 29 Minutes | 28 (2.1%) | 31 (2.4%) |
| 30 to 34 Minutes | 111 (8.3%) | 0 (0.0%) |
| 35 to 39 Minutes | 20 (1.5%) | 19 (1.5%) |
| 40 to 44 Minutes | 17 (1.3%) | 5 (0.4%) |
| 45 to 59 Minutes | 91 (6.8%) | 84 (6.6%) |
| 60 to 89 Minutes | 114 (8.5%) | 115 (9.1%) |
| 90 or more Minutes | 0 (0.0%) | 0 (0.0%) |
Time of Departure to Work by Sex in Rensselaer
The most frequent times of departure to work in Rensselaer are 6:00 AM to 6:29 AM (197, 14.8%) for males and 7:30 AM to 7:59 AM (310, 24.4%) for females.
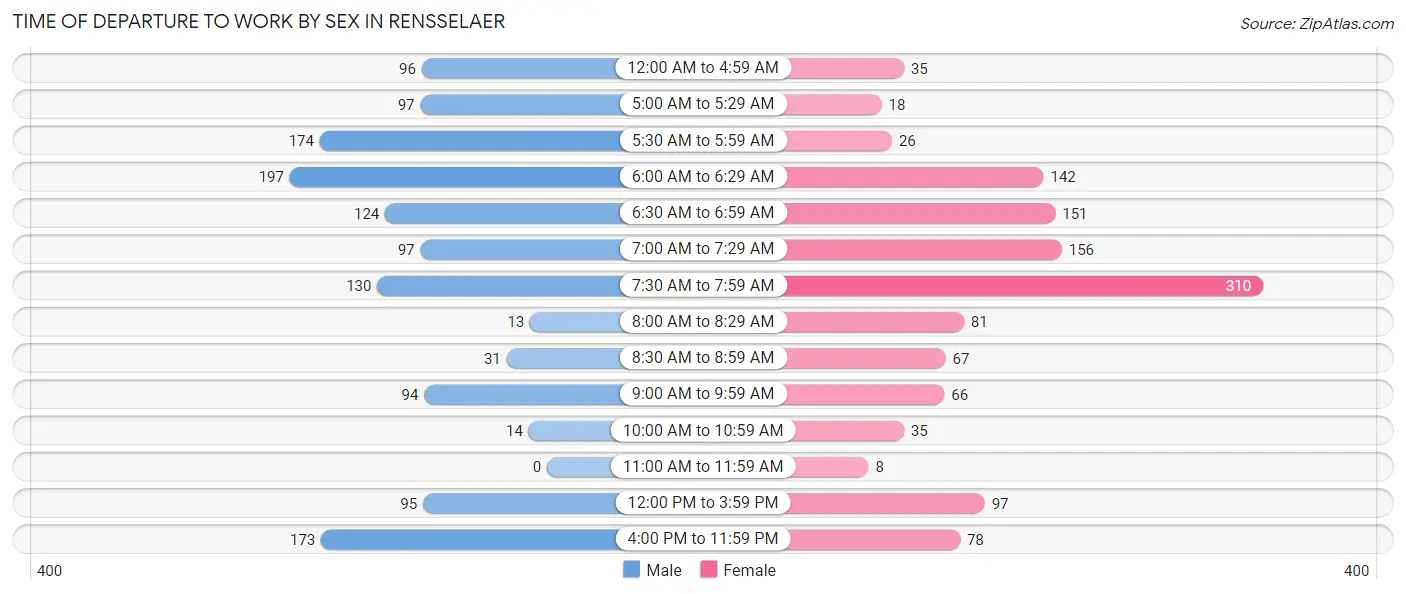
| Time of Departure | Male | Female |
| 12:00 AM to 4:59 AM | 96 (7.2%) | 35 (2.8%) |
| 5:00 AM to 5:29 AM | 97 (7.3%) | 18 (1.4%) |
| 5:30 AM to 5:59 AM | 174 (13.0%) | 26 (2.1%) |
| 6:00 AM to 6:29 AM | 197 (14.8%) | 142 (11.2%) |
| 6:30 AM to 6:59 AM | 124 (9.3%) | 151 (11.9%) |
| 7:00 AM to 7:29 AM | 97 (7.3%) | 156 (12.3%) |
| 7:30 AM to 7:59 AM | 130 (9.7%) | 310 (24.4%) |
| 8:00 AM to 8:29 AM | 13 (1.0%) | 81 (6.4%) |
| 8:30 AM to 8:59 AM | 31 (2.3%) | 67 (5.3%) |
| 9:00 AM to 9:59 AM | 94 (7.0%) | 66 (5.2%) |
| 10:00 AM to 10:59 AM | 14 (1.1%) | 35 (2.8%) |
| 11:00 AM to 11:59 AM | 0 (0.0%) | 8 (0.6%) |
| 12:00 PM to 3:59 PM | 95 (7.1%) | 97 (7.6%) |
| 4:00 PM to 11:59 PM | 173 (13.0%) | 78 (6.1%) |
| Total | 1,335 (100.0%) | 1,270 (100.0%) |
Housing Occupancy in Rensselaer
Occupancy by Ownership in Rensselaer
Of the total 2,162 dwellings in Rensselaer, owner-occupied units account for 1,373 (63.5%), while renter-occupied units make up 789 (36.5%).
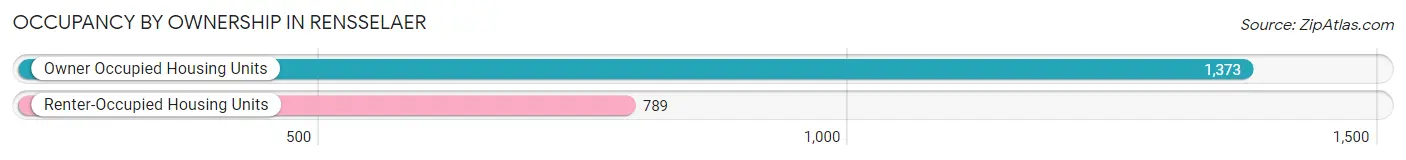
| Occupancy | # Housing Units | % Housing Units |
| Owner Occupied Housing Units | 1,373 | 63.5% |
| Renter-Occupied Housing Units | 789 | 36.5% |
| Total Occupied Housing Units | 2,162 | 100.0% |
Occupancy by Household Size in Rensselaer
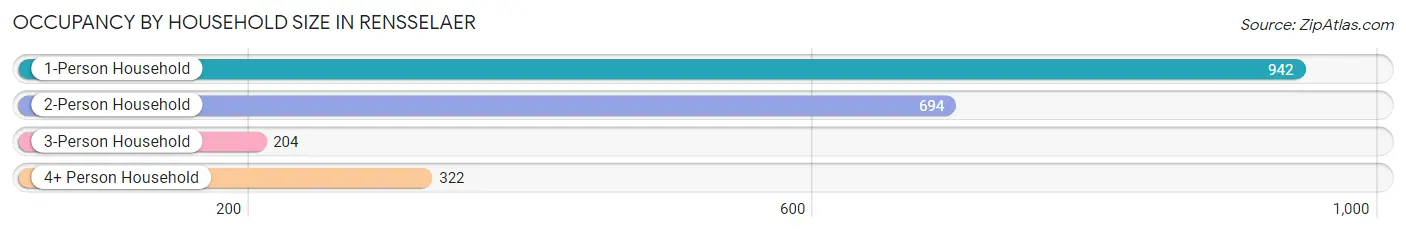
| Household Size | # Housing Units | % Housing Units |
| 1-Person Household | 942 | 43.6% |
| 2-Person Household | 694 | 32.1% |
| 3-Person Household | 204 | 9.4% |
| 4+ Person Household | 322 | 14.9% |
| Total Housing Units | 2,162 | 100.0% |
Occupancy by Ownership by Household Size in Rensselaer
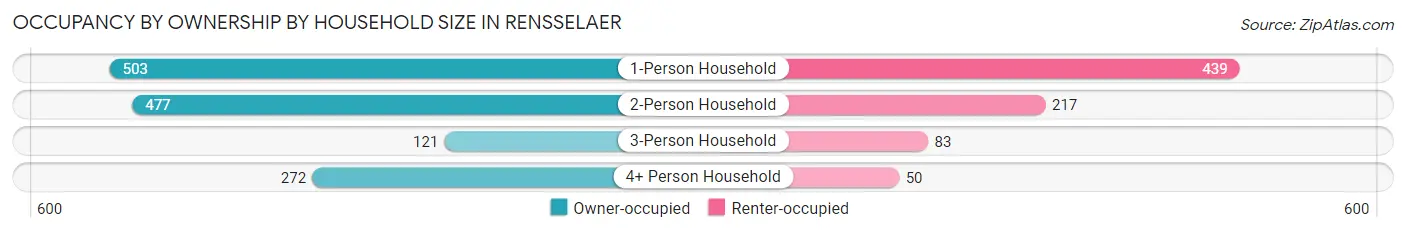
| Household Size | Owner-occupied | Renter-occupied |
| 1-Person Household | 503 (53.4%) | 439 (46.6%) |
| 2-Person Household | 477 (68.7%) | 217 (31.3%) |
| 3-Person Household | 121 (59.3%) | 83 (40.7%) |
| 4+ Person Household | 272 (84.5%) | 50 (15.5%) |
| Total Housing Units | 1,373 (63.5%) | 789 (36.5%) |
Occupancy by Educational Attainment in Rensselaer
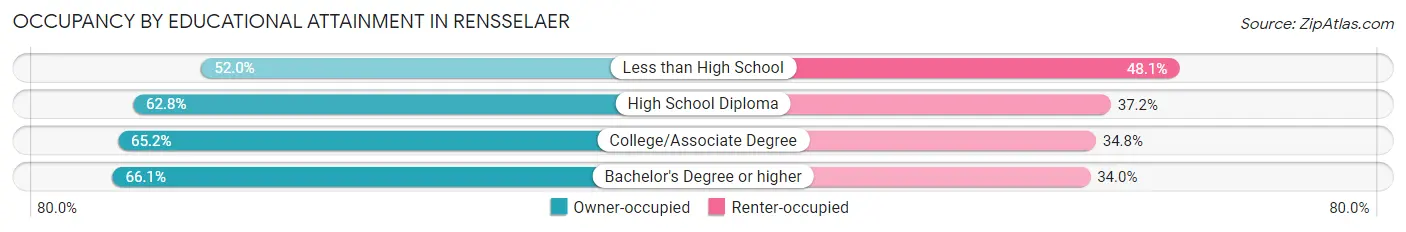
| Household Size | Owner-occupied | Renter-occupied |
| Less than High School | 80 (51.9%) | 74 (48.0%) |
| High School Diploma | 513 (62.8%) | 304 (37.2%) |
| College/Associate Degree | 494 (65.2%) | 264 (34.8%) |
| Bachelor's Degree or higher | 286 (66.0%) | 147 (34.0%) |
Occupancy by Age of Householder in Rensselaer
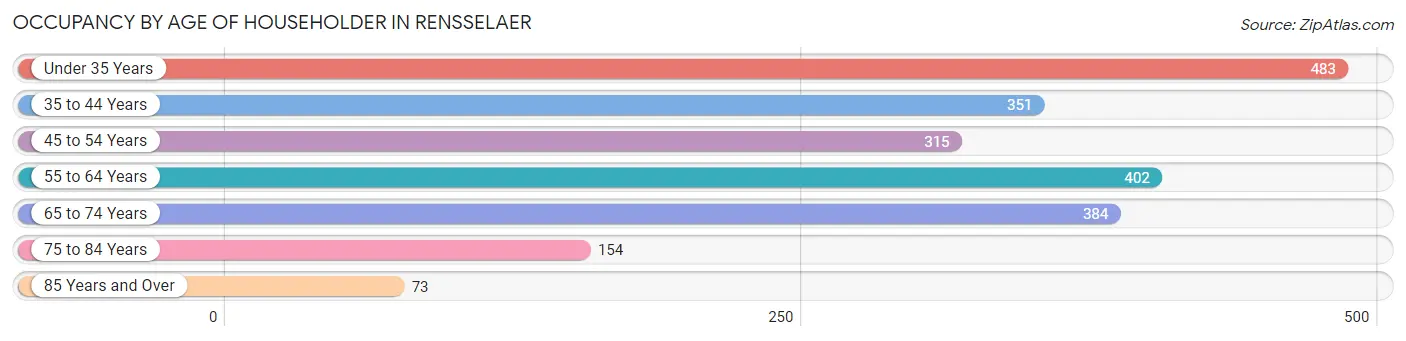
| Age Bracket | # Households | % Households |
| Under 35 Years | 483 | 22.3% |
| 35 to 44 Years | 351 | 16.2% |
| 45 to 54 Years | 315 | 14.6% |
| 55 to 64 Years | 402 | 18.6% |
| 65 to 74 Years | 384 | 17.8% |
| 75 to 84 Years | 154 | 7.1% |
| 85 Years and Over | 73 | 3.4% |
| Total | 2,162 | 100.0% |
Housing Finances in Rensselaer
Median Income by Occupancy in Rensselaer
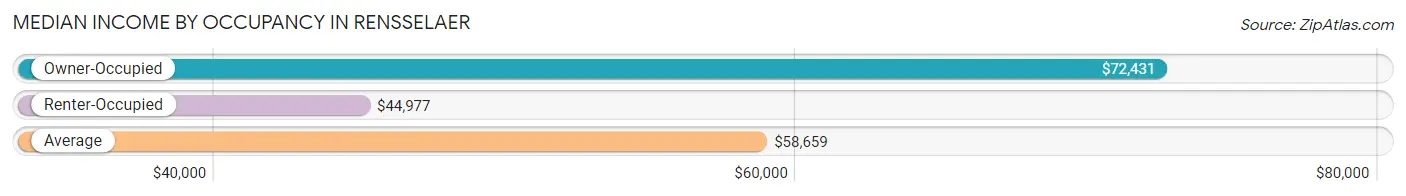
| Occupancy Type | # Households | Median Income |
| Owner-Occupied | 1,373 (63.5%) | $72,431 |
| Renter-Occupied | 789 (36.5%) | $44,977 |
| Average | 2,162 (100.0%) | $58,659 |
Occupancy by Householder Income Bracket in Rensselaer
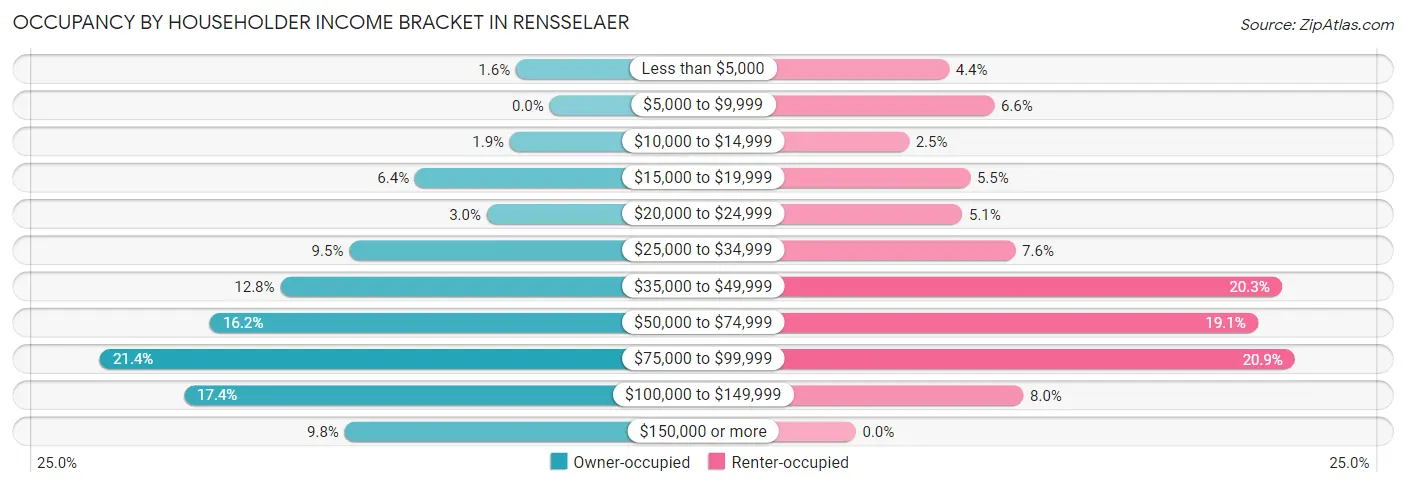
| Income Bracket | Owner-occupied | Renter-occupied |
| Less than $5,000 | 22 (1.6%) | 35 (4.4%) |
| $5,000 to $9,999 | 0 (0.0%) | 52 (6.6%) |
| $10,000 to $14,999 | 26 (1.9%) | 20 (2.5%) |
| $15,000 to $19,999 | 88 (6.4%) | 43 (5.4%) |
| $20,000 to $24,999 | 41 (3.0%) | 40 (5.1%) |
| $25,000 to $34,999 | 131 (9.5%) | 60 (7.6%) |
| $35,000 to $49,999 | 176 (12.8%) | 160 (20.3%) |
| $50,000 to $74,999 | 222 (16.2%) | 151 (19.1%) |
| $75,000 to $99,999 | 294 (21.4%) | 165 (20.9%) |
| $100,000 to $149,999 | 239 (17.4%) | 63 (8.0%) |
| $150,000 or more | 134 (9.8%) | 0 (0.0%) |
| Total | 1,373 (100.0%) | 789 (100.0%) |
Monthly Housing Cost Tiers in Rensselaer
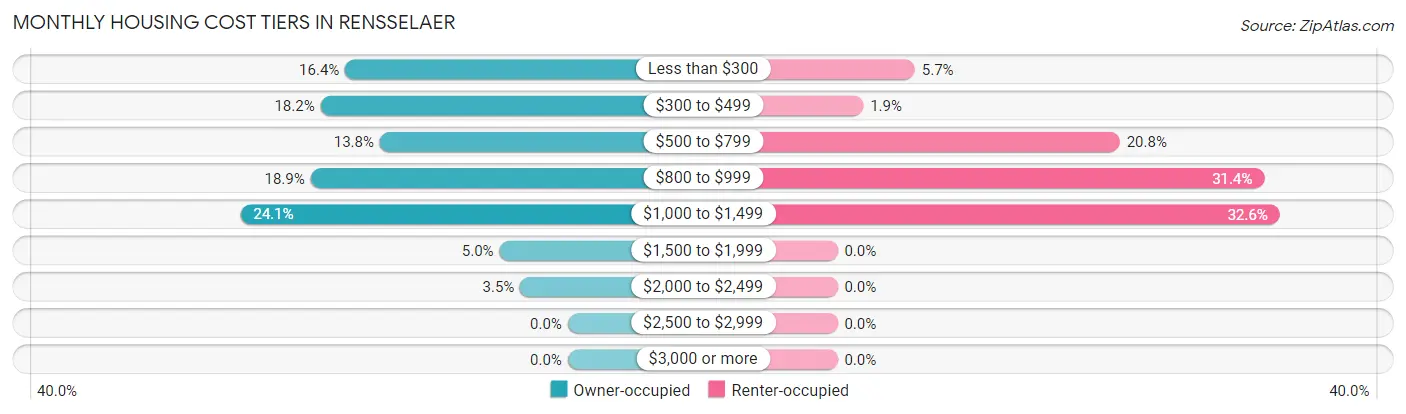
| Monthly Cost | Owner-occupied | Renter-occupied |
| Less than $300 | 225 (16.4%) | 45 (5.7%) |
| $300 to $499 | 250 (18.2%) | 15 (1.9%) |
| $500 to $799 | 190 (13.8%) | 164 (20.8%) |
| $800 to $999 | 260 (18.9%) | 248 (31.4%) |
| $1,000 to $1,499 | 331 (24.1%) | 257 (32.6%) |
| $1,500 to $1,999 | 69 (5.0%) | 0 (0.0%) |
| $2,000 to $2,499 | 48 (3.5%) | 0 (0.0%) |
| $2,500 to $2,999 | 0 (0.0%) | 0 (0.0%) |
| $3,000 or more | 0 (0.0%) | 0 (0.0%) |
| Total | 1,373 (100.0%) | 789 (100.0%) |
Physical Housing Characteristics in Rensselaer
Housing Structures in Rensselaer
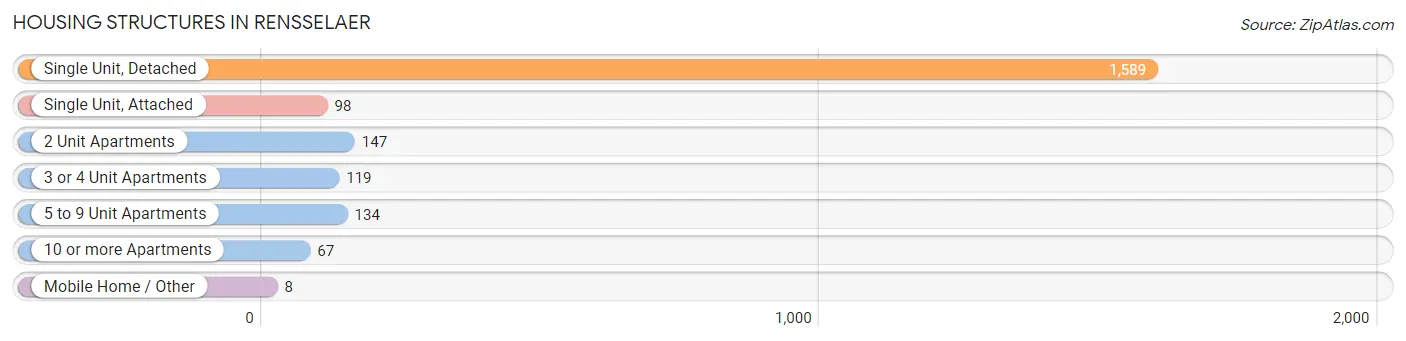
| Structure Type | # Housing Units | % Housing Units |
| Single Unit, Detached | 1,589 | 73.5% |
| Single Unit, Attached | 98 | 4.5% |
| 2 Unit Apartments | 147 | 6.8% |
| 3 or 4 Unit Apartments | 119 | 5.5% |
| 5 to 9 Unit Apartments | 134 | 6.2% |
| 10 or more Apartments | 67 | 3.1% |
| Mobile Home / Other | 8 | 0.4% |
| Total | 2,162 | 100.0% |
Housing Structures by Occupancy in Rensselaer
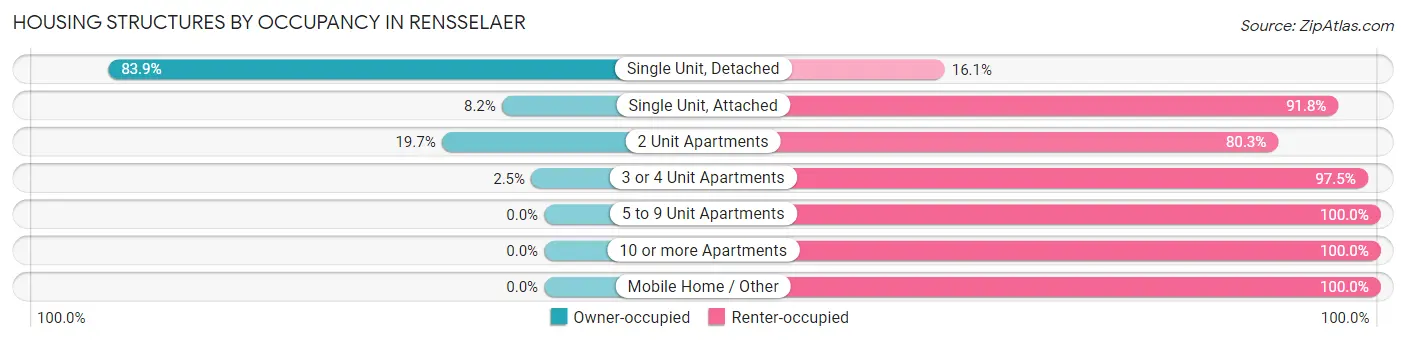
| Structure Type | Owner-occupied | Renter-occupied |
| Single Unit, Detached | 1,333 (83.9%) | 256 (16.1%) |
| Single Unit, Attached | 8 (8.2%) | 90 (91.8%) |
| 2 Unit Apartments | 29 (19.7%) | 118 (80.3%) |
| 3 or 4 Unit Apartments | 3 (2.5%) | 116 (97.5%) |
| 5 to 9 Unit Apartments | 0 (0.0%) | 134 (100.0%) |
| 10 or more Apartments | 0 (0.0%) | 67 (100.0%) |
| Mobile Home / Other | 0 (0.0%) | 8 (100.0%) |
| Total | 1,373 (63.5%) | 789 (36.5%) |
Housing Structures by Number of Rooms in Rensselaer
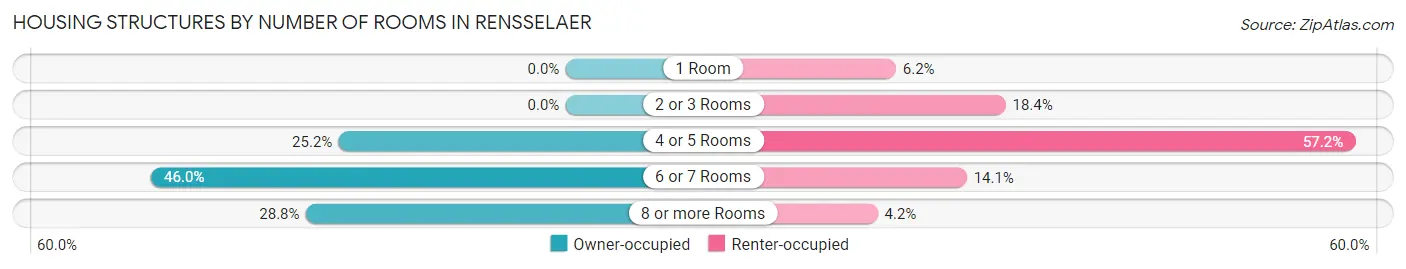
| Number of Rooms | Owner-occupied | Renter-occupied |
| 1 Room | 0 (0.0%) | 49 (6.2%) |
| 2 or 3 Rooms | 0 (0.0%) | 145 (18.4%) |
| 4 or 5 Rooms | 346 (25.2%) | 451 (57.2%) |
| 6 or 7 Rooms | 631 (46.0%) | 111 (14.1%) |
| 8 or more Rooms | 396 (28.8%) | 33 (4.2%) |
| Total | 1,373 (100.0%) | 789 (100.0%) |
Housing Structure by Heating Type in Rensselaer
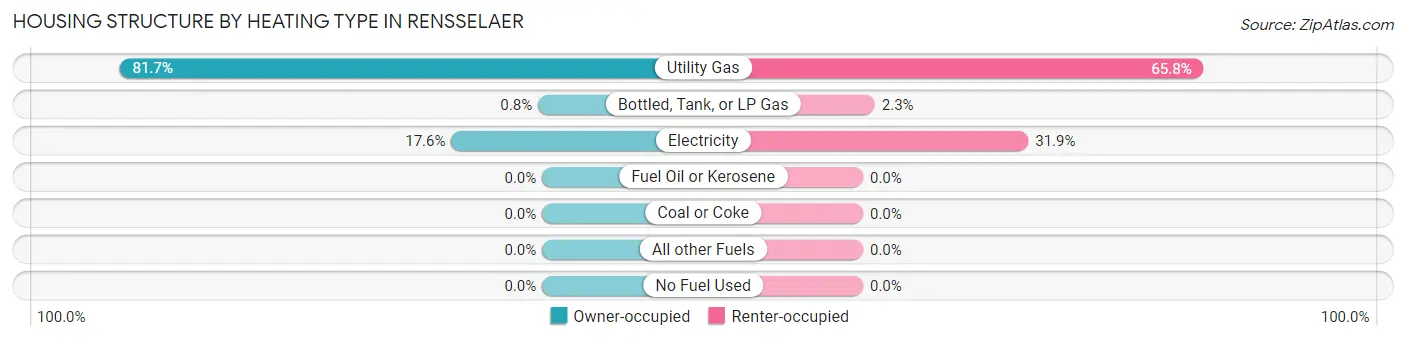
| Heating Type | Owner-occupied | Renter-occupied |
| Utility Gas | 1,121 (81.7%) | 519 (65.8%) |
| Bottled, Tank, or LP Gas | 11 (0.8%) | 18 (2.3%) |
| Electricity | 241 (17.5%) | 252 (31.9%) |
| Fuel Oil or Kerosene | 0 (0.0%) | 0 (0.0%) |
| Coal or Coke | 0 (0.0%) | 0 (0.0%) |
| All other Fuels | 0 (0.0%) | 0 (0.0%) |
| No Fuel Used | 0 (0.0%) | 0 (0.0%) |
| Total | 1,373 (100.0%) | 789 (100.0%) |
Household Vehicle Usage in Rensselaer
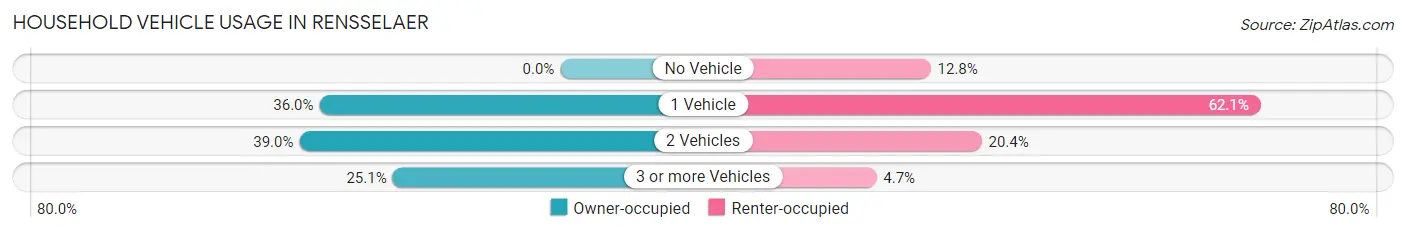
| Vehicles per Household | Owner-occupied | Renter-occupied |
| No Vehicle | 0 (0.0%) | 101 (12.8%) |
| 1 Vehicle | 494 (36.0%) | 490 (62.1%) |
| 2 Vehicles | 535 (39.0%) | 161 (20.4%) |
| 3 or more Vehicles | 344 (25.1%) | 37 (4.7%) |
| Total | 1,373 (100.0%) | 789 (100.0%) |
Real Estate & Mortgages in Rensselaer
Real Estate and Mortgage Overview in Rensselaer
| Characteristic | Without Mortgage | With Mortgage |
| Housing Units | 538 | 835 |
| Median Property Value | $128,900 | $129,200 |
| Median Household Income | $52,105 | $134 |
| Monthly Housing Costs | $356 | $0 |
| Real Estate Taxes | $543 | $3 |
Property Value by Mortgage Status in Rensselaer
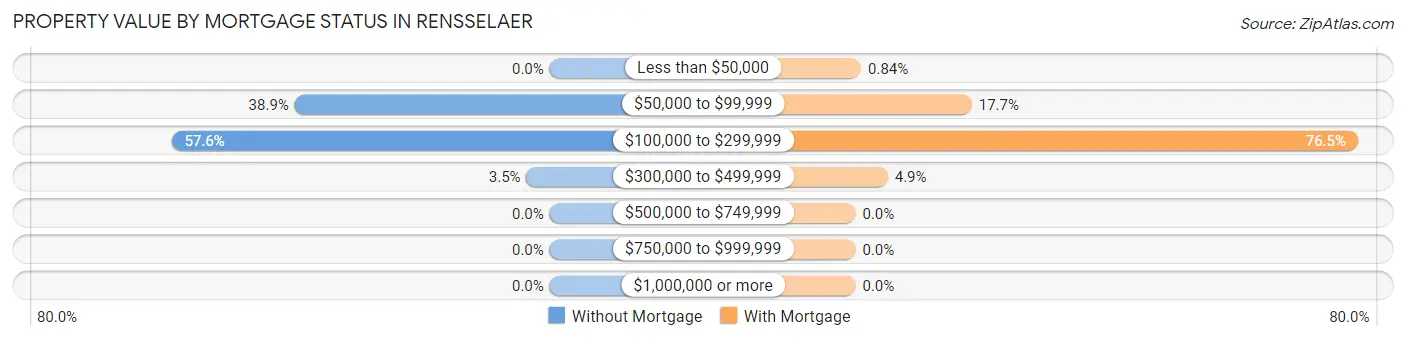
| Property Value | Without Mortgage | With Mortgage |
| Less than $50,000 | 0 (0.0%) | 7 (0.8%) |
| $50,000 to $99,999 | 209 (38.9%) | 148 (17.7%) |
| $100,000 to $299,999 | 310 (57.6%) | 639 (76.5%) |
| $300,000 to $499,999 | 19 (3.5%) | 41 (4.9%) |
| $500,000 to $749,999 | 0 (0.0%) | 0 (0.0%) |
| $750,000 to $999,999 | 0 (0.0%) | 0 (0.0%) |
| $1,000,000 or more | 0 (0.0%) | 0 (0.0%) |
| Total | 538 (100.0%) | 835 (100.0%) |
Household Income by Mortgage Status in Rensselaer
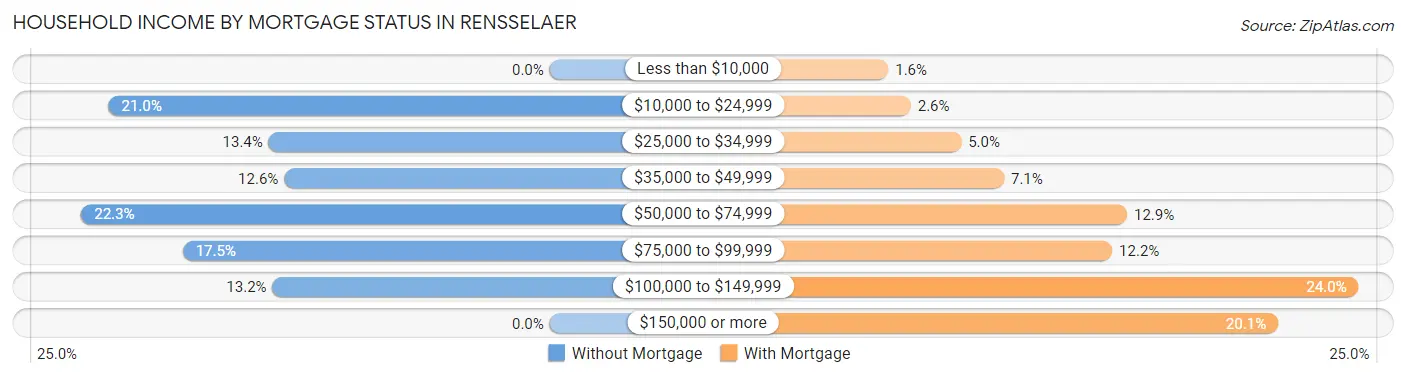
| Household Income | Without Mortgage | With Mortgage |
| Less than $10,000 | 0 (0.0%) | 13 (1.6%) |
| $10,000 to $24,999 | 113 (21.0%) | 22 (2.6%) |
| $25,000 to $34,999 | 72 (13.4%) | 42 (5.0%) |
| $35,000 to $49,999 | 68 (12.6%) | 59 (7.1%) |
| $50,000 to $74,999 | 120 (22.3%) | 108 (12.9%) |
| $75,000 to $99,999 | 94 (17.5%) | 102 (12.2%) |
| $100,000 to $149,999 | 71 (13.2%) | 200 (23.9%) |
| $150,000 or more | 0 (0.0%) | 168 (20.1%) |
| Total | 538 (100.0%) | 835 (100.0%) |
Property Value to Household Income Ratio in Rensselaer
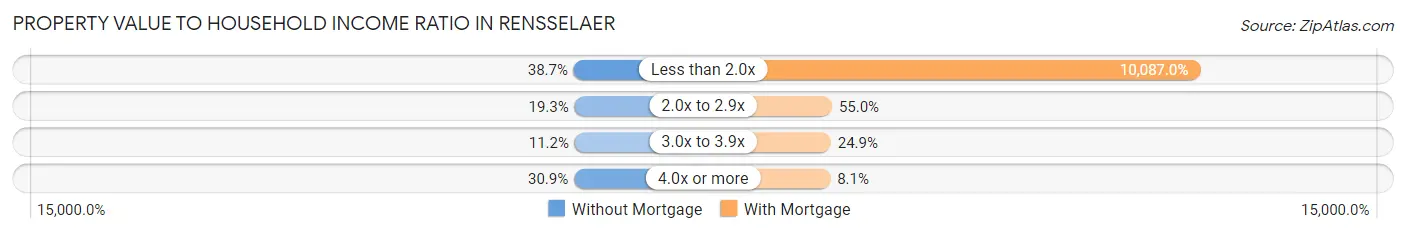
| Value-to-Income Ratio | Without Mortgage | With Mortgage |
| Less than 2.0x | 208 (38.7%) | 84,226 (10,087.0%) |
| 2.0x to 2.9x | 104 (19.3%) | 459 (55.0%) |
| 3.0x to 3.9x | 60 (11.2%) | 208 (24.9%) |
| 4.0x or more | 166 (30.9%) | 68 (8.1%) |
| Total | 538 (100.0%) | 835 (100.0%) |
Real Estate Taxes by Mortgage Status in Rensselaer
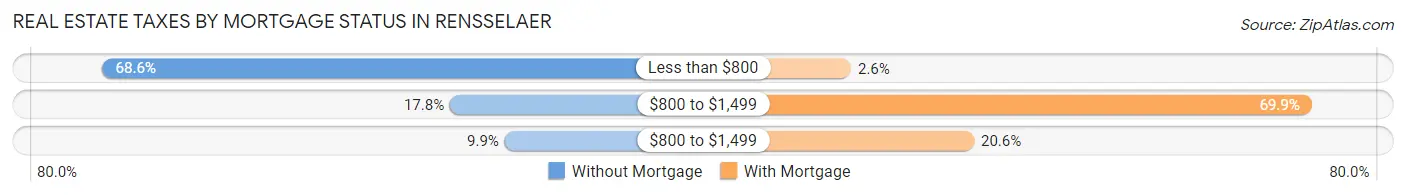
| Property Taxes | Without Mortgage | With Mortgage |
| Less than $800 | 369 (68.6%) | 22 (2.6%) |
| $800 to $1,499 | 96 (17.8%) | 584 (69.9%) |
| $800 to $1,499 | 53 (9.9%) | 172 (20.6%) |
| Total | 538 (100.0%) | 835 (100.0%) |
Health & Disability in Rensselaer
Health Insurance Coverage by Age in Rensselaer
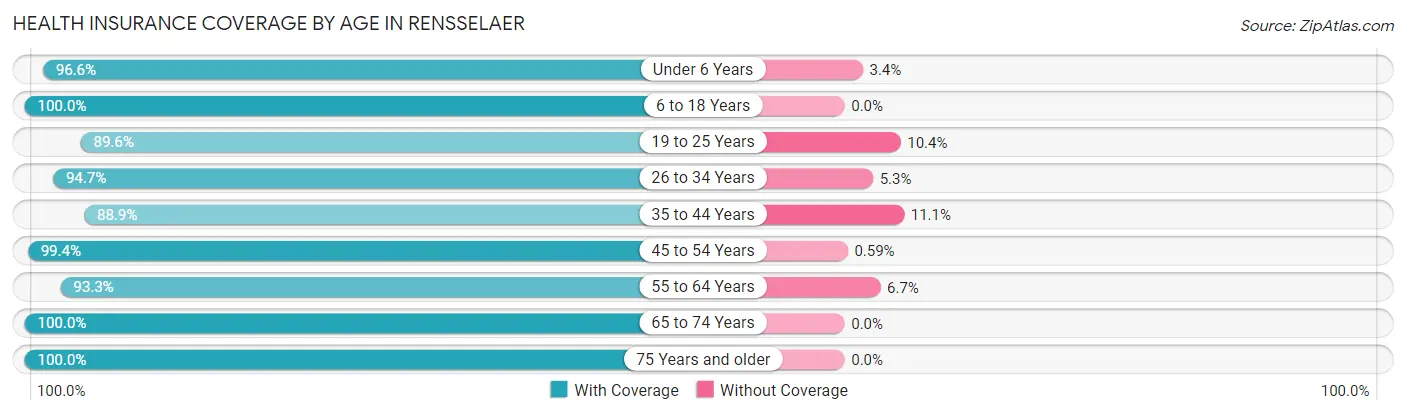
| Age Bracket | With Coverage | Without Coverage |
| Under 6 Years | 313 (96.6%) | 11 (3.4%) |
| 6 to 18 Years | 902 (100.0%) | 0 (0.0%) |
| 19 to 25 Years | 506 (89.6%) | 59 (10.4%) |
| 26 to 34 Years | 625 (94.7%) | 35 (5.3%) |
| 35 to 44 Years | 473 (88.9%) | 59 (11.1%) |
| 45 to 54 Years | 674 (99.4%) | 4 (0.6%) |
| 55 to 64 Years | 517 (93.3%) | 37 (6.7%) |
| 65 to 74 Years | 561 (100.0%) | 0 (0.0%) |
| 75 Years and older | 349 (100.0%) | 0 (0.0%) |
| Total | 4,920 (96.0%) | 205 (4.0%) |
Health Insurance Coverage by Citizenship Status in Rensselaer
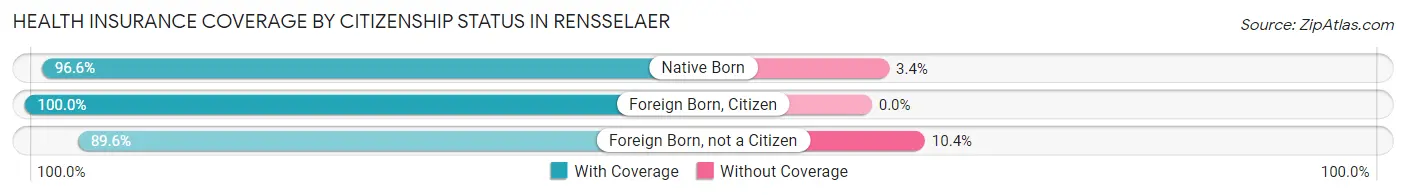
| Citizenship Status | With Coverage | Without Coverage |
| Native Born | 313 (96.6%) | 11 (3.4%) |
| Foreign Born, Citizen | 902 (100.0%) | 0 (0.0%) |
| Foreign Born, not a Citizen | 506 (89.6%) | 59 (10.4%) |
Health Insurance Coverage by Household Income in Rensselaer
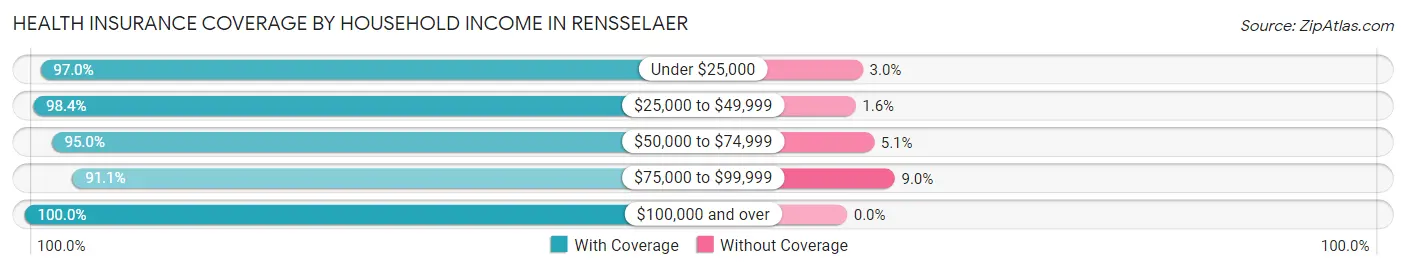
| Household Income | With Coverage | Without Coverage |
| Under $25,000 | 426 (97.0%) | 13 (3.0%) |
| $25,000 to $49,999 | 975 (98.4%) | 16 (1.6%) |
| $50,000 to $74,999 | 865 (95.0%) | 46 (5.1%) |
| $75,000 to $99,999 | 1,322 (91.0%) | 130 (8.9%) |
| $100,000 and over | 1,332 (100.0%) | 0 (0.0%) |
Public vs Private Health Insurance Coverage by Age in Rensselaer
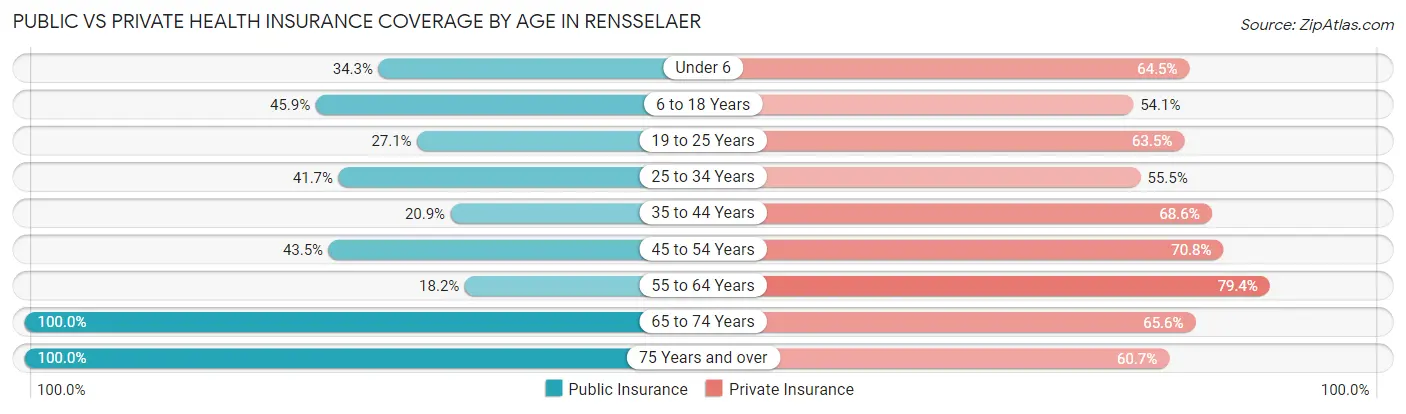
| Age Bracket | Public Insurance | Private Insurance |
| Under 6 | 111 (34.3%) | 209 (64.5%) |
| 6 to 18 Years | 414 (45.9%) | 488 (54.1%) |
| 19 to 25 Years | 153 (27.1%) | 359 (63.5%) |
| 25 to 34 Years | 275 (41.7%) | 366 (55.4%) |
| 35 to 44 Years | 111 (20.9%) | 365 (68.6%) |
| 45 to 54 Years | 295 (43.5%) | 480 (70.8%) |
| 55 to 64 Years | 101 (18.2%) | 440 (79.4%) |
| 65 to 74 Years | 561 (100.0%) | 368 (65.6%) |
| 75 Years and over | 349 (100.0%) | 212 (60.7%) |
| Total | 2,370 (46.2%) | 3,287 (64.1%) |
Disability Status by Sex by Age in Rensselaer
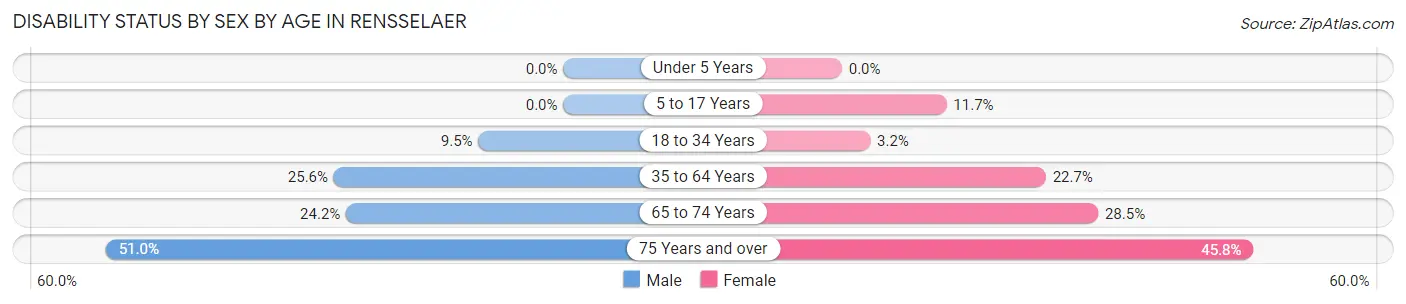
| Age Bracket | Male | Female |
| Under 5 Years | 0 (0.0%) | 0 (0.0%) |
| 5 to 17 Years | 0 (0.0%) | 58 (11.7%) |
| 18 to 34 Years | 61 (9.5%) | 20 (3.2%) |
| 35 to 64 Years | 228 (25.6%) | 198 (22.7%) |
| 65 to 74 Years | 45 (24.2%) | 107 (28.5%) |
| 75 Years and over | 80 (51.0%) | 88 (45.8%) |
Disability Class by Sex by Age in Rensselaer
Disability Class: Hearing Difficulty
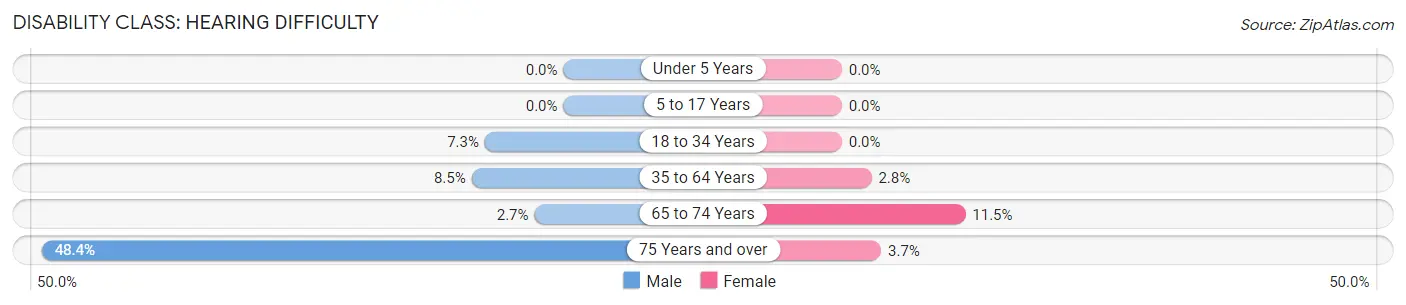
| Age Bracket | Male | Female |
| Under 5 Years | 0 (0.0%) | 0 (0.0%) |
| 5 to 17 Years | 0 (0.0%) | 0 (0.0%) |
| 18 to 34 Years | 47 (7.3%) | 0 (0.0%) |
| 35 to 64 Years | 76 (8.5%) | 24 (2.8%) |
| 65 to 74 Years | 5 (2.7%) | 43 (11.5%) |
| 75 Years and over | 76 (48.4%) | 7 (3.6%) |
Disability Class: Vision Difficulty
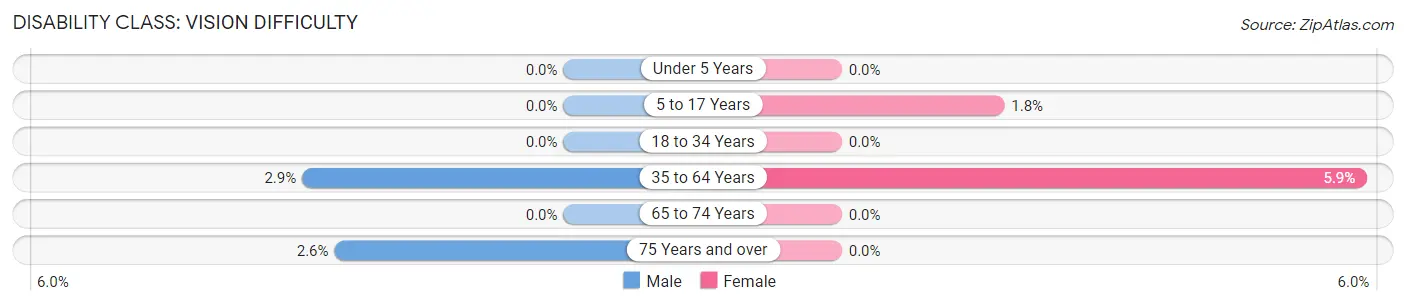
| Age Bracket | Male | Female |
| Under 5 Years | 0 (0.0%) | 0 (0.0%) |
| 5 to 17 Years | 0 (0.0%) | 9 (1.8%) |
| 18 to 34 Years | 0 (0.0%) | 0 (0.0%) |
| 35 to 64 Years | 26 (2.9%) | 51 (5.9%) |
| 65 to 74 Years | 0 (0.0%) | 0 (0.0%) |
| 75 Years and over | 4 (2.5%) | 0 (0.0%) |
Disability Class: Cognitive Difficulty
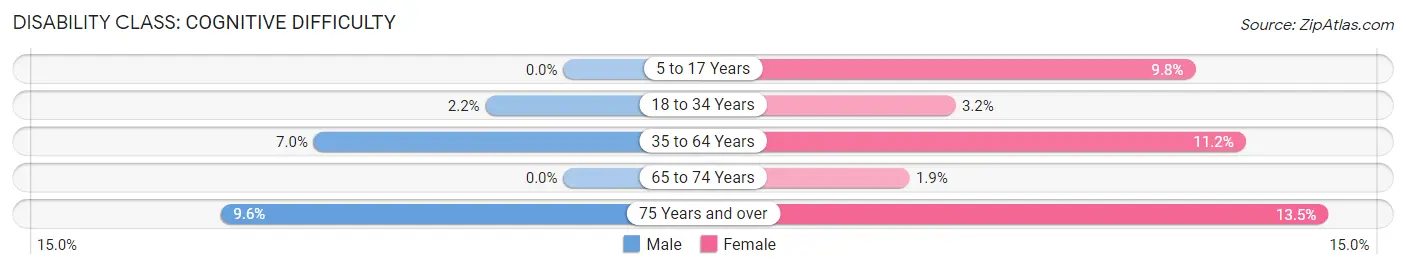
| Age Bracket | Male | Female |
| 5 to 17 Years | 0 (0.0%) | 49 (9.8%) |
| 18 to 34 Years | 14 (2.2%) | 20 (3.2%) |
| 35 to 64 Years | 62 (7.0%) | 98 (11.2%) |
| 65 to 74 Years | 0 (0.0%) | 7 (1.9%) |
| 75 Years and over | 15 (9.6%) | 26 (13.5%) |
Disability Class: Ambulatory Difficulty
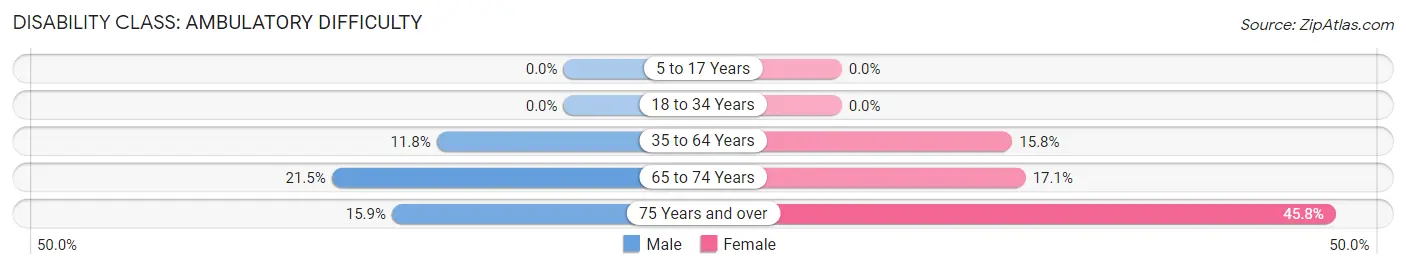
| Age Bracket | Male | Female |
| 5 to 17 Years | 0 (0.0%) | 0 (0.0%) |
| 18 to 34 Years | 0 (0.0%) | 0 (0.0%) |
| 35 to 64 Years | 105 (11.8%) | 138 (15.8%) |
| 65 to 74 Years | 40 (21.5%) | 64 (17.1%) |
| 75 Years and over | 25 (15.9%) | 88 (45.8%) |
Disability Class: Self-Care Difficulty
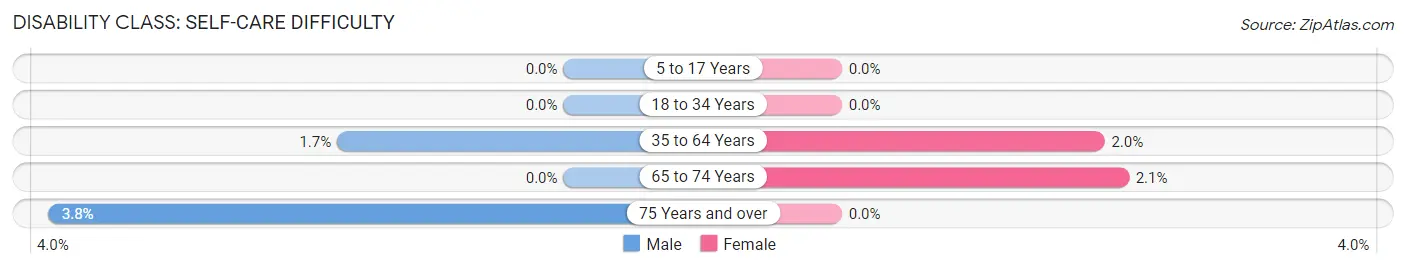
| Age Bracket | Male | Female |
| 5 to 17 Years | 0 (0.0%) | 0 (0.0%) |
| 18 to 34 Years | 0 (0.0%) | 0 (0.0%) |
| 35 to 64 Years | 15 (1.7%) | 17 (1.9%) |
| 65 to 74 Years | 0 (0.0%) | 8 (2.1%) |
| 75 Years and over | 6 (3.8%) | 0 (0.0%) |
Technology Access in Rensselaer
Computing Device Access in Rensselaer
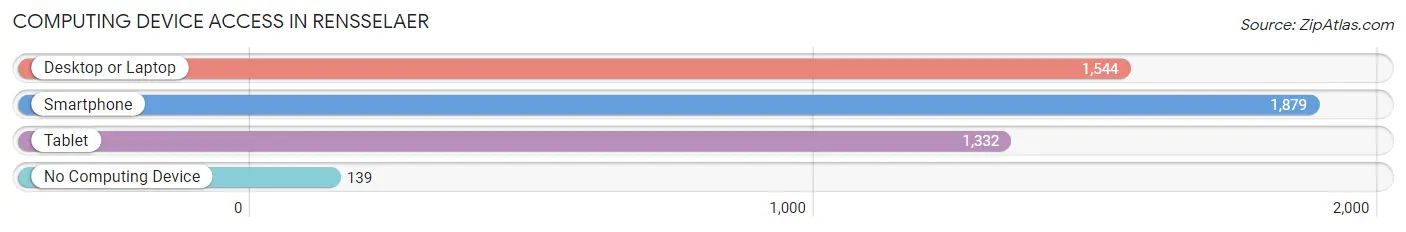
| Device Type | # Households | % Households |
| Desktop or Laptop | 1,544 | 71.4% |
| Smartphone | 1,879 | 86.9% |
| Tablet | 1,332 | 61.6% |
| No Computing Device | 139 | 6.4% |
| Total | 2,162 | 100.0% |
Internet Access in Rensselaer
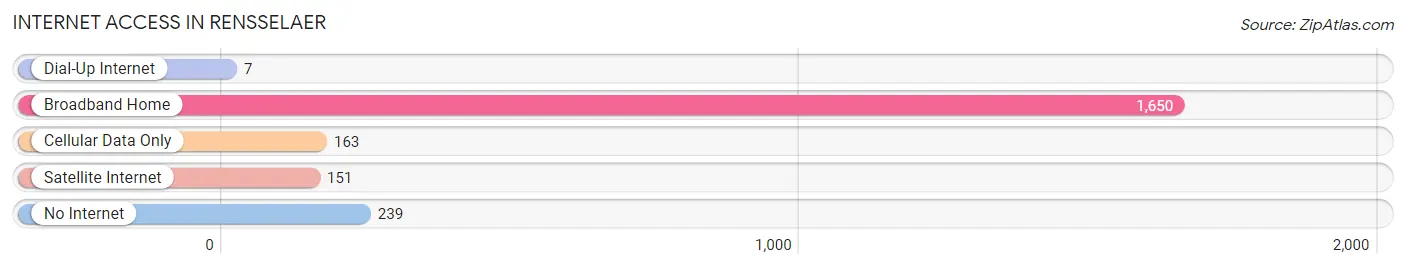
| Internet Type | # Households | % Households |
| Dial-Up Internet | 7 | 0.3% |
| Broadband Home | 1,650 | 76.3% |
| Cellular Data Only | 163 | 7.5% |
| Satellite Internet | 151 | 7.0% |
| No Internet | 239 | 11.1% |
| Total | 2,162 | 100.0% |
Rensselaer Summary
Rensselaer, Indiana is a small city located in Jasper County, Indiana. It is situated on the banks of the Iroquois River, about 40 miles north of Indianapolis. The city has a population of 5,859 people, according to the 2010 census.
History
Rensselaer was founded in 1837 by a group of settlers from New York. The city was named after the Rensselaer family, who were prominent in the area. The city was incorporated in 1851 and has since grown to become the largest city in Jasper County.
The city was an important stop on the Wabash and Erie Canal, which was built in the 1840s. The canal was used to transport goods and people between the Great Lakes and the Ohio River. The canal was eventually replaced by the railroad, which was built in the late 1800s.
The city was also an important stop on the Underground Railroad, which was used to help slaves escape to freedom in the northern states. The city was home to several prominent abolitionists, including the Reverend John Rankin, who was a leader in the movement.
Geography
Rensselaer is located in the northwest corner of Jasper County, Indiana. It is situated on the banks of the Iroquois River, about 40 miles north of Indianapolis. The city has a total area of 4.2 square miles, all of which is land.
The city is located in a hilly region of the state, with the highest point being the Rensselaer Hill, which is located just south of the city. The city is also located near several lakes, including Lake Freeman, Lake Shafer, and Lake Manitou.
Economy
Rensselaer is a small city with a diverse economy. The city is home to several manufacturing companies, including a steel mill, a paper mill, and a plastics factory. The city is also home to several retail stores, restaurants, and other businesses.
The city is also home to several educational institutions, including Rensselaer Central High School, Rensselaer Polytechnic Institute, and Purdue University Northwest.
Demographics
According to the 2010 census, the population of Rensselaer was 5,859 people. The racial makeup of the city was 95.3% White, 0.7% African American, 0.3% Native American, 0.7% Asian, 0.1% Pacific Islander, 1.2% from other races, and 1.7% from two or more races. Hispanic or Latino of any race were 3.2% of the population.
The median income for a household in the city was $37,917, and the median income for a family was $45,938. The per capita income for the city was $18,945. About 11.2% of families and 14.2% of the population were below the poverty line, including 19.2% of those under age 18 and 8.2% of those age 65 or over.
Common Questions
What is Per Capita Income in Rensselaer?
Per Capita income in Rensselaer is $28,888.
What is the Median Family Income in Rensselaer?
Median Family Income in Rensselaer is $79,070.
What is the Median Household income in Rensselaer?
Median Household Income in Rensselaer is $58,659.
What is Income or Wage Gap in Rensselaer?
Income or Wage Gap in Rensselaer is 40.3%.
Women in Rensselaer earn 59.7 cents for every dollar earned by a man.
What is Inequality or Gini Index in Rensselaer?
Inequality or Gini Index in Rensselaer is 0.36.
What is the Total Population of Rensselaer?
Total Population of Rensselaer is 5,330.
What is the Total Male Population of Rensselaer?
Total Male Population of Rensselaer is 2,554.
What is the Total Female Population of Rensselaer?
Total Female Population of Rensselaer is 2,776.
What is the Ratio of Males per 100 Females in Rensselaer?
There are 92.00 Males per 100 Females in Rensselaer.
What is the Ratio of Females per 100 Males in Rensselaer?
There are 108.69 Females per 100 Males in Rensselaer.
What is the Median Population Age in Rensselaer?
Median Population Age in Rensselaer is 37.3 Years.
What is the Average Family Size in Rensselaer
Average Family Size in Rensselaer is 3.3 People.
What is the Average Household Size in Rensselaer
Average Household Size in Rensselaer is 2.4 People.
How Large is the Labor Force in Rensselaer?
There are 2,791 People in the Labor Forcein in Rensselaer.
What is the Percentage of People in the Labor Force in Rensselaer?
65.4% of People are in the Labor Force in Rensselaer.
What is the Unemployment Rate in Rensselaer?
Unemployment Rate in Rensselaer is 2.7%.