Pierceton, IN Map & Demographics
Pierceton Map
Pierceton Overview
$29,761
PER CAPITA INCOME
$53,542
AVG FAMILY INCOME
$54,962
AVG HOUSEHOLD INCOME
40.5%
WAGE / INCOME GAP [ % ]
59.5¢/ $1
WAGE / INCOME GAP [ $ ]
0.37
INEQUALITY / GINI INDEX
1,344
TOTAL POPULATION
824
MALE POPULATION
520
FEMALE POPULATION
158.46
MALES / 100 FEMALES
63.11
FEMALES / 100 MALES
33.6
MEDIAN AGE
2.6
AVG FAMILY SIZE
2.2
AVG HOUSEHOLD SIZE
718
LABOR FORCE [ PEOPLE ]
70.0%
PERCENT IN LABOR FORCE
2.5%
UNEMPLOYMENT RATE
Pierceton Zip Codes
Income in Pierceton
Income Overview in Pierceton
Per Capita Income in Pierceton is $29,761, while median incomes of families and households are $53,542 and $54,962 respectively.
| Characteristic | Number | Measure |
| Per Capita Income | 1,344 | $29,761 |
| Median Family Income | 328 | $53,542 |
| Mean Family Income | 328 | $71,084 |
| Median Household Income | 597 | $54,962 |
| Mean Household Income | 597 | $71,009 |
| Income Deficit | 328 | $0 |
| Wage / Income Gap (%) | 1,344 | 40.54% |
| Wage / Income Gap ($) | 1,344 | 59.46¢ per $1 |
| Gini / Inequality Index | 1,344 | 0.37 |
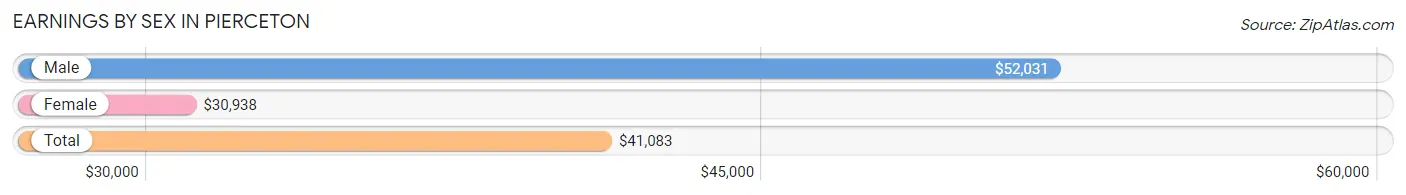
Earnings by Sex in Pierceton
Average Earnings in Pierceton are $41,083, $52,031 for men and $30,938 for women, a difference of 40.5%.
| Sex | Number | Average Earnings |
| Male | 465 (64.2%) | $52,031 |
| Female | 259 (35.8%) | $30,938 |
| Total | 724 (100.0%) | $41,083 |
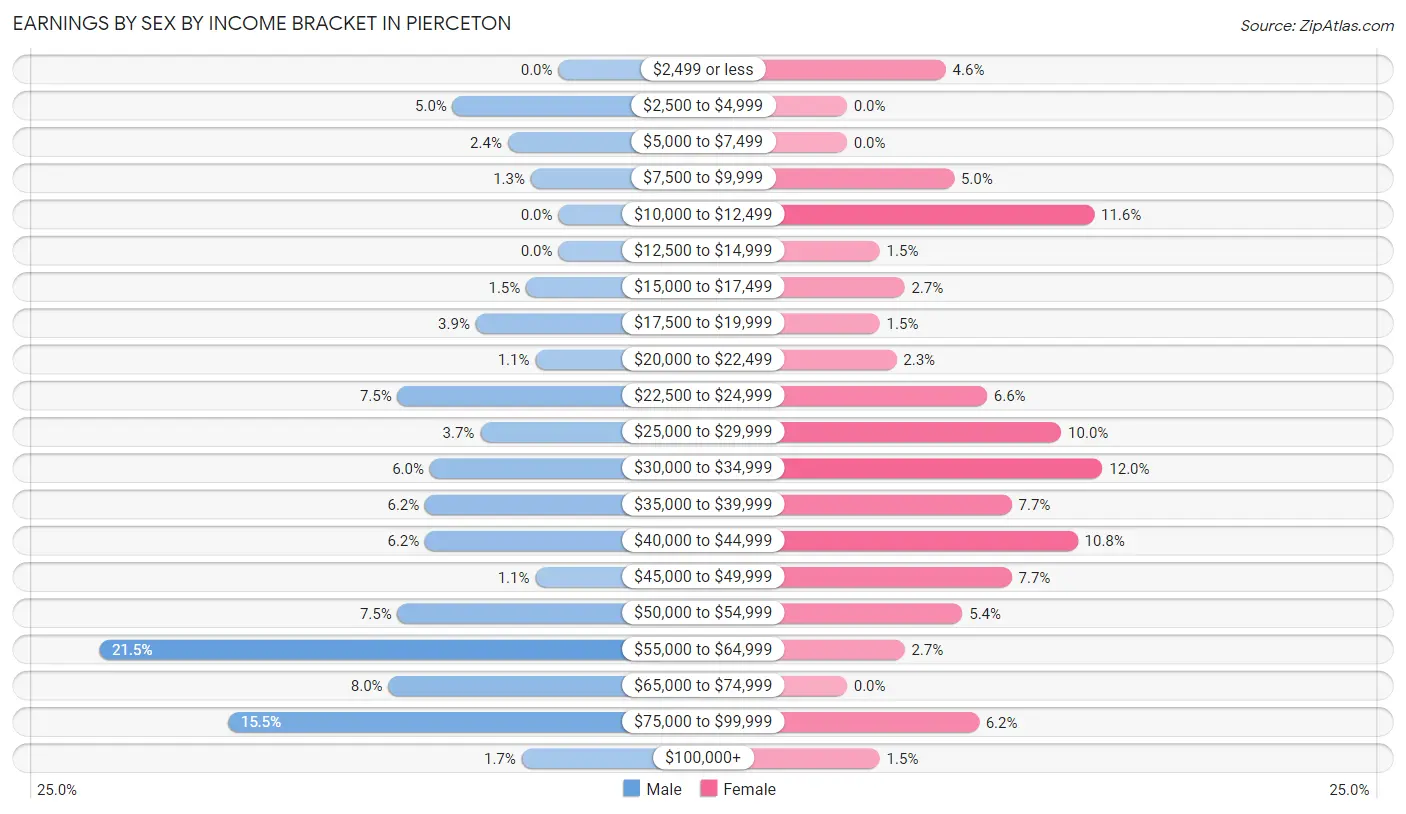
Earnings by Sex by Income Bracket in Pierceton
The most common earnings brackets in Pierceton are $55,000 to $64,999 for men (100 | 21.5%) and $30,000 to $34,999 for women (31 | 12.0%).
| Income | Male | Female |
| $2,499 or less | 0 (0.0%) | 12 (4.6%) |
| $2,500 to $4,999 | 23 (5.0%) | 0 (0.0%) |
| $5,000 to $7,499 | 11 (2.4%) | 0 (0.0%) |
| $7,500 to $9,999 | 6 (1.3%) | 13 (5.0%) |
| $10,000 to $12,499 | 0 (0.0%) | 30 (11.6%) |
| $12,500 to $14,999 | 0 (0.0%) | 4 (1.5%) |
| $15,000 to $17,499 | 7 (1.5%) | 7 (2.7%) |
| $17,500 to $19,999 | 18 (3.9%) | 4 (1.5%) |
| $20,000 to $22,499 | 5 (1.1%) | 6 (2.3%) |
| $22,500 to $24,999 | 35 (7.5%) | 17 (6.6%) |
| $25,000 to $29,999 | 17 (3.7%) | 26 (10.0%) |
| $30,000 to $34,999 | 28 (6.0%) | 31 (12.0%) |
| $35,000 to $39,999 | 29 (6.2%) | 20 (7.7%) |
| $40,000 to $44,999 | 29 (6.2%) | 28 (10.8%) |
| $45,000 to $49,999 | 5 (1.1%) | 20 (7.7%) |
| $50,000 to $54,999 | 35 (7.5%) | 14 (5.4%) |
| $55,000 to $64,999 | 100 (21.5%) | 7 (2.7%) |
| $65,000 to $74,999 | 37 (8.0%) | 0 (0.0%) |
| $75,000 to $99,999 | 72 (15.5%) | 16 (6.2%) |
| $100,000+ | 8 (1.7%) | 4 (1.5%) |
| Total | 465 (100.0%) | 259 (100.0%) |
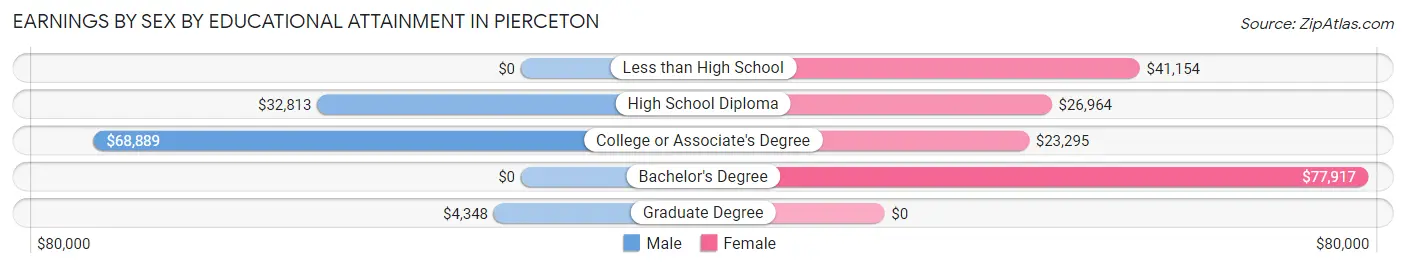
Earnings by Sex by Educational Attainment in Pierceton
Average earnings in Pierceton are $47,083 for men and $35,000 for women, a difference of 25.7%. Men with an educational attainment of college or associate's degree enjoy the highest average annual earnings of $68,889, while those with graduate degree education earn the least with $4,348. Women with an educational attainment of bachelor's degree earn the most with the average annual earnings of $77,917, while those with college or associate's degree education have the smallest earnings of $23,295.
| Educational Attainment | Male Income | Female Income |
| Less than High School | - | - |
| High School Diploma | $32,813 | $26,964 |
| College or Associate's Degree | $68,889 | $23,295 |
| Bachelor's Degree | - | - |
| Graduate Degree | $4,348 | $0 |
| Total | $47,083 | $35,000 |
Family Income in Pierceton
Family Income Brackets in Pierceton
According to the Pierceton family income data, there are 82 families falling into the $100,000 to $149,999 income range, which is the most common income bracket and makes up 25.0% of all families.
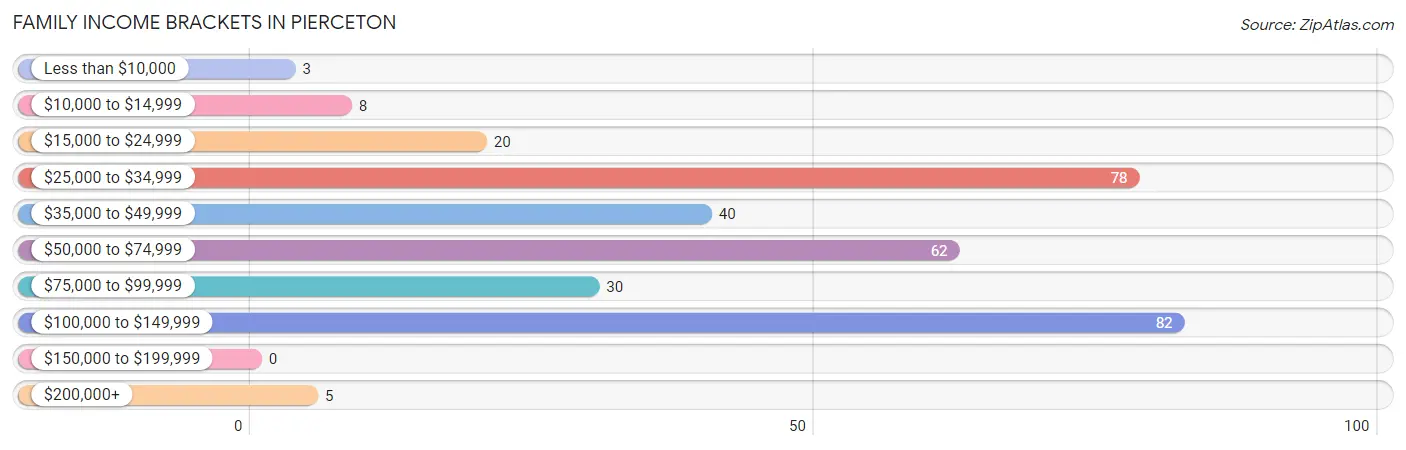
| Income Bracket | # Families | % Families |
| Less than $10,000 | 3 | 0.9% |
| $10,000 to $14,999 | 8 | 2.4% |
| $15,000 to $24,999 | 20 | 6.1% |
| $25,000 to $34,999 | 78 | 23.8% |
| $35,000 to $49,999 | 40 | 12.2% |
| $50,000 to $74,999 | 62 | 18.9% |
| $75,000 to $99,999 | 30 | 9.1% |
| $100,000 to $149,999 | 82 | 25.0% |
| $150,000 to $199,999 | 0 | 0.0% |
| $200,000+ | 5 | 1.5% |
Family Income by Famaliy Size in Pierceton
5-person families (17 | 5.2%) account for the highest median family income in Pierceton with $75,972 per family, while 2-person families (224 | 68.3%) have the highest median income of $24,750 per family member.
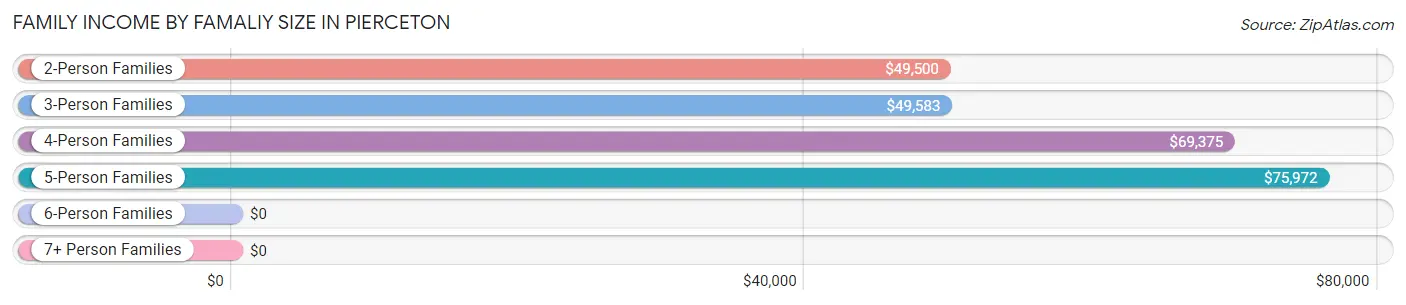
| Income Bracket | # Families | Median Income |
| 2-Person Families | 224 (68.3%) | $49,500 |
| 3-Person Families | 27 (8.2%) | $49,583 |
| 4-Person Families | 55 (16.8%) | $69,375 |
| 5-Person Families | 17 (5.2%) | $75,972 |
| 6-Person Families | 0 (0.0%) | $0 |
| 7+ Person Families | 5 (1.5%) | $0 |
| Total | 328 (100.0%) | $53,542 |
Family Income by Number of Earners in Pierceton
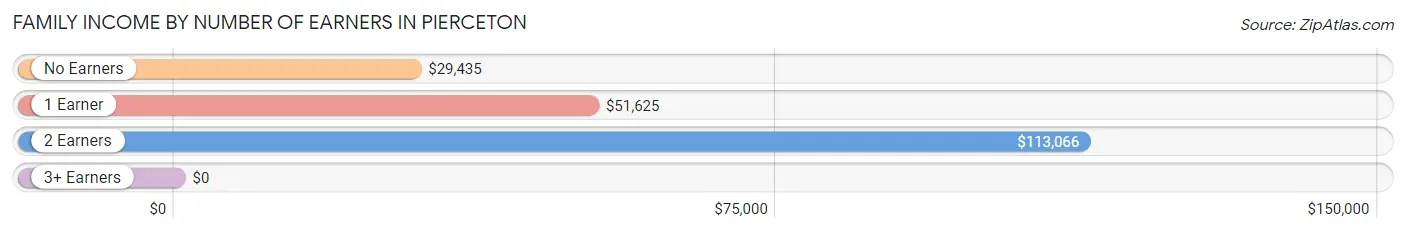
| Number of Earners | # Families | Median Income |
| No Earners | 99 (30.2%) | $29,435 |
| 1 Earner | 95 (29.0%) | $51,625 |
| 2 Earners | 120 (36.6%) | $113,066 |
| 3+ Earners | 14 (4.3%) | $0 |
| Total | 328 (100.0%) | $53,542 |
Household Income in Pierceton
Household Income Brackets in Pierceton
With 143 households falling in the category, the $100,000 to $149,999 income range is the most frequent in Pierceton, accounting for 23.9% of all households. In contrast, only 6 households (1.0%) fall into the $150,000 to $199,999 income bracket, making it the least populous group.
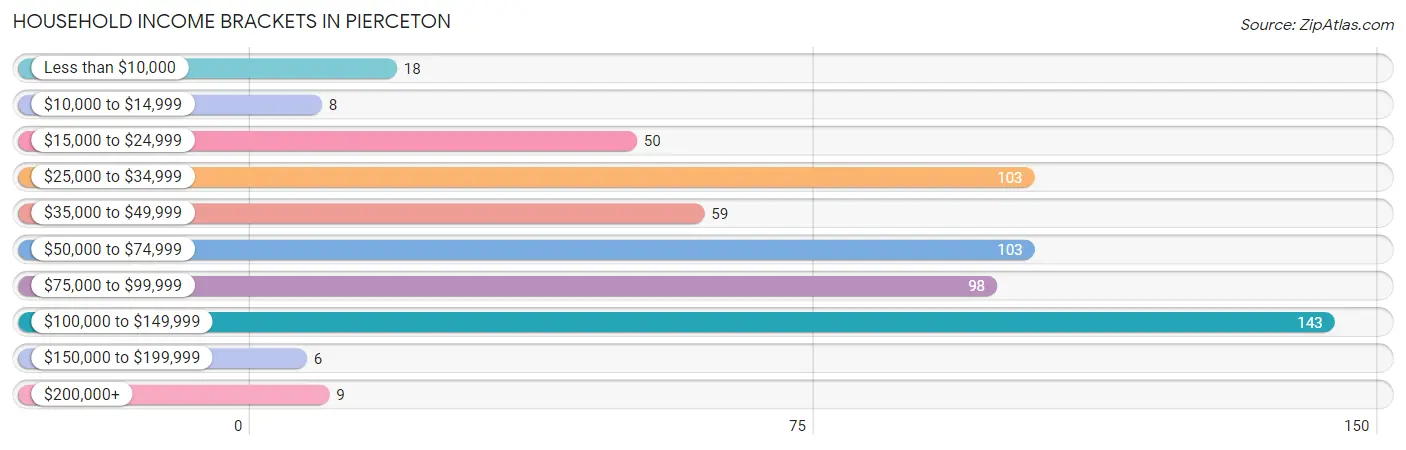
| Income Bracket | # Households | % Households |
| Less than $10,000 | 18 | 3.0% |
| $10,000 to $14,999 | 8 | 1.3% |
| $15,000 to $24,999 | 50 | 8.4% |
| $25,000 to $34,999 | 103 | 17.3% |
| $35,000 to $49,999 | 59 | 9.9% |
| $50,000 to $74,999 | 103 | 17.3% |
| $75,000 to $99,999 | 98 | 16.4% |
| $100,000 to $149,999 | 143 | 24.0% |
| $150,000 to $199,999 | 6 | 1.0% |
| $200,000+ | 9 | 1.5% |
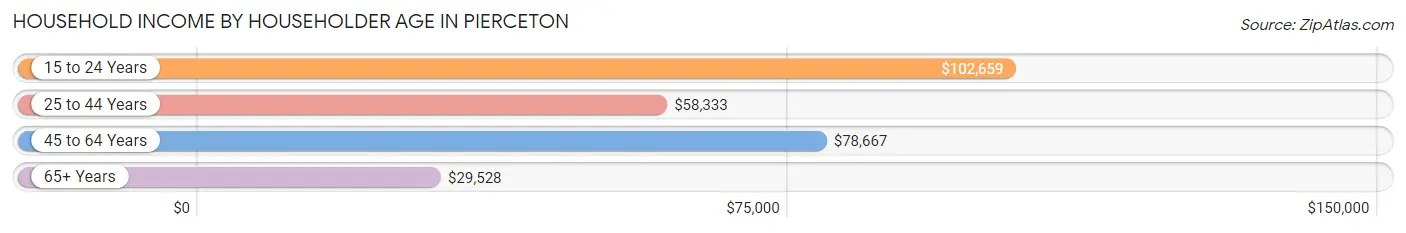
Household Income by Householder Age in Pierceton
The median household income in Pierceton is $54,962, with the highest median household income of $102,659 found in the 15 to 24 years age bracket for the primary householder. A total of 103 households (17.2%) fall into this category. Meanwhile, the 65+ years age bracket for the primary householder has the lowest median household income of $29,528, with 150 households (25.1%) in this group.
| Income Bracket | # Households | Median Income |
| 15 to 24 Years | 103 (17.2%) | $102,659 |
| 25 to 44 Years | 154 (25.8%) | $58,333 |
| 45 to 64 Years | 190 (31.8%) | $78,667 |
| 65+ Years | 150 (25.1%) | $29,528 |
| Total | 597 (100.0%) | $54,962 |
Poverty in Pierceton
Income Below Poverty by Sex and Age in Pierceton
With 15.0% poverty level for males and 18.4% for females among the residents of Pierceton, 5 year old males and under 5 year old females are the most vulnerable to poverty, with 8 males (100.0%) and 19 females (100.0%) in their respective age groups living below the poverty level.
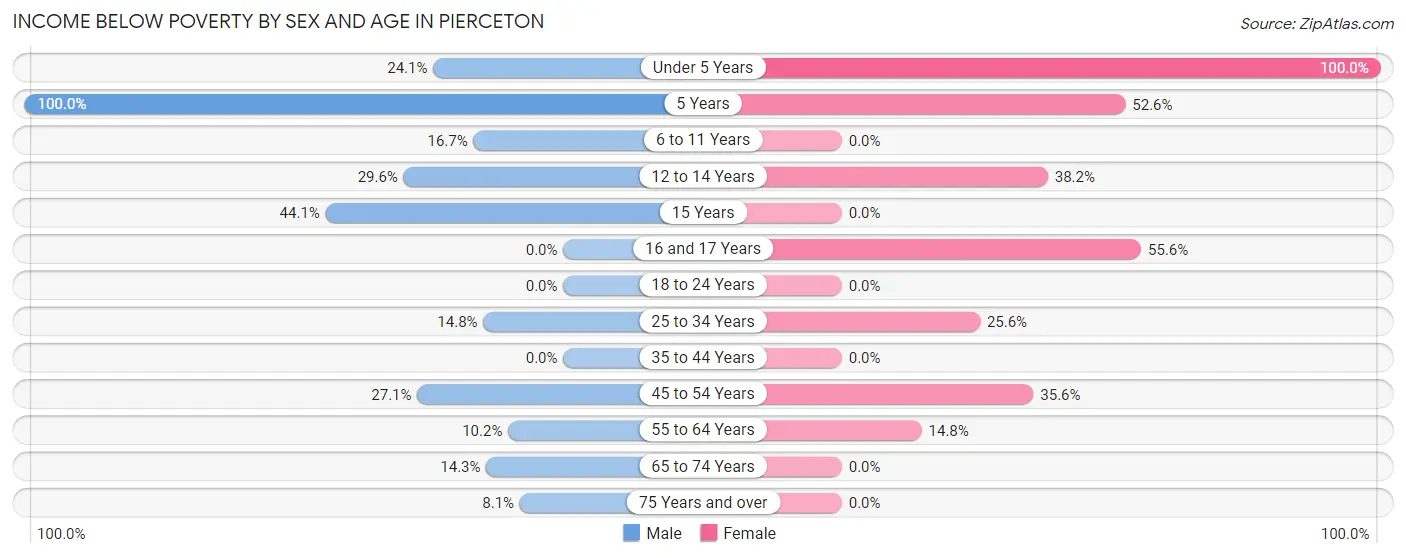
| Age Bracket | Male | Female |
| Under 5 Years | 7 (24.1%) | 19 (100.0%) |
| 5 Years | 8 (100.0%) | 10 (52.6%) |
| 6 to 11 Years | 10 (16.7%) | 0 (0.0%) |
| 12 to 14 Years | 8 (29.6%) | 13 (38.2%) |
| 15 Years | 15 (44.1%) | 0 (0.0%) |
| 16 and 17 Years | 0 (0.0%) | 5 (55.6%) |
| 18 to 24 Years | 0 (0.0%) | 0 (0.0%) |
| 25 to 34 Years | 19 (14.8%) | 20 (25.6%) |
| 35 to 44 Years | 0 (0.0%) | 0 (0.0%) |
| 45 to 54 Years | 29 (27.1%) | 16 (35.6%) |
| 55 to 64 Years | 9 (10.2%) | 8 (14.8%) |
| 65 to 74 Years | 7 (14.3%) | 0 (0.0%) |
| 75 Years and over | 5 (8.1%) | 0 (0.0%) |
| Total | 117 (15.0%) | 91 (18.4%) |
Income Above Poverty by Sex and Age in Pierceton
According to the poverty statistics in Pierceton, males aged 16 and 17 years and females aged 6 to 11 years are the age groups that are most secure financially, with 100.0% of males and 100.0% of females in these age groups living above the poverty line.
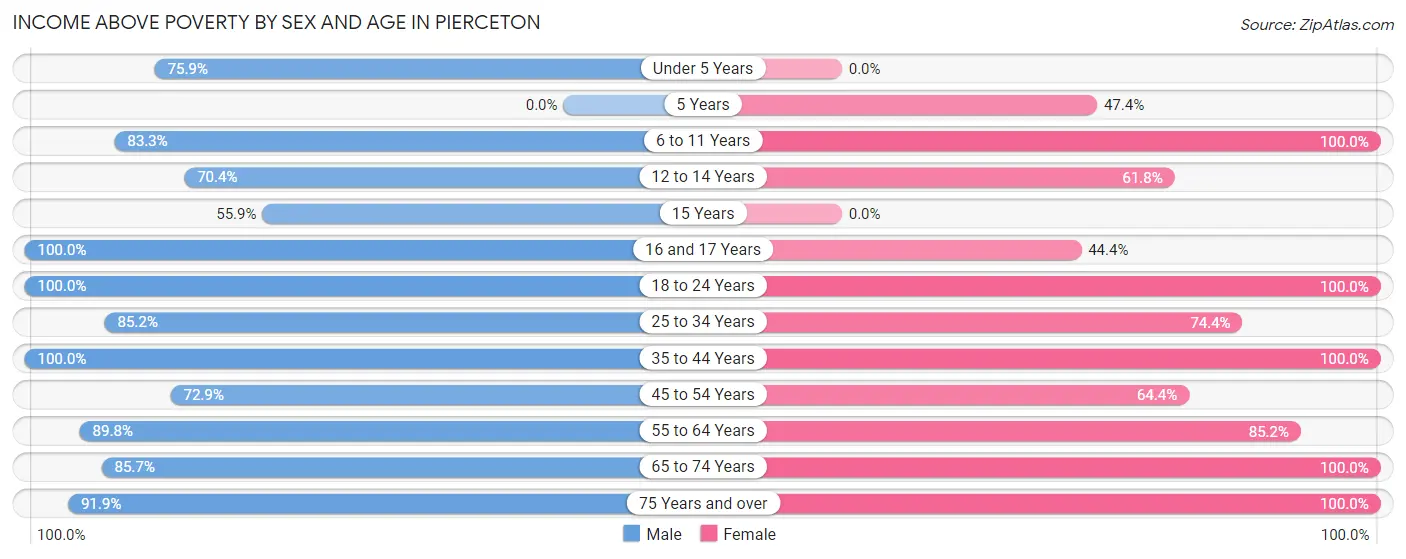
| Age Bracket | Male | Female |
| Under 5 Years | 22 (75.9%) | 0 (0.0%) |
| 5 Years | 0 (0.0%) | 9 (47.4%) |
| 6 to 11 Years | 50 (83.3%) | 19 (100.0%) |
| 12 to 14 Years | 19 (70.4%) | 21 (61.8%) |
| 15 Years | 19 (55.9%) | 0 (0.0%) |
| 16 and 17 Years | 15 (100.0%) | 4 (44.4%) |
| 18 to 24 Years | 113 (100.0%) | 45 (100.0%) |
| 25 to 34 Years | 109 (85.2%) | 58 (74.4%) |
| 35 to 44 Years | 60 (100.0%) | 68 (100.0%) |
| 45 to 54 Years | 78 (72.9%) | 29 (64.4%) |
| 55 to 64 Years | 79 (89.8%) | 46 (85.2%) |
| 65 to 74 Years | 42 (85.7%) | 53 (100.0%) |
| 75 Years and over | 57 (91.9%) | 51 (100.0%) |
| Total | 663 (85.0%) | 403 (81.6%) |
Income Below Poverty Among Married-Couple Families in Pierceton
The poverty statistics for married-couple families in Pierceton show that 6.5% or 13 of the total 199 families live below the poverty line. Families with 5 or more children have the highest poverty rate of 100.0%, comprising of 5 families. On the other hand, families with 1 or 2 children have the lowest poverty rate of 0.0%, which includes 0 families.
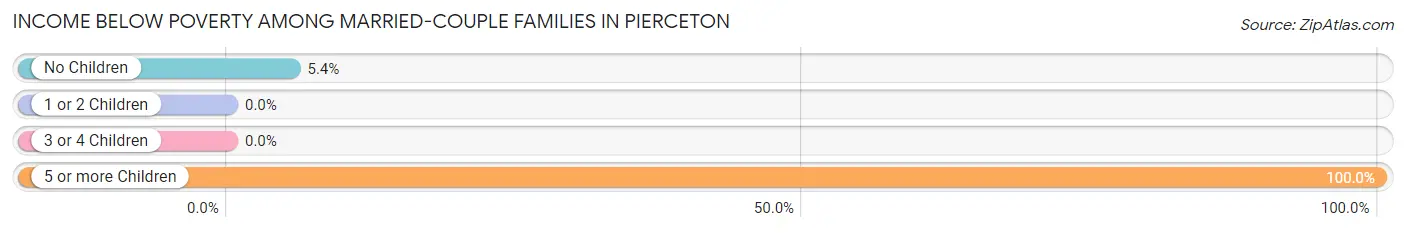
| Children | Above Poverty | Below Poverty |
| No Children | 139 (94.6%) | 8 (5.4%) |
| 1 or 2 Children | 35 (100.0%) | 0 (0.0%) |
| 3 or 4 Children | 12 (100.0%) | 0 (0.0%) |
| 5 or more Children | 0 (0.0%) | 5 (100.0%) |
| Total | 186 (93.5%) | 13 (6.5%) |
Income Below Poverty Among Single-Parent Households in Pierceton
According to the poverty data in Pierceton, 5.0% or 5 single-father households and 50.0% or 14 single-mother households are living below the poverty line. Among single-father households, those with 1 or 2 children have the highest poverty rate, with 5 households (26.3%) experiencing poverty. Likewise, among single-mother households, those with 1 or 2 children have the highest poverty rate, with 14 households (82.4%) falling below the poverty line.
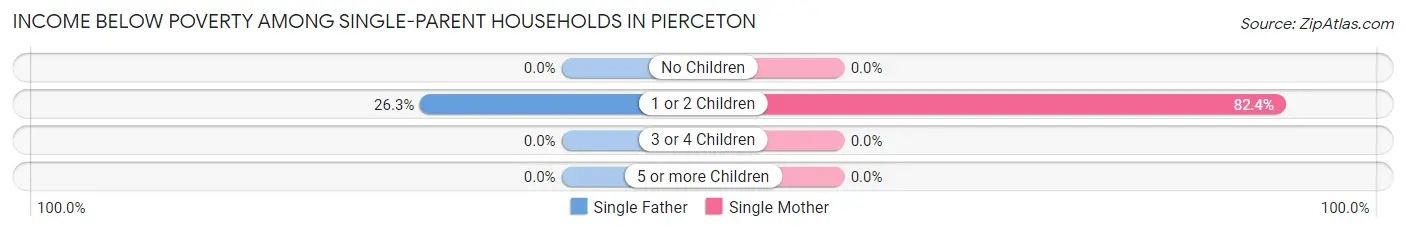
| Children | Single Father | Single Mother |
| No Children | 0 (0.0%) | 0 (0.0%) |
| 1 or 2 Children | 5 (26.3%) | 14 (82.4%) |
| 3 or 4 Children | 0 (0.0%) | 0 (0.0%) |
| 5 or more Children | 0 (0.0%) | 0 (0.0%) |
| Total | 5 (5.0%) | 14 (50.0%) |
Income Below Poverty Among Married-Couple vs Single-Parent Households in Pierceton
The poverty data for Pierceton shows that 13 of the married-couple family households (6.5%) and 19 of the single-parent households (14.7%) are living below the poverty level. Within the married-couple family households, those with 5 or more children have the highest poverty rate, with 5 households (100.0%) falling below the poverty line. Among the single-parent households, those with 1 or 2 children have the highest poverty rate, with 19 household (52.8%) living below poverty.
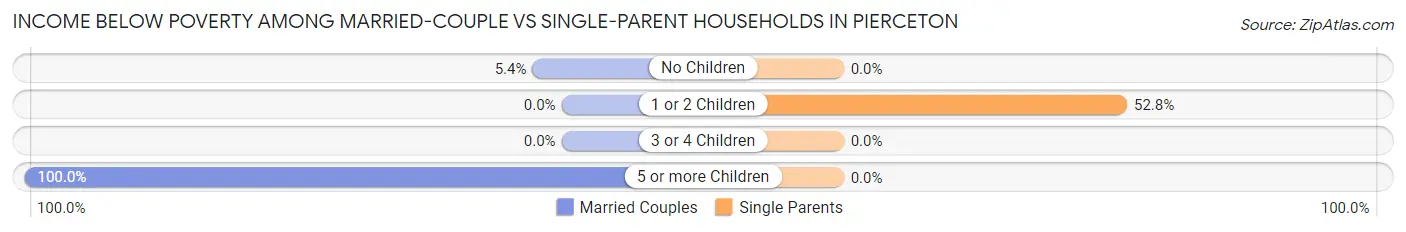
| Children | Married-Couple Families | Single-Parent Households |
| No Children | 8 (5.4%) | 0 (0.0%) |
| 1 or 2 Children | 0 (0.0%) | 19 (52.8%) |
| 3 or 4 Children | 0 (0.0%) | 0 (0.0%) |
| 5 or more Children | 5 (100.0%) | 0 (0.0%) |
| Total | 13 (6.5%) | 19 (14.7%) |
Race in Pierceton
The most populous races in Pierceton are White / Caucasian (1,195 | 88.9%), Hispanic or Latino (143 | 10.6%), and Two or more Races (100 | 7.4%).
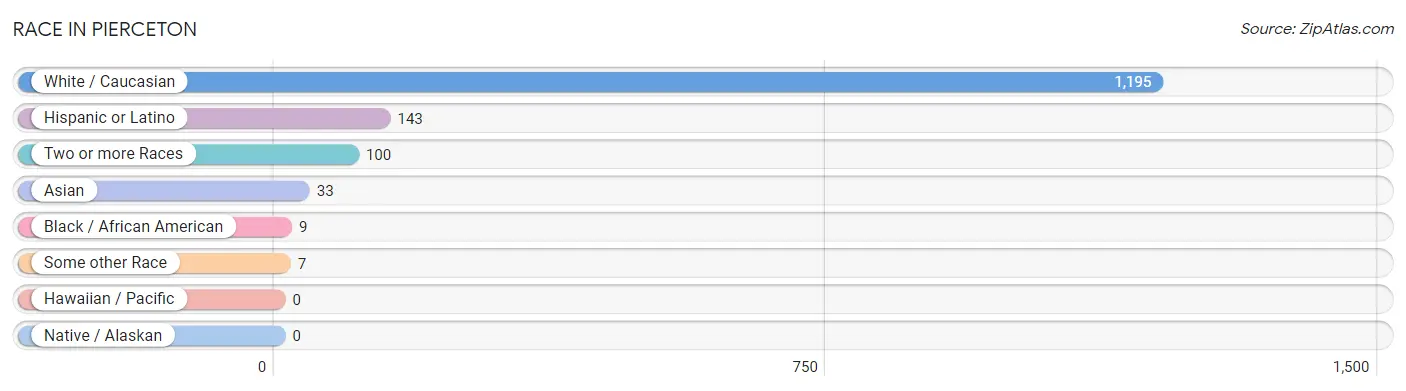
| Race | # Population | % Population |
| Asian | 33 | 2.5% |
| Black / African American | 9 | 0.7% |
| Hawaiian / Pacific | 0 | 0.0% |
| Hispanic or Latino | 143 | 10.6% |
| Native / Alaskan | 0 | 0.0% |
| White / Caucasian | 1,195 | 88.9% |
| Two or more Races | 100 | 7.4% |
| Some other Race | 7 | 0.5% |
| Total | 1,344 | 100.0% |
Ancestry in Pierceton
The most populous ancestries reported in Pierceton are German (377 | 28.1%), American (157 | 11.7%), Irish (110 | 8.2%), English (91 | 6.8%), and European (76 | 5.7%), together accounting for 60.3% of all Pierceton residents.
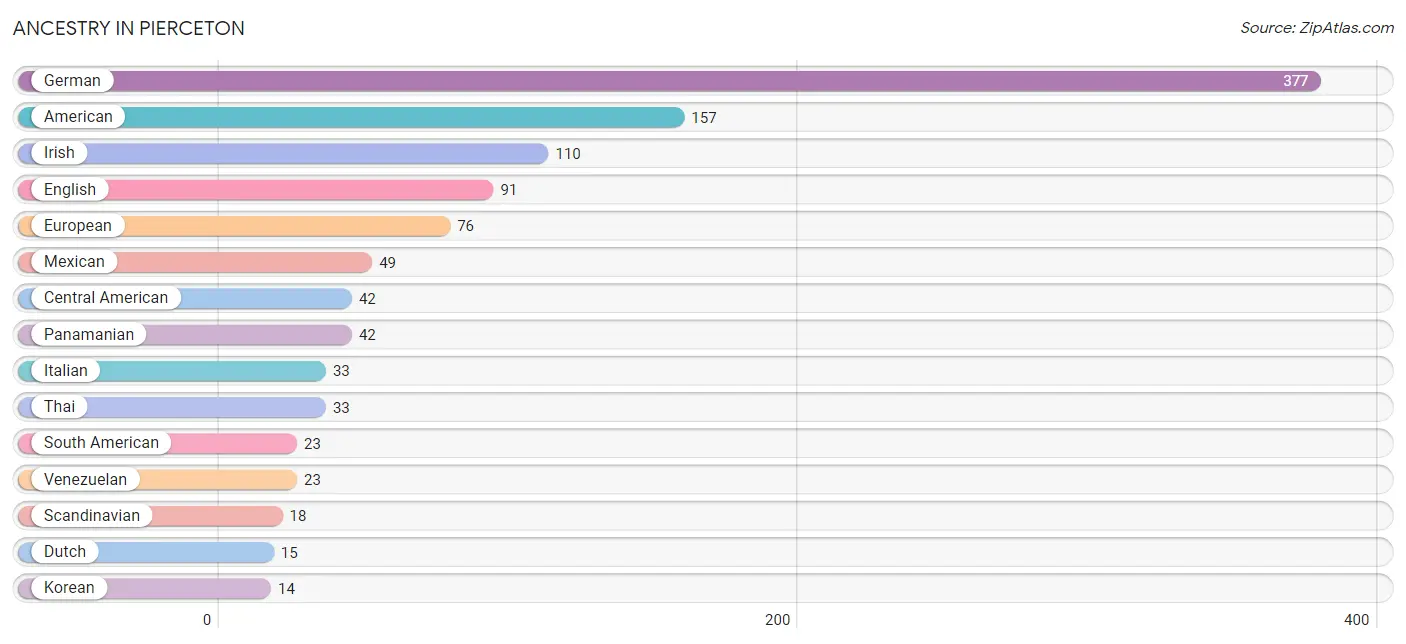
| Ancestry | # Population | % Population |
| American | 157 | 11.7% |
| Bhutanese | 2 | 0.2% |
| Central American | 42 | 3.1% |
| Dutch | 15 | 1.1% |
| English | 91 | 6.8% |
| European | 76 | 5.7% |
| German | 377 | 28.1% |
| Irish | 110 | 8.2% |
| Italian | 33 | 2.5% |
| Korean | 14 | 1.0% |
| Mexican | 49 | 3.6% |
| Nigerian | 9 | 0.7% |
| Panamanian | 42 | 3.1% |
| Polish | 9 | 0.7% |
| Puerto Rican | 9 | 0.7% |
| Scandinavian | 18 | 1.3% |
| Scotch-Irish | 4 | 0.3% |
| Scottish | 3 | 0.2% |
| Sioux | 1 | 0.1% |
| South American | 23 | 1.7% |
| Subsaharan African | 9 | 0.7% |
| Swedish | 9 | 0.7% |
| Swiss | 2 | 0.2% |
| Thai | 33 | 2.5% |
| Venezuelan | 23 | 1.7% | View All 25 Rows |
Immigrants in Pierceton
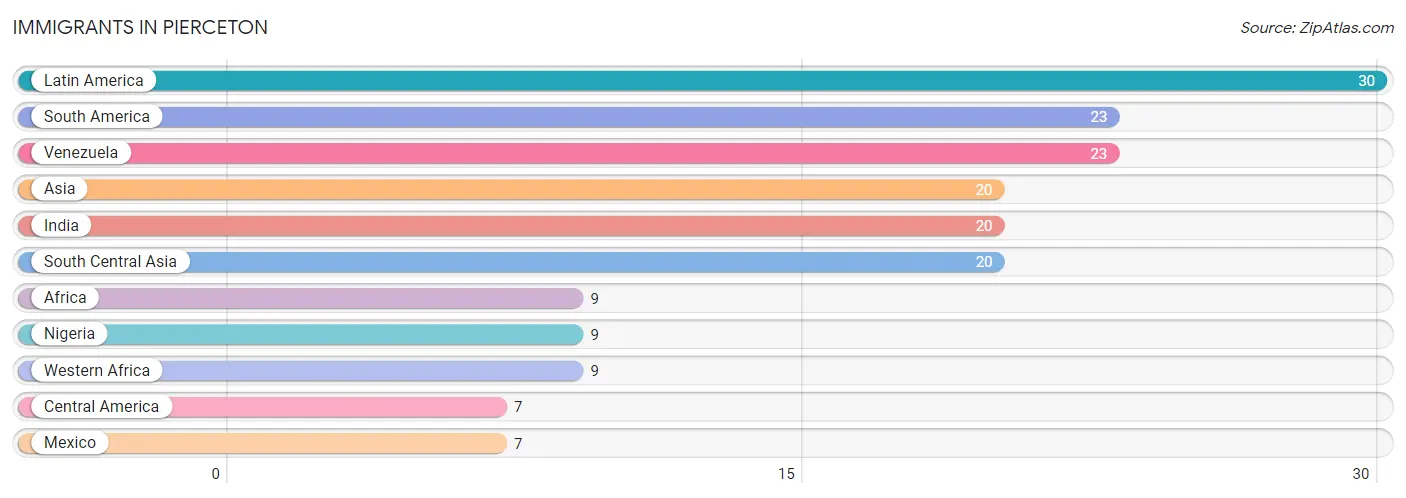
The most numerous immigrant groups reported in Pierceton came from Latin America (30 | 2.2%), South America (23 | 1.7%), Venezuela (23 | 1.7%), Asia (20 | 1.5%), and India (20 | 1.5%), together accounting for 8.6% of all Pierceton residents.
| Immigration Origin | # Population | % Population |
| Africa | 9 | 0.7% |
| Asia | 20 | 1.5% |
| Central America | 7 | 0.5% |
| India | 20 | 1.5% |
| Latin America | 30 | 2.2% |
| Mexico | 7 | 0.5% |
| Nigeria | 9 | 0.7% |
| South America | 23 | 1.7% |
| South Central Asia | 20 | 1.5% |
| Venezuela | 23 | 1.7% |
| Western Africa | 9 | 0.7% | View All 11 Rows |
Sex and Age in Pierceton
Sex and Age in Pierceton
The most populous age groups in Pierceton are 25 to 29 Years (87 | 10.6%) for men and 10 to 14 Years (60 | 11.5%) for women.
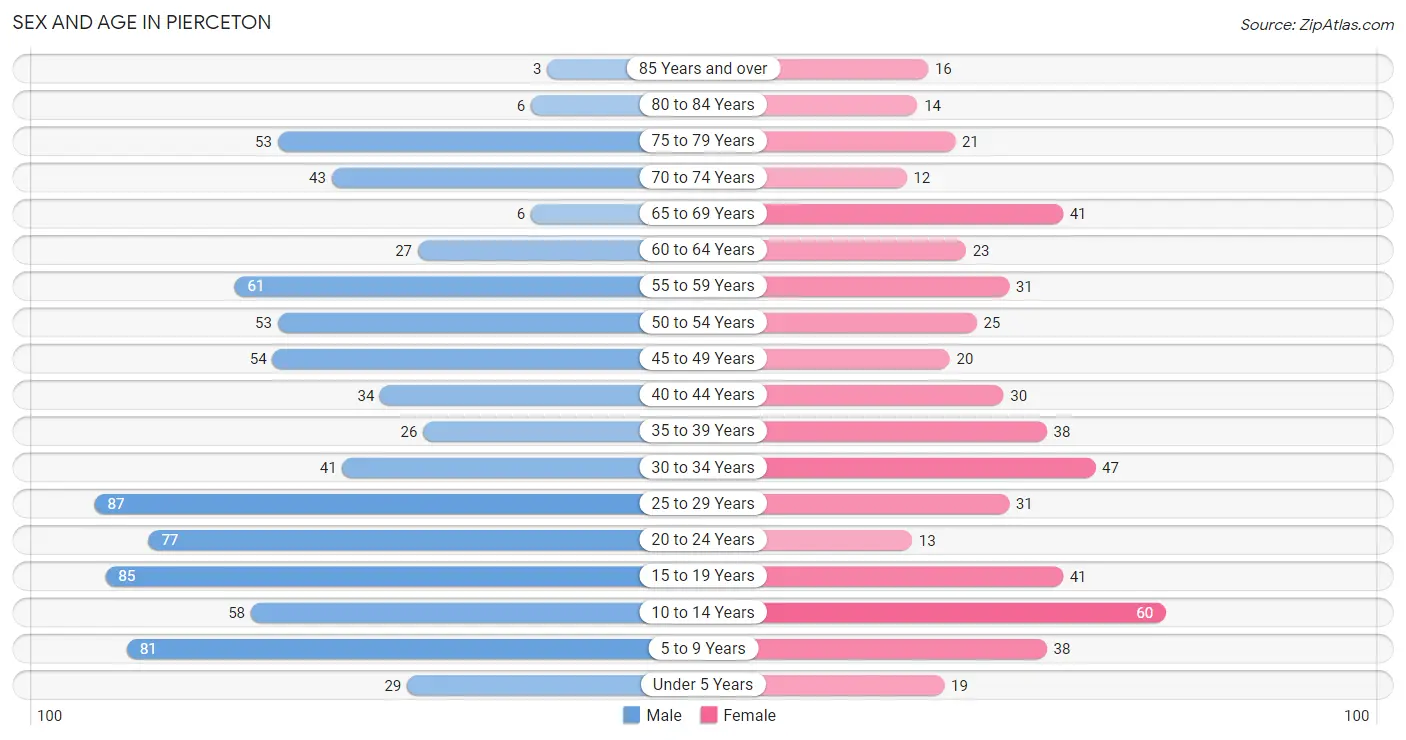
| Age Bracket | Male | Female |
| Under 5 Years | 29 (3.5%) | 19 (3.6%) |
| 5 to 9 Years | 81 (9.8%) | 38 (7.3%) |
| 10 to 14 Years | 58 (7.0%) | 60 (11.5%) |
| 15 to 19 Years | 85 (10.3%) | 41 (7.9%) |
| 20 to 24 Years | 77 (9.3%) | 13 (2.5%) |
| 25 to 29 Years | 87 (10.6%) | 31 (6.0%) |
| 30 to 34 Years | 41 (5.0%) | 47 (9.0%) |
| 35 to 39 Years | 26 (3.2%) | 38 (7.3%) |
| 40 to 44 Years | 34 (4.1%) | 30 (5.8%) |
| 45 to 49 Years | 54 (6.6%) | 20 (3.8%) |
| 50 to 54 Years | 53 (6.4%) | 25 (4.8%) |
| 55 to 59 Years | 61 (7.4%) | 31 (6.0%) |
| 60 to 64 Years | 27 (3.3%) | 23 (4.4%) |
| 65 to 69 Years | 6 (0.7%) | 41 (7.9%) |
| 70 to 74 Years | 43 (5.2%) | 12 (2.3%) |
| 75 to 79 Years | 53 (6.4%) | 21 (4.0%) |
| 80 to 84 Years | 6 (0.7%) | 14 (2.7%) |
| 85 Years and over | 3 (0.4%) | 16 (3.1%) |
| Total | 824 (100.0%) | 520 (100.0%) |
Families and Households in Pierceton
Median Family Size in Pierceton
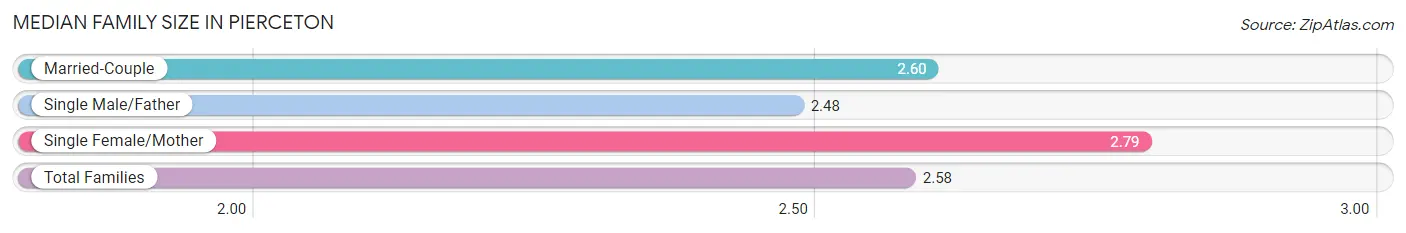
The median family size in Pierceton is 2.58 persons per family, with single female/mother families (28 | 8.5%) accounting for the largest median family size of 2.79 persons per family. On the other hand, single male/father families (101 | 30.8%) represent the smallest median family size with 2.48 persons per family.
| Family Type | # Families | Family Size |
| Married-Couple | 199 (60.7%) | 2.60 |
| Single Male/Father | 101 (30.8%) | 2.48 |
| Single Female/Mother | 28 (8.5%) | 2.79 |
| Total Families | 328 (100.0%) | 2.58 |
Median Household Size in Pierceton
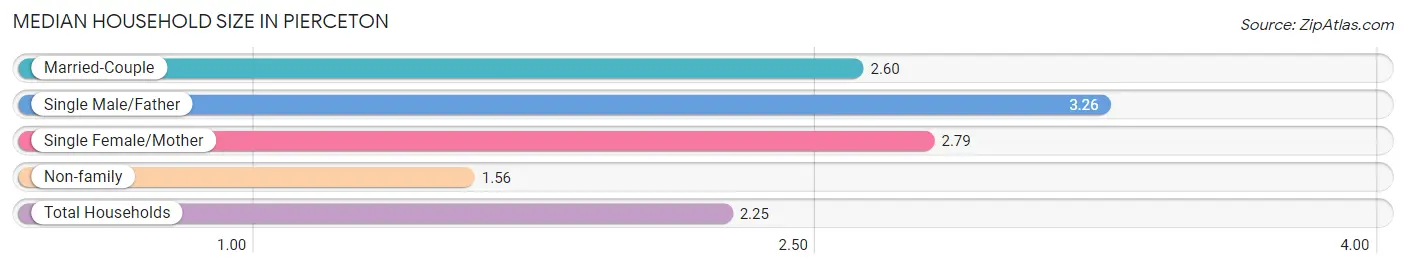
The median household size in Pierceton is 2.25 persons per household, with single male/father households (101 | 16.9%) accounting for the largest median household size of 3.26 persons per household. non-family households (269 | 45.1%) represent the smallest median household size with 1.56 persons per household.
| Household Type | # Households | Household Size |
| Married-Couple | 199 (33.3%) | 2.60 |
| Single Male/Father | 101 (16.9%) | 3.26 |
| Single Female/Mother | 28 (4.7%) | 2.79 |
| Non-family | 269 (45.1%) | 1.56 |
| Total Households | 597 (100.0%) | 2.25 |
Household Size by Marriage Status in Pierceton
Out of a total of 597 households in Pierceton, 328 (54.9%) are family households, while 269 (45.1%) are nonfamily households. The most numerous type of family households are 2-person households, comprising 220, and the most common type of nonfamily households are 1-person households, comprising 137.
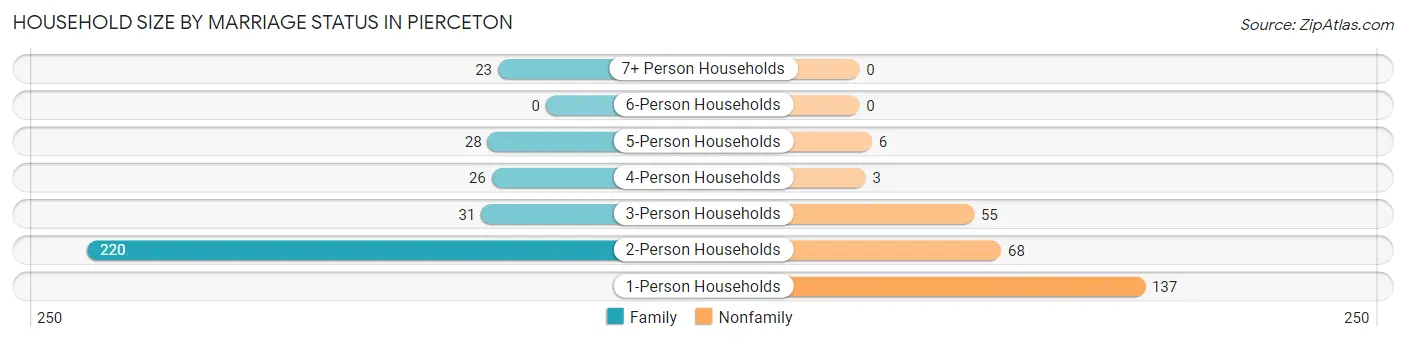
| Household Size | Family Households | Nonfamily Households |
| 1-Person Households | - | 137 (23.0%) |
| 2-Person Households | 220 (36.8%) | 68 (11.4%) |
| 3-Person Households | 31 (5.2%) | 55 (9.2%) |
| 4-Person Households | 26 (4.4%) | 3 (0.5%) |
| 5-Person Households | 28 (4.7%) | 6 (1.0%) |
| 6-Person Households | 0 (0.0%) | 0 (0.0%) |
| 7+ Person Households | 23 (3.8%) | 0 (0.0%) |
| Total | 328 (54.9%) | 269 (45.1%) |
Female Fertility in Pierceton
Fertility by Age in Pierceton
Average fertility rate in Pierceton is 49.0 births per 1,000 women. Women in the age bracket of 20 to 34 years have the highest fertility rate with 121.0 births per 1,000 women. Women in the age bracket of 20 to 34 years acount for 100.0% of all women with births.
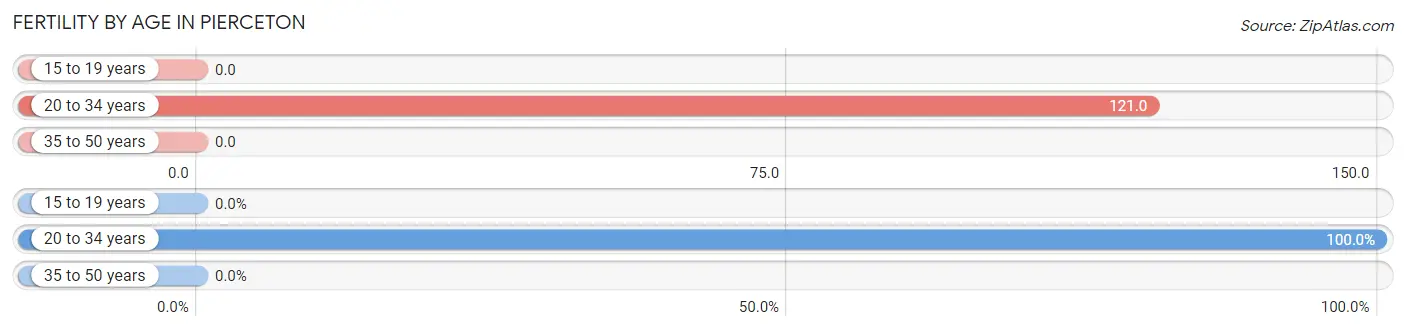
| Age Bracket | Women with Births | Births / 1,000 Women |
| 15 to 19 years | 0 (0.0%) | 0.0 |
| 20 to 34 years | 11 (100.0%) | 121.0 |
| 35 to 50 years | 0 (0.0%) | 0.0 |
| Total | 11 (100.0%) | 49.0 |
Fertility by Age by Marriage Status in Pierceton
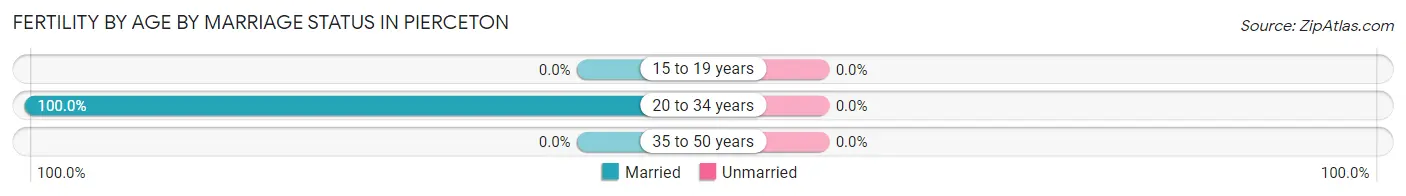
| Age Bracket | Married | Unmarried |
| 15 to 19 years | 0 (0.0%) | 0 (0.0%) |
| 20 to 34 years | 11 (100.0%) | 0 (0.0%) |
| 35 to 50 years | 0 (0.0%) | 0 (0.0%) |
| Total | 11 (100.0%) | 0 (0.0%) |
Fertility by Education in Pierceton
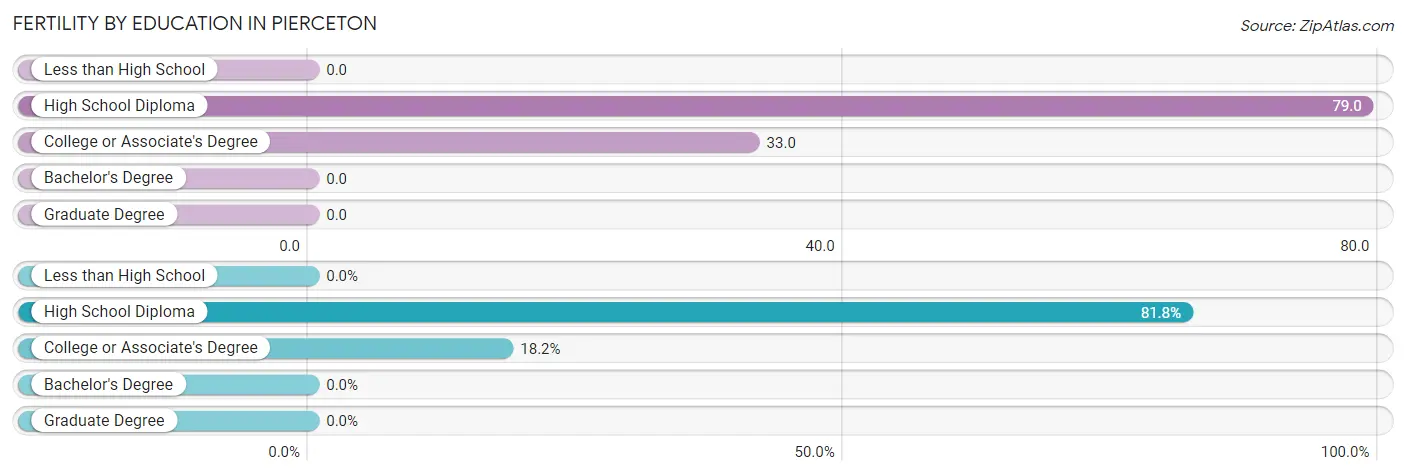
| Educational Attainment | Women with Births | Births / 1,000 Women |
| Less than High School | 0 (0.0%) | 0.0 |
| High School Diploma | 9 (81.8%) | 79.0 |
| College or Associate's Degree | 2 (18.2%) | 33.0 |
| Bachelor's Degree | 0 (0.0%) | 0.0 |
| Graduate Degree | 0 (0.0%) | 0.0 |
| Total | 11 (100.0%) | 49.0 |
Fertility by Education by Marriage Status in Pierceton
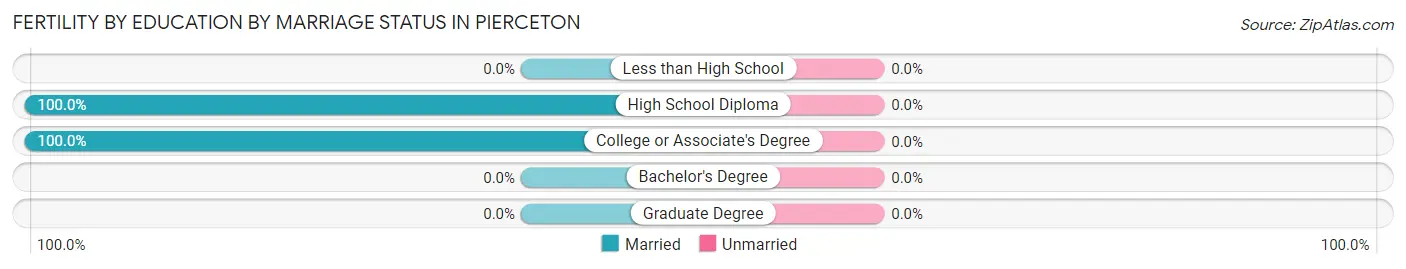
| Educational Attainment | Married | Unmarried |
| Less than High School | 0 (0.0%) | 0 (0.0%) |
| High School Diploma | 9 (100.0%) | 0 (0.0%) |
| College or Associate's Degree | 2 (100.0%) | 0 (0.0%) |
| Bachelor's Degree | 0 (0.0%) | 0 (0.0%) |
| Graduate Degree | 0 (0.0%) | 0 (0.0%) |
| Total | 11 (100.0%) | 0 (0.0%) |
Employment Characteristics in Pierceton
Employment by Class of Employer in Pierceton
Among the 700 employed individuals in Pierceton, private company employees (507 | 72.4%), not-for-profit organizations (94 | 13.4%), and local government employees (80 | 11.4%) make up the most common classes of employment.
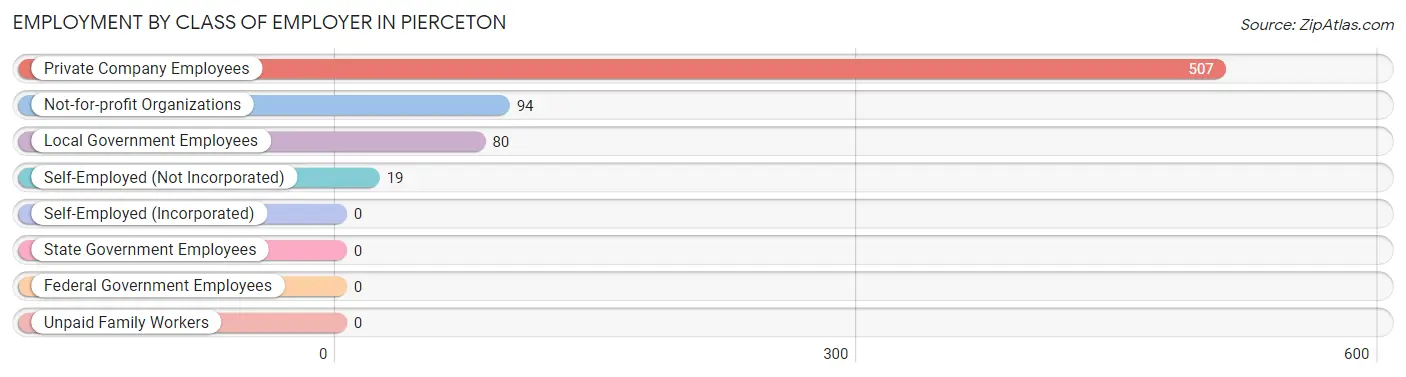
| Employer Class | # Employees | % Employees |
| Private Company Employees | 507 | 72.4% |
| Self-Employed (Incorporated) | 0 | 0.0% |
| Self-Employed (Not Incorporated) | 19 | 2.7% |
| Not-for-profit Organizations | 94 | 13.4% |
| Local Government Employees | 80 | 11.4% |
| State Government Employees | 0 | 0.0% |
| Federal Government Employees | 0 | 0.0% |
| Unpaid Family Workers | 0 | 0.0% |
| Total | 700 | 100.0% |
Employment Status by Age in Pierceton
According to the labor force statistics for Pierceton, out of the total population over 16 years of age (1,025), 70.0% or 718 individuals are in the labor force, with 2.5% or 18 of them unemployed. The age group with the highest labor force participation rate is 25 to 29 years, with 100.0% or 118 individuals in the labor force. Within the labor force, the 30 to 34 years age range has the highest percentage of unemployed individuals, with 14.3% or 11 of them being unemployed.
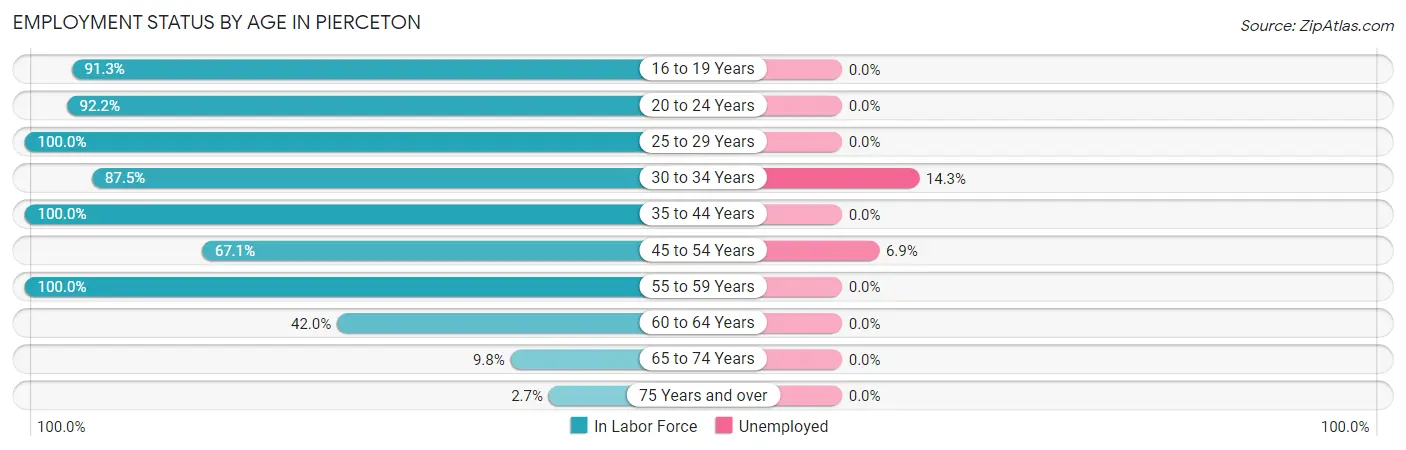
| Age Bracket | In Labor Force | Unemployed |
| 16 to 19 Years | 84 (91.3%) | 0 (0.0%) |
| 20 to 24 Years | 83 (92.2%) | 0 (0.0%) |
| 25 to 29 Years | 118 (100.0%) | 0 (0.0%) |
| 30 to 34 Years | 77 (87.5%) | 11 (14.3%) |
| 35 to 44 Years | 128 (100.0%) | 0 (0.0%) |
| 45 to 54 Years | 102 (67.1%) | 7 (6.9%) |
| 55 to 59 Years | 92 (100.0%) | 0 (0.0%) |
| 60 to 64 Years | 21 (42.0%) | 0 (0.0%) |
| 65 to 74 Years | 10 (9.8%) | 0 (0.0%) |
| 75 Years and over | 3 (2.7%) | 0 (0.0%) |
| Total | 718 (70.0%) | 18 (2.5%) |
Employment Status by Educational Attainment in Pierceton
According to labor force statistics for Pierceton, 85.7% of individuals (538) out of the total population between 25 and 64 years of age (628) are in the labor force, with 3.3% or 18 of them being unemployed. The group with the highest labor force participation rate are those with the educational attainment of bachelor's degree or higher, with 100.0% or 109 individuals in the labor force. Within the labor force, individuals with less than high school education have the highest percentage of unemployment, with 14.0% or 7 of them being unemployed.
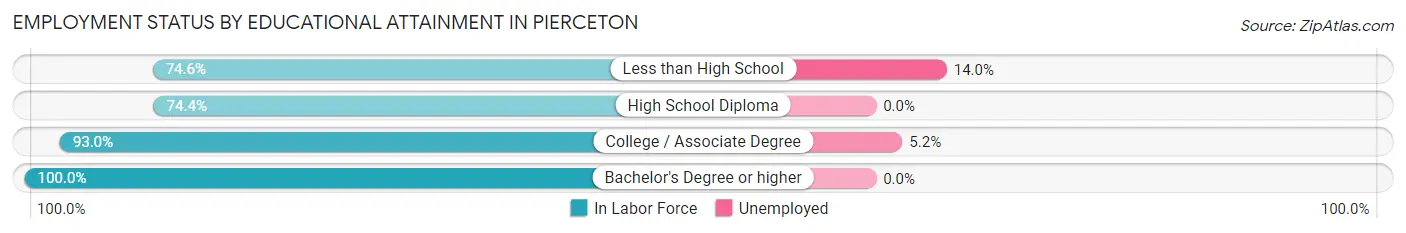
| Educational Attainment | In Labor Force | Unemployed |
| Less than High School | 50 (74.6%) | 9 (14.0%) |
| High School Diploma | 166 (74.4%) | 0 (0.0%) |
| College / Associate Degree | 213 (93.0%) | 12 (5.2%) |
| Bachelor's Degree or higher | 109 (100.0%) | 0 (0.0%) |
| Total | 538 (85.7%) | 21 (3.3%) |
Employment Occupations by Sex in Pierceton
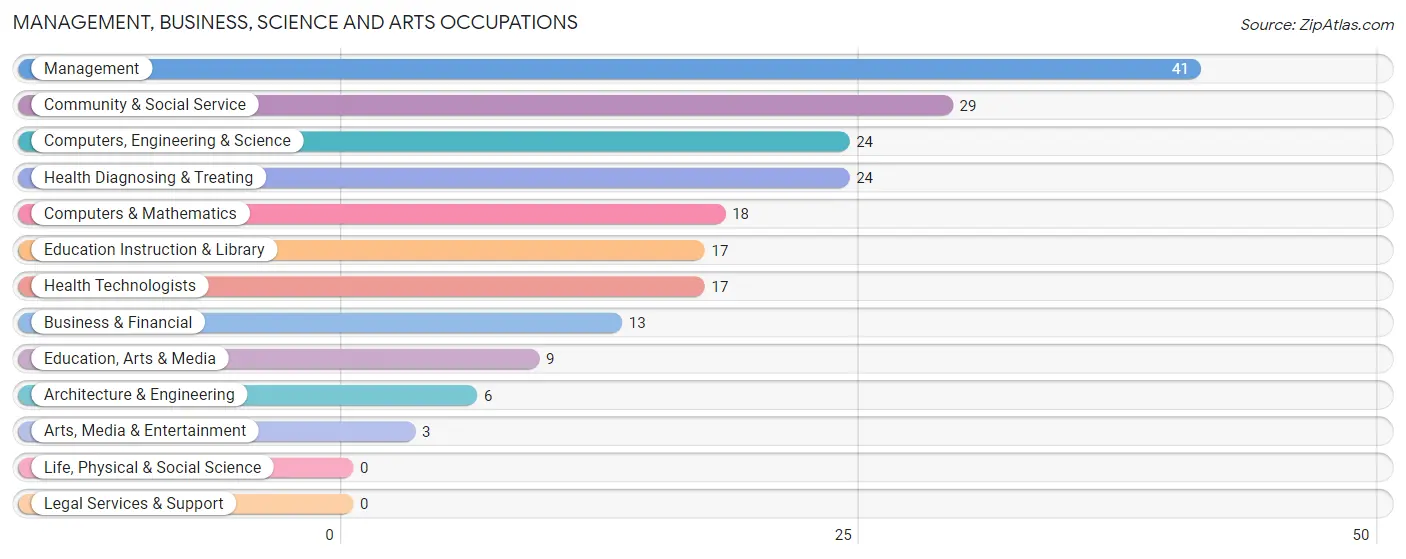
Management, Business, Science and Arts Occupations
The most common Management, Business, Science and Arts occupations in Pierceton are Management (41 | 5.9%), Community & Social Service (29 | 4.1%), Computers, Engineering & Science (24 | 3.4%), Health Diagnosing & Treating (24 | 3.4%), and Computers & Mathematics (18 | 2.6%).
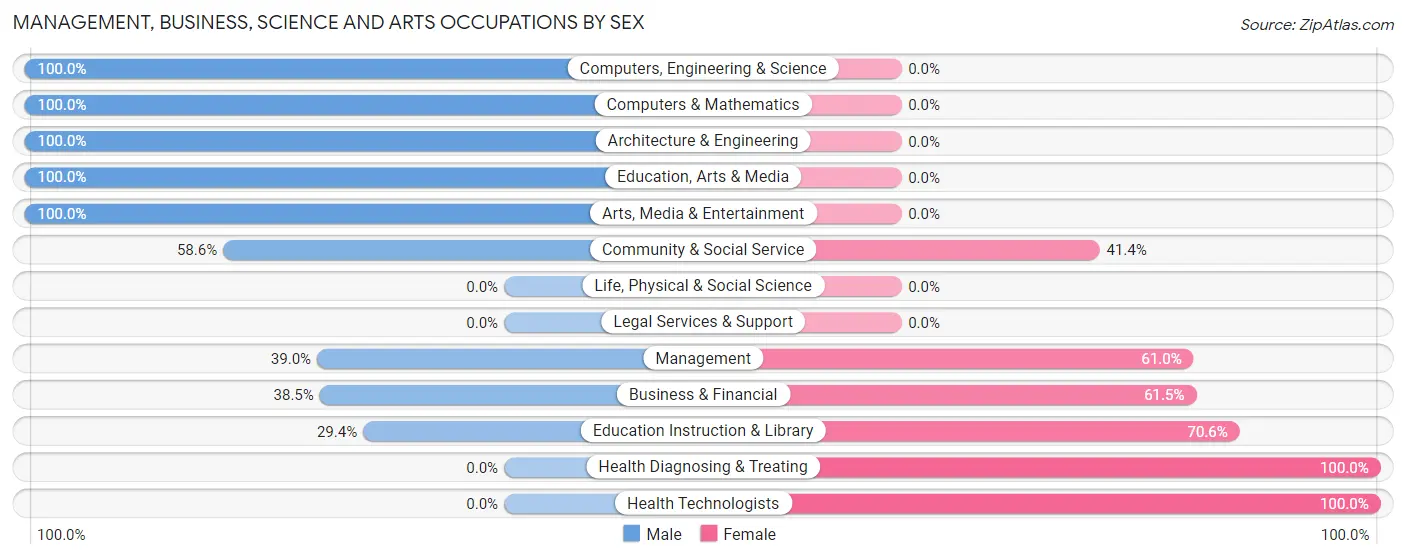
Management, Business, Science and Arts Occupations by Sex
Within the Management, Business, Science and Arts occupations in Pierceton, the most male-oriented occupations are Computers, Engineering & Science (100.0%), Computers & Mathematics (100.0%), and Architecture & Engineering (100.0%), while the most female-oriented occupations are Health Diagnosing & Treating (100.0%), Health Technologists (100.0%), and Education Instruction & Library (70.6%).
| Occupation | Male | Female |
| Management | 16 (39.0%) | 25 (61.0%) |
| Business & Financial | 5 (38.5%) | 8 (61.5%) |
| Computers, Engineering & Science | 24 (100.0%) | 0 (0.0%) |
| Computers & Mathematics | 18 (100.0%) | 0 (0.0%) |
| Architecture & Engineering | 6 (100.0%) | 0 (0.0%) |
| Life, Physical & Social Science | 0 (0.0%) | 0 (0.0%) |
| Community & Social Service | 17 (58.6%) | 12 (41.4%) |
| Education, Arts & Media | 9 (100.0%) | 0 (0.0%) |
| Legal Services & Support | 0 (0.0%) | 0 (0.0%) |
| Education Instruction & Library | 5 (29.4%) | 12 (70.6%) |
| Arts, Media & Entertainment | 3 (100.0%) | 0 (0.0%) |
| Health Diagnosing & Treating | 0 (0.0%) | 24 (100.0%) |
| Health Technologists | 0 (0.0%) | 17 (100.0%) |
| Total (Category) | 62 (47.3%) | 69 (52.7%) |
| Total (Overall) | 465 (66.4%) | 235 (33.6%) |
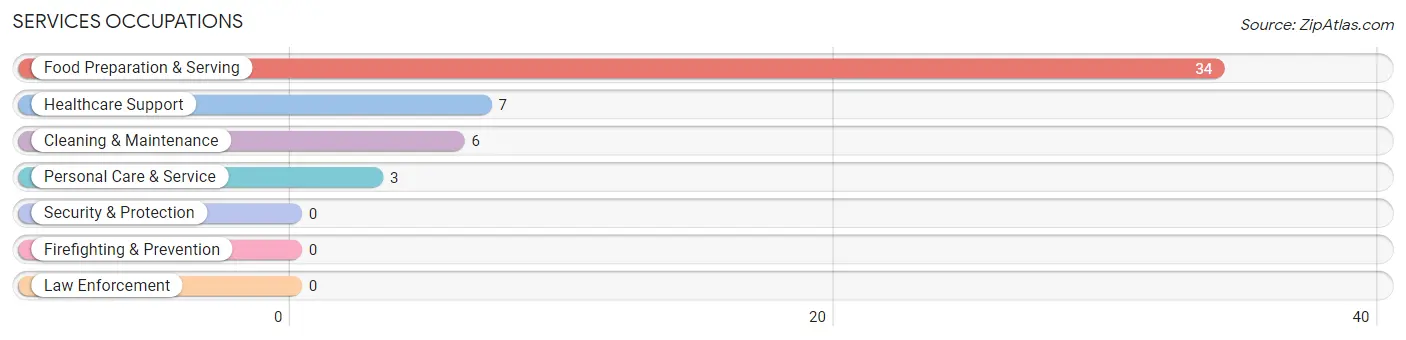
Services Occupations
The most common Services occupations in Pierceton are Food Preparation & Serving (34 | 4.9%), Healthcare Support (7 | 1.0%), Cleaning & Maintenance (6 | 0.9%), and Personal Care & Service (3 | 0.4%).
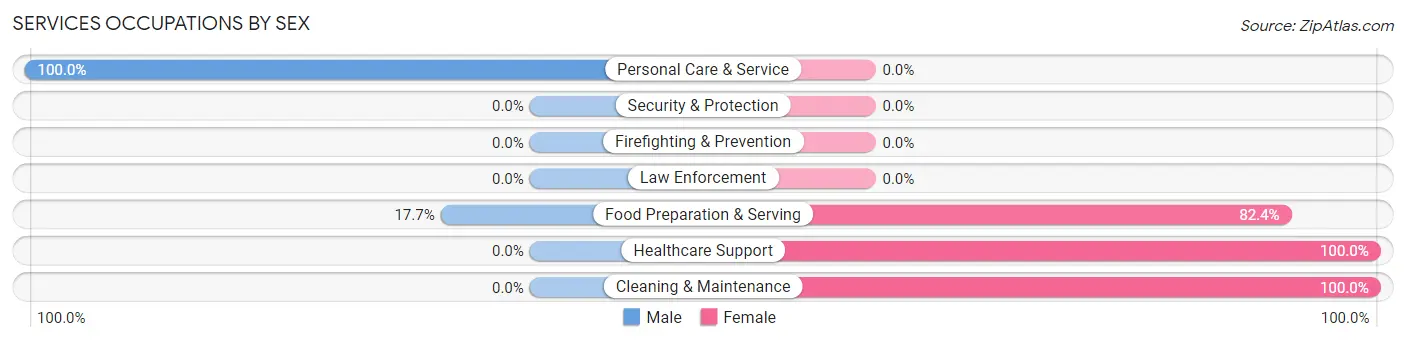
Services Occupations by Sex
Within the Services occupations in Pierceton, the most male-oriented occupations are Personal Care & Service (100.0%), and Food Preparation & Serving (17.6%), while the most female-oriented occupations are Healthcare Support (100.0%), Cleaning & Maintenance (100.0%), and Food Preparation & Serving (82.4%).
| Occupation | Male | Female |
| Healthcare Support | 0 (0.0%) | 7 (100.0%) |
| Security & Protection | 0 (0.0%) | 0 (0.0%) |
| Firefighting & Prevention | 0 (0.0%) | 0 (0.0%) |
| Law Enforcement | 0 (0.0%) | 0 (0.0%) |
| Food Preparation & Serving | 6 (17.6%) | 28 (82.4%) |
| Cleaning & Maintenance | 0 (0.0%) | 6 (100.0%) |
| Personal Care & Service | 3 (100.0%) | 0 (0.0%) |
| Total (Category) | 9 (18.0%) | 41 (82.0%) |
| Total (Overall) | 465 (66.4%) | 235 (33.6%) |
Sales and Office Occupations
The most common Sales and Office occupations in Pierceton are Sales & Related (55 | 7.9%), and Office & Administration (40 | 5.7%).
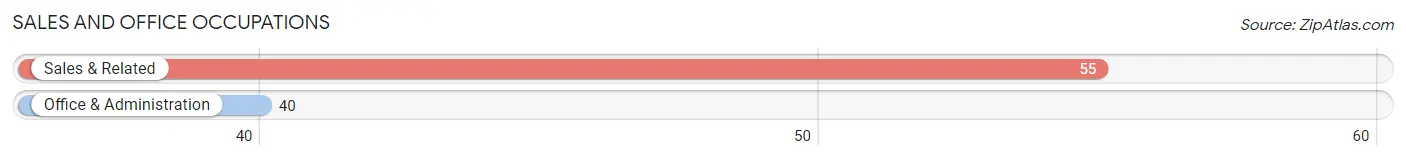
Sales and Office Occupations by Sex
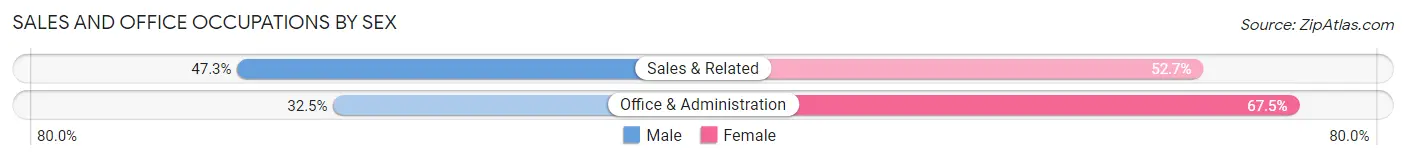
| Occupation | Male | Female |
| Sales & Related | 26 (47.3%) | 29 (52.7%) |
| Office & Administration | 13 (32.5%) | 27 (67.5%) |
| Total (Category) | 39 (41.0%) | 56 (59.0%) |
| Total (Overall) | 465 (66.4%) | 235 (33.6%) |
Natural Resources, Construction and Maintenance Occupations
The most common Natural Resources, Construction and Maintenance occupations in Pierceton are Construction & Extraction (33 | 4.7%), and Installation, Maintenance & Repair (10 | 1.4%).
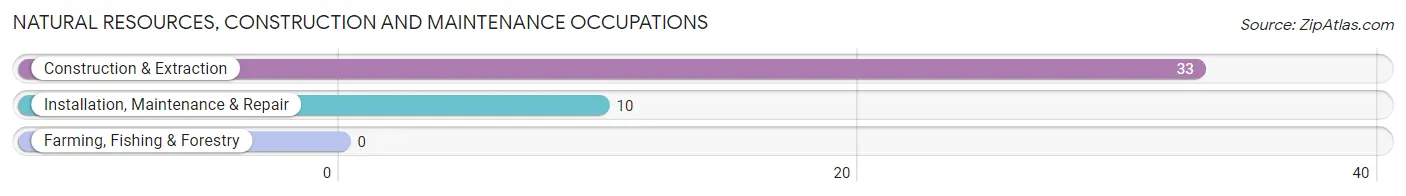
Natural Resources, Construction and Maintenance Occupations by Sex
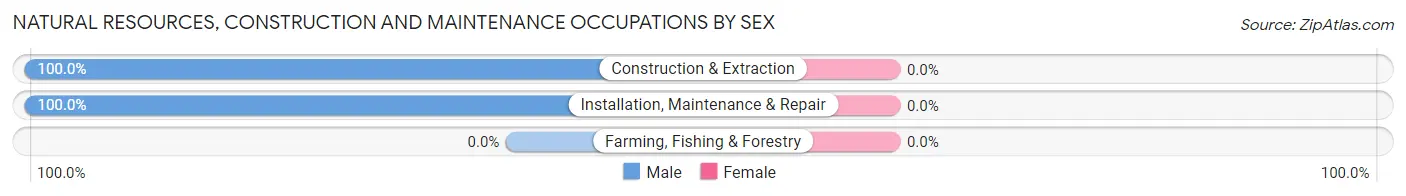
| Occupation | Male | Female |
| Farming, Fishing & Forestry | 0 (0.0%) | 0 (0.0%) |
| Construction & Extraction | 33 (100.0%) | 0 (0.0%) |
| Installation, Maintenance & Repair | 10 (100.0%) | 0 (0.0%) |
| Total (Category) | 43 (100.0%) | 0 (0.0%) |
| Total (Overall) | 465 (66.4%) | 235 (33.6%) |
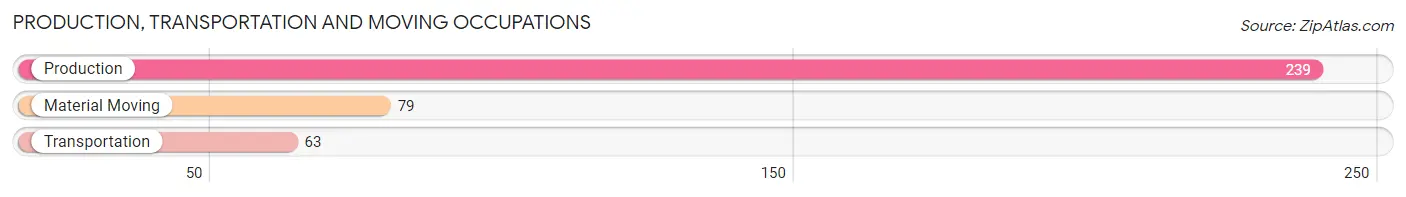
Production, Transportation and Moving Occupations
The most common Production, Transportation and Moving occupations in Pierceton are Production (239 | 34.1%), Material Moving (79 | 11.3%), and Transportation (63 | 9.0%).
Production, Transportation and Moving Occupations by Sex
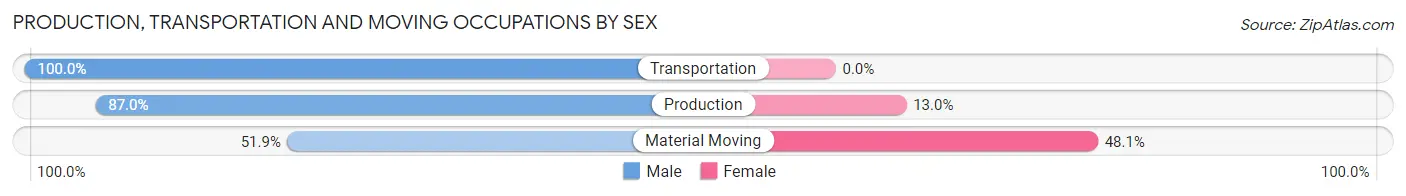
| Occupation | Male | Female |
| Production | 208 (87.0%) | 31 (13.0%) |
| Transportation | 63 (100.0%) | 0 (0.0%) |
| Material Moving | 41 (51.9%) | 38 (48.1%) |
| Total (Category) | 312 (81.9%) | 69 (18.1%) |
| Total (Overall) | 465 (66.4%) | 235 (33.6%) |
Employment Industries by Sex in Pierceton
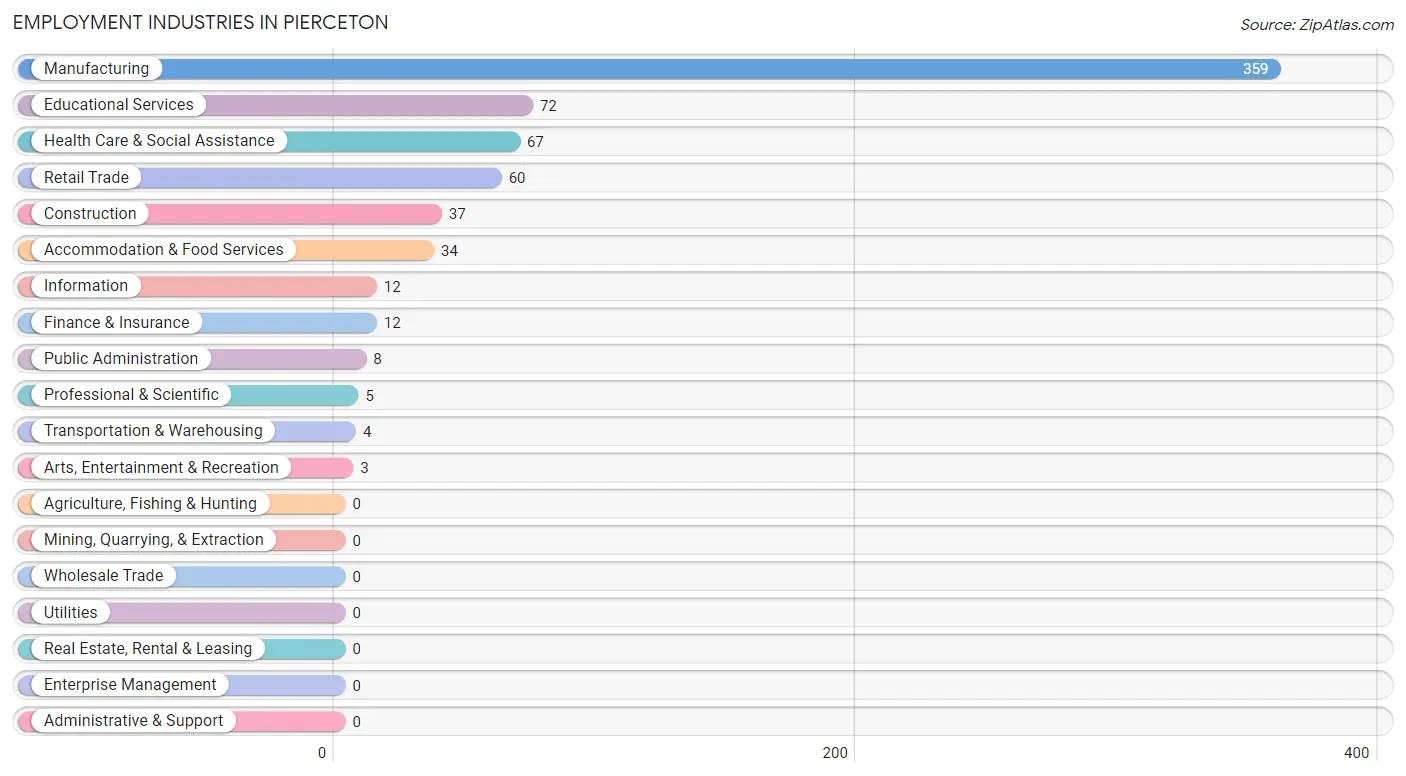
Employment Industries in Pierceton
The major employment industries in Pierceton include Manufacturing (359 | 51.3%), Educational Services (72 | 10.3%), Health Care & Social Assistance (67 | 9.6%), Retail Trade (60 | 8.6%), and Construction (37 | 5.3%).
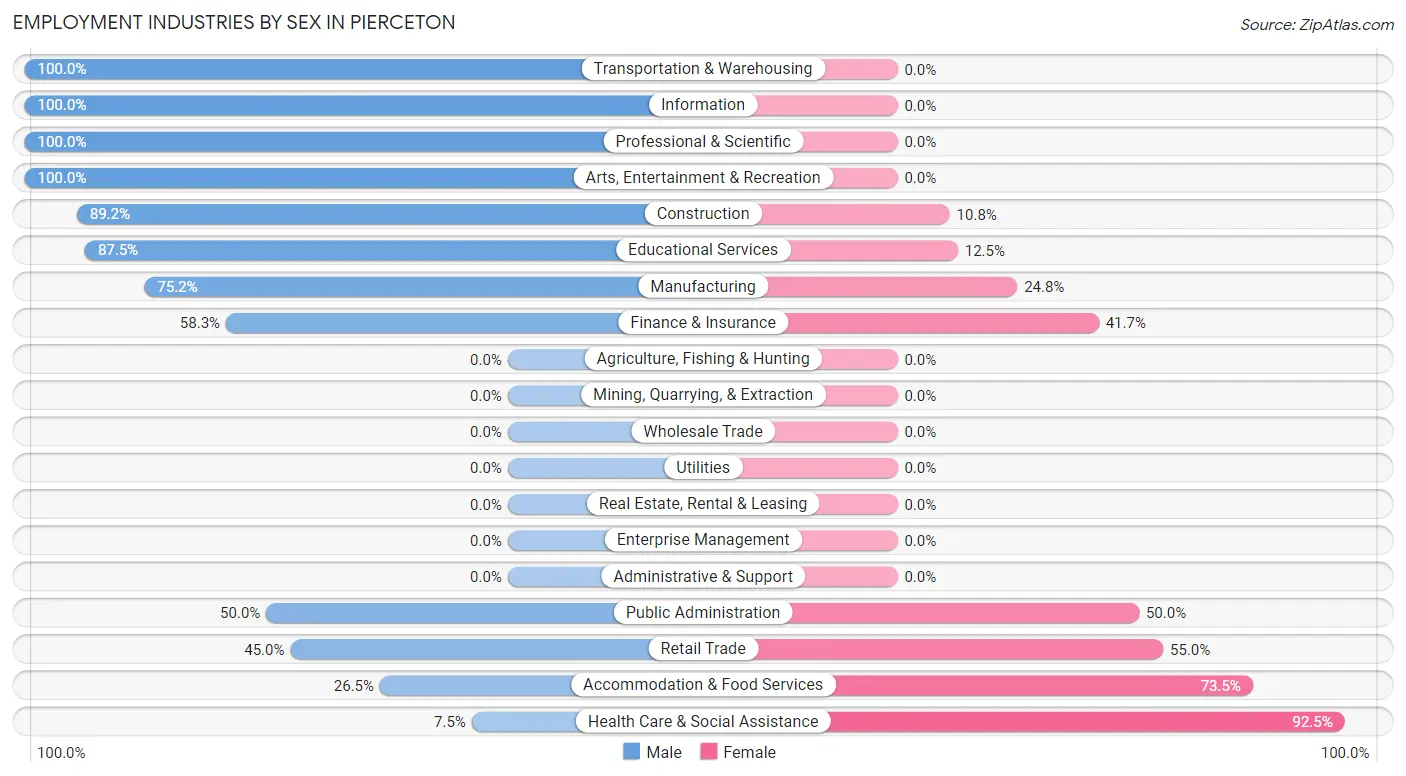
Employment Industries by Sex in Pierceton
The Pierceton industries that see more men than women are Transportation & Warehousing (100.0%), Information (100.0%), and Professional & Scientific (100.0%), whereas the industries that tend to have a higher number of women are Health Care & Social Assistance (92.5%), Accommodation & Food Services (73.5%), and Retail Trade (55.0%).
| Industry | Male | Female |
| Agriculture, Fishing & Hunting | 0 (0.0%) | 0 (0.0%) |
| Mining, Quarrying, & Extraction | 0 (0.0%) | 0 (0.0%) |
| Construction | 33 (89.2%) | 4 (10.8%) |
| Manufacturing | 270 (75.2%) | 89 (24.8%) |
| Wholesale Trade | 0 (0.0%) | 0 (0.0%) |
| Retail Trade | 27 (45.0%) | 33 (55.0%) |
| Transportation & Warehousing | 4 (100.0%) | 0 (0.0%) |
| Utilities | 0 (0.0%) | 0 (0.0%) |
| Information | 12 (100.0%) | 0 (0.0%) |
| Finance & Insurance | 7 (58.3%) | 5 (41.7%) |
| Real Estate, Rental & Leasing | 0 (0.0%) | 0 (0.0%) |
| Professional & Scientific | 5 (100.0%) | 0 (0.0%) |
| Enterprise Management | 0 (0.0%) | 0 (0.0%) |
| Administrative & Support | 0 (0.0%) | 0 (0.0%) |
| Educational Services | 63 (87.5%) | 9 (12.5%) |
| Health Care & Social Assistance | 5 (7.5%) | 62 (92.5%) |
| Arts, Entertainment & Recreation | 3 (100.0%) | 0 (0.0%) |
| Accommodation & Food Services | 9 (26.5%) | 25 (73.5%) |
| Public Administration | 4 (50.0%) | 4 (50.0%) |
| Total | 465 (66.4%) | 235 (33.6%) |
Education in Pierceton
School Enrollment in Pierceton
The most common levels of schooling among the 363 students in Pierceton are elementary school (96 | 26.5%), high school (95 | 26.2%), and middle school (92 | 25.3%).
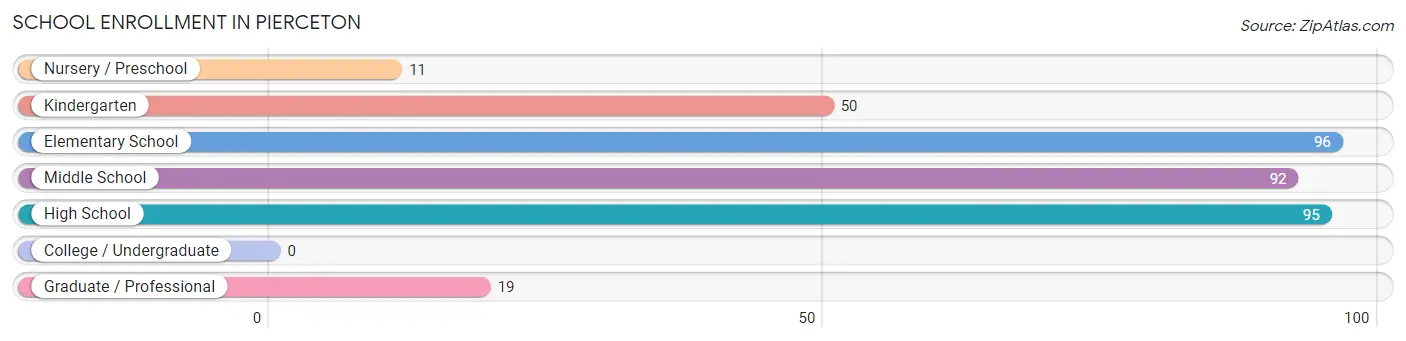
| School Level | # Students | % Students |
| Nursery / Preschool | 11 | 3.0% |
| Kindergarten | 50 | 13.8% |
| Elementary School | 96 | 26.5% |
| Middle School | 92 | 25.3% |
| High School | 95 | 26.2% |
| College / Undergraduate | 0 | 0.0% |
| Graduate / Professional | 19 | 5.2% |
| Total | 363 | 100.0% |
School Enrollment by Age by Funding Source in Pierceton
Out of a total of 363 students who are enrolled in schools in Pierceton, 72 (19.8%) attend a private institution, while the remaining 291 (80.2%) are enrolled in public schools. The age group of 3 to 4 year olds has the highest likelihood of being enrolled in private schools, with 16 (100.0% in the age bracket) enrolled. Conversely, the age group of 10 to 14 year olds has the lowest likelihood of being enrolled in a private school, with 118 (100.0% in the age bracket) attending a public institution.
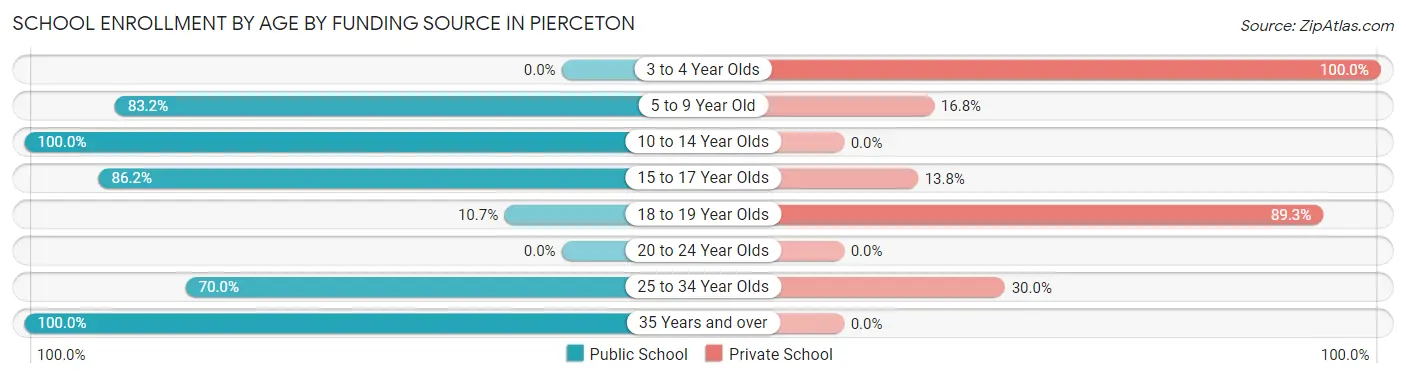
| Age Bracket | Public School | Private School |
| 3 to 4 Year Olds | 0 (0.0%) | 16 (100.0%) |
| 5 to 9 Year Old | 99 (83.2%) | 20 (16.8%) |
| 10 to 14 Year Olds | 118 (100.0%) | 0 (0.0%) |
| 15 to 17 Year Olds | 50 (86.2%) | 8 (13.8%) |
| 18 to 19 Year Olds | 3 (10.7%) | 25 (89.3%) |
| 20 to 24 Year Olds | 0 (0.0%) | 0 (0.0%) |
| 25 to 34 Year Olds | 7 (70.0%) | 3 (30.0%) |
| 35 Years and over | 14 (100.0%) | 0 (0.0%) |
| Total | 291 (80.2%) | 72 (19.8%) |
Educational Attainment by Field of Study in Pierceton
Liberal arts & history (58 | 36.7%), business (22 | 13.9%), engineering (20 | 12.7%), education (19 | 12.0%), and science & technology (18 | 11.4%) are the most common fields of study among 158 individuals in Pierceton who have obtained a bachelor's degree or higher.
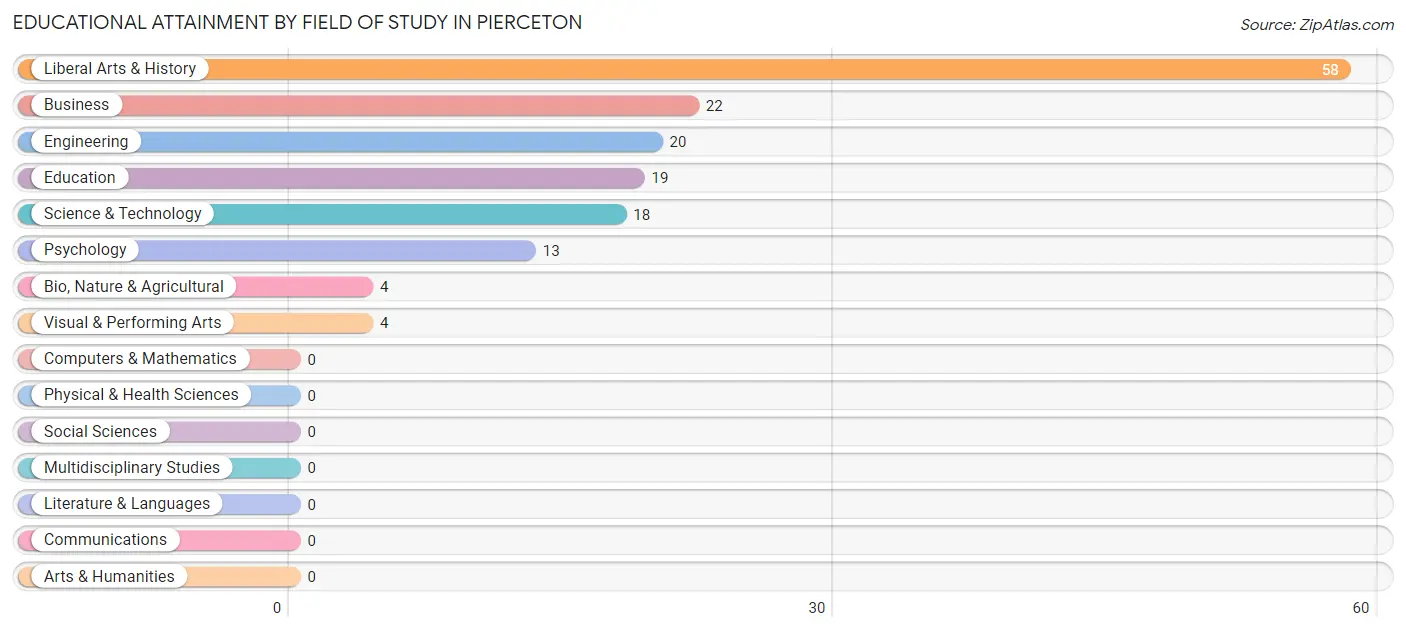
| Field of Study | # Graduates | % Graduates |
| Computers & Mathematics | 0 | 0.0% |
| Bio, Nature & Agricultural | 4 | 2.5% |
| Physical & Health Sciences | 0 | 0.0% |
| Psychology | 13 | 8.2% |
| Social Sciences | 0 | 0.0% |
| Engineering | 20 | 12.7% |
| Multidisciplinary Studies | 0 | 0.0% |
| Science & Technology | 18 | 11.4% |
| Business | 22 | 13.9% |
| Education | 19 | 12.0% |
| Literature & Languages | 0 | 0.0% |
| Liberal Arts & History | 58 | 36.7% |
| Visual & Performing Arts | 4 | 2.5% |
| Communications | 0 | 0.0% |
| Arts & Humanities | 0 | 0.0% |
| Total | 158 | 100.0% |
Transportation & Commute in Pierceton
Vehicle Availability by Sex in Pierceton
The most prevalent vehicle ownership categories in Pierceton are males with 2 vehicles (286, accounting for 61.5%) and females with 2 vehicles (97, making up 121.7%).
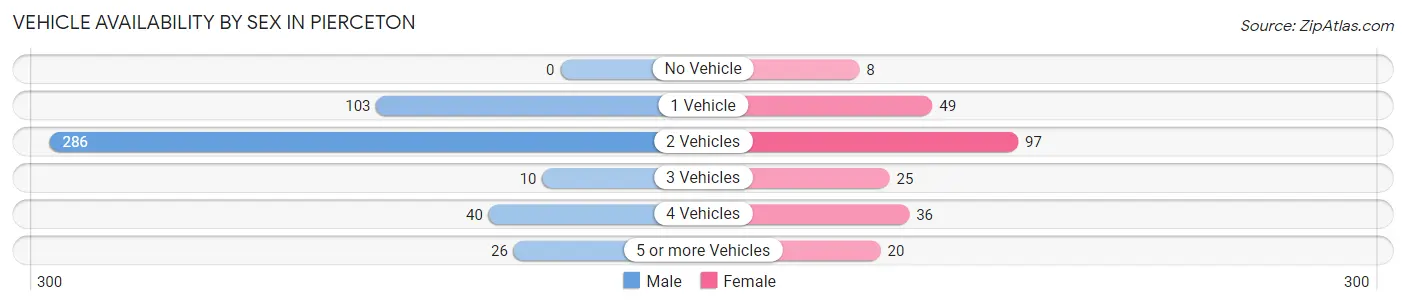
| Vehicles Available | Male | Female |
| No Vehicle | 0 (0.0%) | 8 (3.4%) |
| 1 Vehicle | 103 (22.2%) | 49 (20.8%) |
| 2 Vehicles | 286 (61.5%) | 97 (41.3%) |
| 3 Vehicles | 10 (2.1%) | 25 (10.6%) |
| 4 Vehicles | 40 (8.6%) | 36 (15.3%) |
| 5 or more Vehicles | 26 (5.6%) | 20 (8.5%) |
| Total | 465 (100.0%) | 235 (100.0%) |
Commute Time in Pierceton
The most frequently occuring commute durations in Pierceton are 15 to 19 minutes (167 commuters, 24.2%), 5 to 9 minutes (106 commuters, 15.4%), and 45 to 59 minutes (87 commuters, 12.6%).
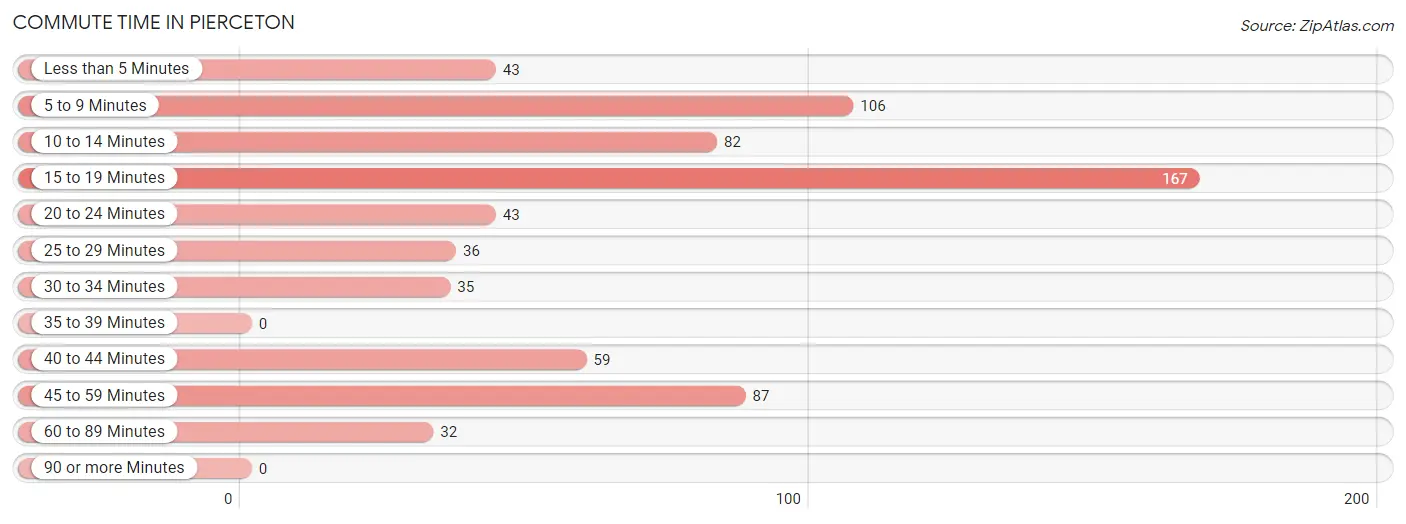
| Commute Time | # Commuters | % Commuters |
| Less than 5 Minutes | 43 | 6.2% |
| 5 to 9 Minutes | 106 | 15.4% |
| 10 to 14 Minutes | 82 | 11.9% |
| 15 to 19 Minutes | 167 | 24.2% |
| 20 to 24 Minutes | 43 | 6.2% |
| 25 to 29 Minutes | 36 | 5.2% |
| 30 to 34 Minutes | 35 | 5.1% |
| 35 to 39 Minutes | 0 | 0.0% |
| 40 to 44 Minutes | 59 | 8.6% |
| 45 to 59 Minutes | 87 | 12.6% |
| 60 to 89 Minutes | 32 | 4.6% |
| 90 or more Minutes | 0 | 0.0% |
Commute Time by Sex in Pierceton
The most common commute times in Pierceton are 15 to 19 minutes (114 commuters, 24.9%) for males and 15 to 19 minutes (53 commuters, 22.8%) for females.
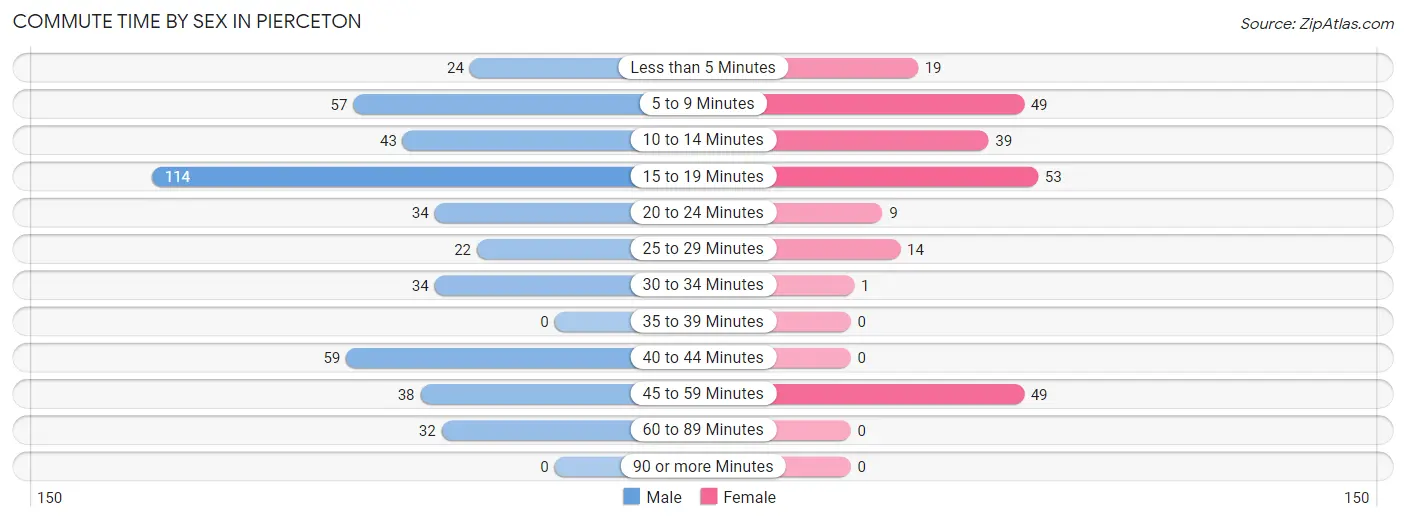
| Commute Time | Male | Female |
| Less than 5 Minutes | 24 (5.2%) | 19 (8.2%) |
| 5 to 9 Minutes | 57 (12.5%) | 49 (21.0%) |
| 10 to 14 Minutes | 43 (9.4%) | 39 (16.7%) |
| 15 to 19 Minutes | 114 (24.9%) | 53 (22.8%) |
| 20 to 24 Minutes | 34 (7.4%) | 9 (3.9%) |
| 25 to 29 Minutes | 22 (4.8%) | 14 (6.0%) |
| 30 to 34 Minutes | 34 (7.4%) | 1 (0.4%) |
| 35 to 39 Minutes | 0 (0.0%) | 0 (0.0%) |
| 40 to 44 Minutes | 59 (12.9%) | 0 (0.0%) |
| 45 to 59 Minutes | 38 (8.3%) | 49 (21.0%) |
| 60 to 89 Minutes | 32 (7.0%) | 0 (0.0%) |
| 90 or more Minutes | 0 (0.0%) | 0 (0.0%) |
Time of Departure to Work by Sex in Pierceton
The most frequent times of departure to work in Pierceton are 6:30 AM to 6:59 AM (80, 17.5%) for males and 6:00 AM to 6:29 AM (46, 19.7%) for females.
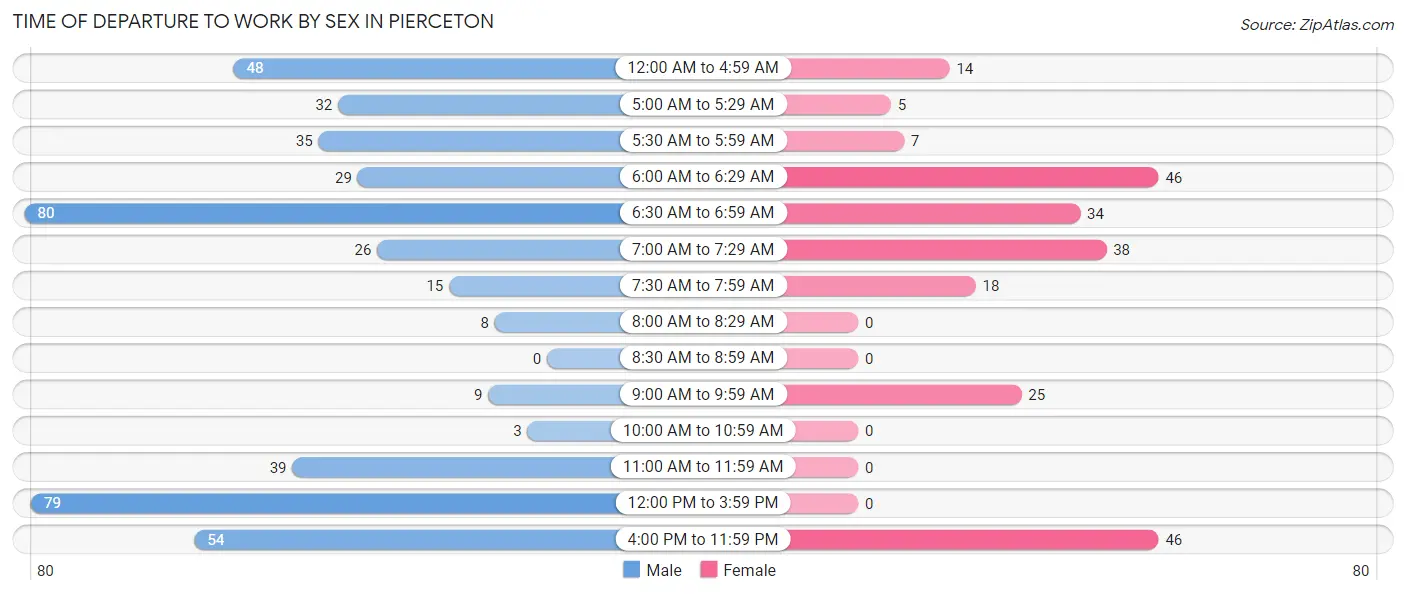
| Time of Departure | Male | Female |
| 12:00 AM to 4:59 AM | 48 (10.5%) | 14 (6.0%) |
| 5:00 AM to 5:29 AM | 32 (7.0%) | 5 (2.1%) |
| 5:30 AM to 5:59 AM | 35 (7.7%) | 7 (3.0%) |
| 6:00 AM to 6:29 AM | 29 (6.4%) | 46 (19.7%) |
| 6:30 AM to 6:59 AM | 80 (17.5%) | 34 (14.6%) |
| 7:00 AM to 7:29 AM | 26 (5.7%) | 38 (16.3%) |
| 7:30 AM to 7:59 AM | 15 (3.3%) | 18 (7.7%) |
| 8:00 AM to 8:29 AM | 8 (1.8%) | 0 (0.0%) |
| 8:30 AM to 8:59 AM | 0 (0.0%) | 0 (0.0%) |
| 9:00 AM to 9:59 AM | 9 (2.0%) | 25 (10.7%) |
| 10:00 AM to 10:59 AM | 3 (0.7%) | 0 (0.0%) |
| 11:00 AM to 11:59 AM | 39 (8.5%) | 0 (0.0%) |
| 12:00 PM to 3:59 PM | 79 (17.3%) | 0 (0.0%) |
| 4:00 PM to 11:59 PM | 54 (11.8%) | 46 (19.7%) |
| Total | 457 (100.0%) | 233 (100.0%) |
Housing Occupancy in Pierceton
Occupancy by Ownership in Pierceton
Of the total 597 dwellings in Pierceton, owner-occupied units account for 377 (63.1%), while renter-occupied units make up 220 (36.8%).
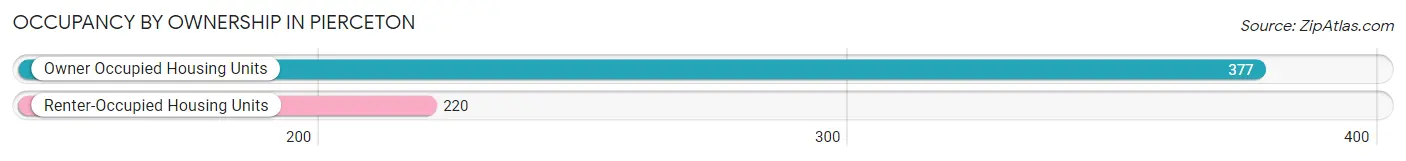
| Occupancy | # Housing Units | % Housing Units |
| Owner Occupied Housing Units | 377 | 63.1% |
| Renter-Occupied Housing Units | 220 | 36.8% |
| Total Occupied Housing Units | 597 | 100.0% |
Occupancy by Household Size in Pierceton
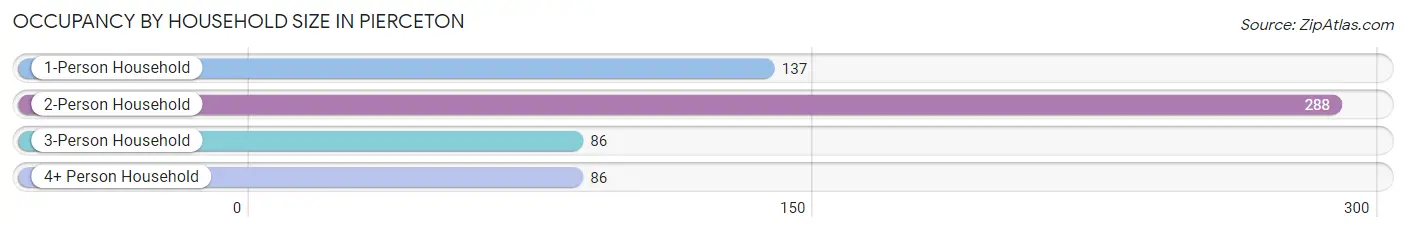
| Household Size | # Housing Units | % Housing Units |
| 1-Person Household | 137 | 23.0% |
| 2-Person Household | 288 | 48.2% |
| 3-Person Household | 86 | 14.4% |
| 4+ Person Household | 86 | 14.4% |
| Total Housing Units | 597 | 100.0% |
Occupancy by Ownership by Household Size in Pierceton
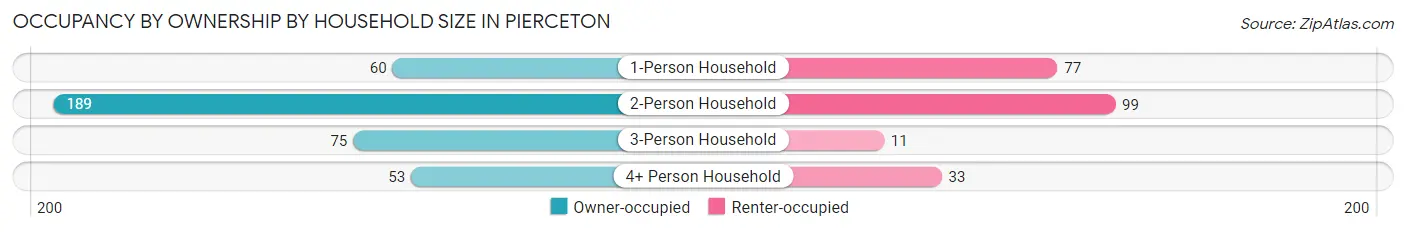
| Household Size | Owner-occupied | Renter-occupied |
| 1-Person Household | 60 (43.8%) | 77 (56.2%) |
| 2-Person Household | 189 (65.6%) | 99 (34.4%) |
| 3-Person Household | 75 (87.2%) | 11 (12.8%) |
| 4+ Person Household | 53 (61.6%) | 33 (38.4%) |
| Total Housing Units | 377 (63.1%) | 220 (36.8%) |
Occupancy by Educational Attainment in Pierceton
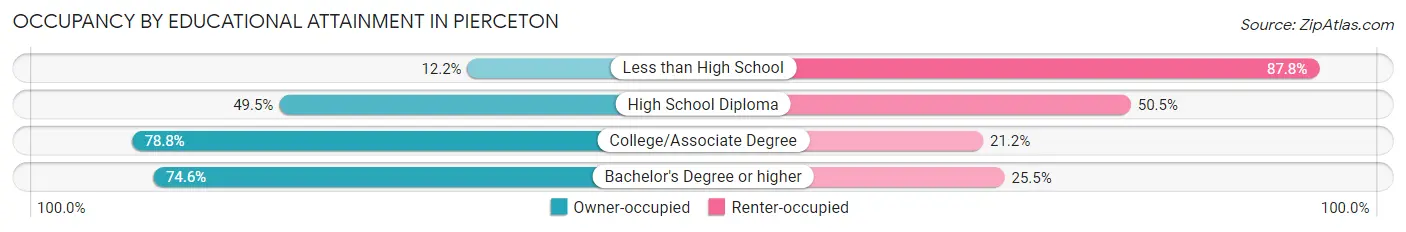
| Household Size | Owner-occupied | Renter-occupied |
| Less than High School | 5 (12.2%) | 36 (87.8%) |
| High School Diploma | 104 (49.5%) | 106 (50.5%) |
| College/Associate Degree | 186 (78.8%) | 50 (21.2%) |
| Bachelor's Degree or higher | 82 (74.6%) | 28 (25.5%) |
Occupancy by Age of Householder in Pierceton
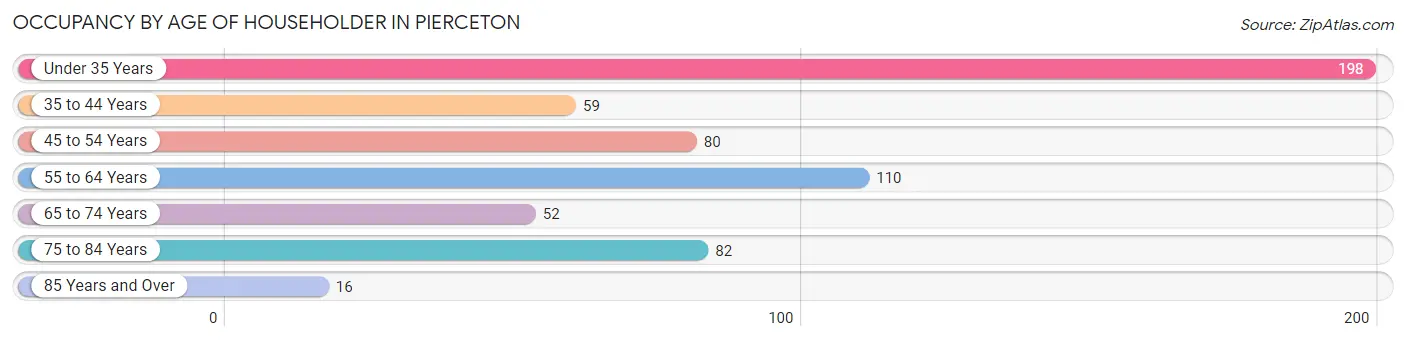
| Age Bracket | # Households | % Households |
| Under 35 Years | 198 | 33.2% |
| 35 to 44 Years | 59 | 9.9% |
| 45 to 54 Years | 80 | 13.4% |
| 55 to 64 Years | 110 | 18.4% |
| 65 to 74 Years | 52 | 8.7% |
| 75 to 84 Years | 82 | 13.7% |
| 85 Years and Over | 16 | 2.7% |
| Total | 597 | 100.0% |
Housing Finances in Pierceton
Median Income by Occupancy in Pierceton
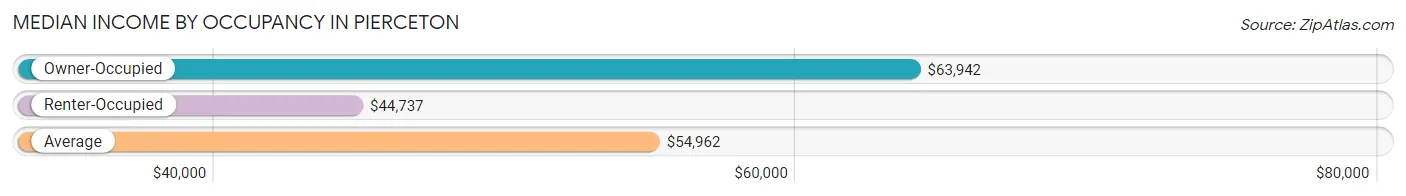
| Occupancy Type | # Households | Median Income |
| Owner-Occupied | 377 (63.1%) | $63,942 |
| Renter-Occupied | 220 (36.8%) | $44,737 |
| Average | 597 (100.0%) | $54,962 |
Occupancy by Householder Income Bracket in Pierceton
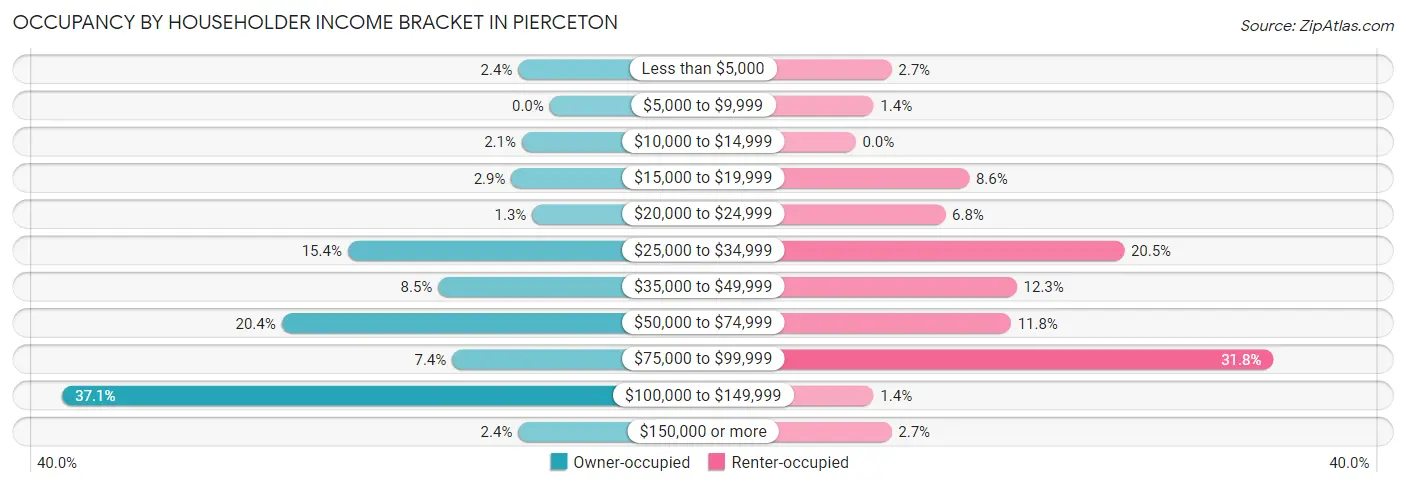
| Income Bracket | Owner-occupied | Renter-occupied |
| Less than $5,000 | 9 (2.4%) | 6 (2.7%) |
| $5,000 to $9,999 | 0 (0.0%) | 3 (1.4%) |
| $10,000 to $14,999 | 8 (2.1%) | 0 (0.0%) |
| $15,000 to $19,999 | 11 (2.9%) | 19 (8.6%) |
| $20,000 to $24,999 | 5 (1.3%) | 15 (6.8%) |
| $25,000 to $34,999 | 58 (15.4%) | 45 (20.4%) |
| $35,000 to $49,999 | 32 (8.5%) | 27 (12.3%) |
| $50,000 to $74,999 | 77 (20.4%) | 26 (11.8%) |
| $75,000 to $99,999 | 28 (7.4%) | 70 (31.8%) |
| $100,000 to $149,999 | 140 (37.1%) | 3 (1.4%) |
| $150,000 or more | 9 (2.4%) | 6 (2.7%) |
| Total | 377 (100.0%) | 220 (100.0%) |
Monthly Housing Cost Tiers in Pierceton
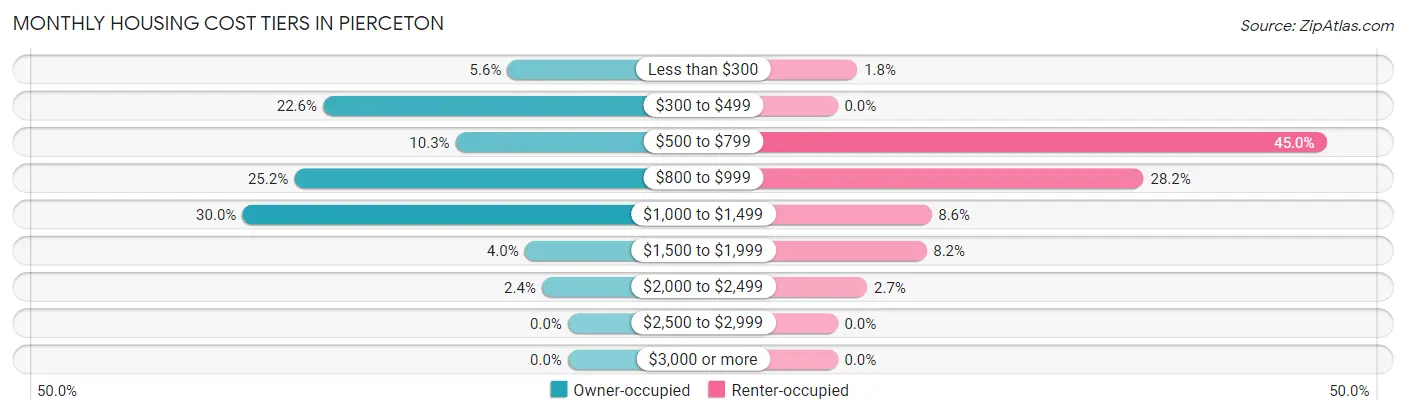
| Monthly Cost | Owner-occupied | Renter-occupied |
| Less than $300 | 21 (5.6%) | 4 (1.8%) |
| $300 to $499 | 85 (22.6%) | 0 (0.0%) |
| $500 to $799 | 39 (10.3%) | 99 (45.0%) |
| $800 to $999 | 95 (25.2%) | 62 (28.2%) |
| $1,000 to $1,499 | 113 (30.0%) | 19 (8.6%) |
| $1,500 to $1,999 | 15 (4.0%) | 18 (8.2%) |
| $2,000 to $2,499 | 9 (2.4%) | 6 (2.7%) |
| $2,500 to $2,999 | 0 (0.0%) | 0 (0.0%) |
| $3,000 or more | 0 (0.0%) | 0 (0.0%) |
| Total | 377 (100.0%) | 220 (100.0%) |
Physical Housing Characteristics in Pierceton
Housing Structures in Pierceton
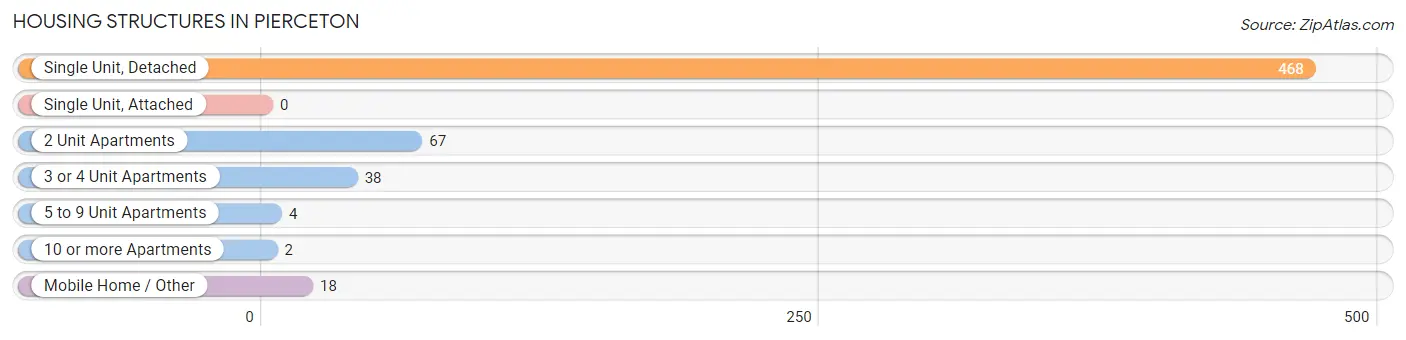
| Structure Type | # Housing Units | % Housing Units |
| Single Unit, Detached | 468 | 78.4% |
| Single Unit, Attached | 0 | 0.0% |
| 2 Unit Apartments | 67 | 11.2% |
| 3 or 4 Unit Apartments | 38 | 6.4% |
| 5 to 9 Unit Apartments | 4 | 0.7% |
| 10 or more Apartments | 2 | 0.3% |
| Mobile Home / Other | 18 | 3.0% |
| Total | 597 | 100.0% |
Housing Structures by Occupancy in Pierceton
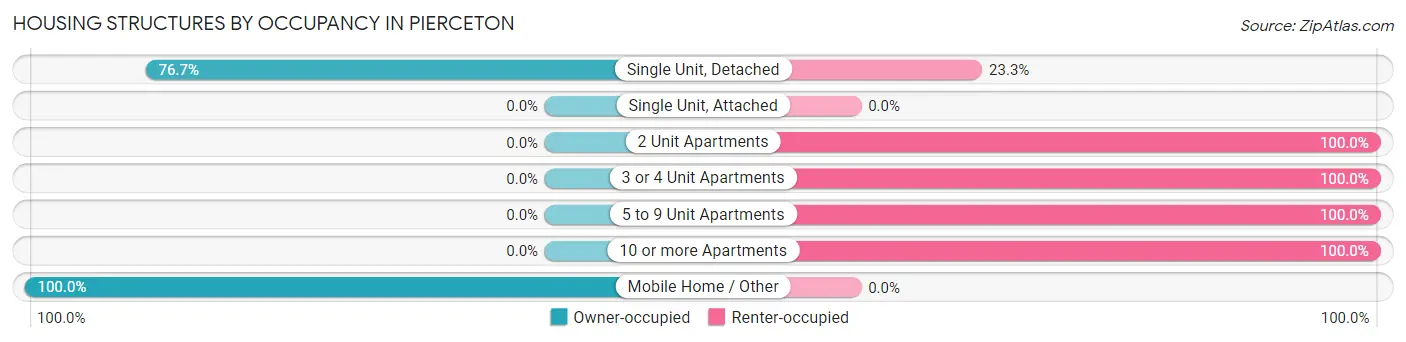
| Structure Type | Owner-occupied | Renter-occupied |
| Single Unit, Detached | 359 (76.7%) | 109 (23.3%) |
| Single Unit, Attached | 0 (0.0%) | 0 (0.0%) |
| 2 Unit Apartments | 0 (0.0%) | 67 (100.0%) |
| 3 or 4 Unit Apartments | 0 (0.0%) | 38 (100.0%) |
| 5 to 9 Unit Apartments | 0 (0.0%) | 4 (100.0%) |
| 10 or more Apartments | 0 (0.0%) | 2 (100.0%) |
| Mobile Home / Other | 18 (100.0%) | 0 (0.0%) |
| Total | 377 (63.1%) | 220 (36.8%) |
Housing Structures by Number of Rooms in Pierceton
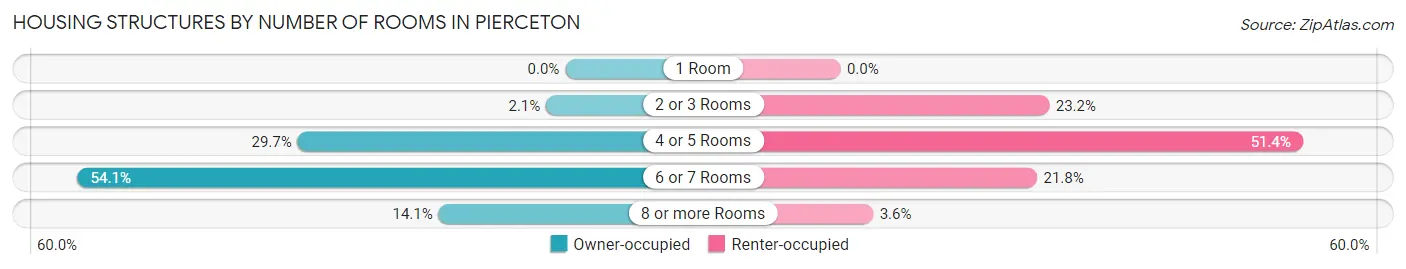
| Number of Rooms | Owner-occupied | Renter-occupied |
| 1 Room | 0 (0.0%) | 0 (0.0%) |
| 2 or 3 Rooms | 8 (2.1%) | 51 (23.2%) |
| 4 or 5 Rooms | 112 (29.7%) | 113 (51.4%) |
| 6 or 7 Rooms | 204 (54.1%) | 48 (21.8%) |
| 8 or more Rooms | 53 (14.1%) | 8 (3.6%) |
| Total | 377 (100.0%) | 220 (100.0%) |
Housing Structure by Heating Type in Pierceton
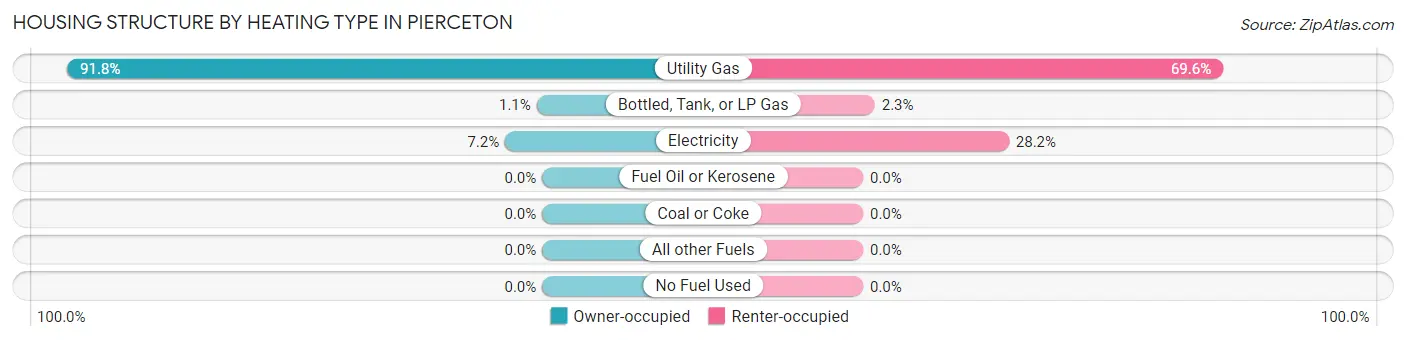
| Heating Type | Owner-occupied | Renter-occupied |
| Utility Gas | 346 (91.8%) | 153 (69.6%) |
| Bottled, Tank, or LP Gas | 4 (1.1%) | 5 (2.3%) |
| Electricity | 27 (7.2%) | 62 (28.2%) |
| Fuel Oil or Kerosene | 0 (0.0%) | 0 (0.0%) |
| Coal or Coke | 0 (0.0%) | 0 (0.0%) |
| All other Fuels | 0 (0.0%) | 0 (0.0%) |
| No Fuel Used | 0 (0.0%) | 0 (0.0%) |
| Total | 377 (100.0%) | 220 (100.0%) |
Household Vehicle Usage in Pierceton
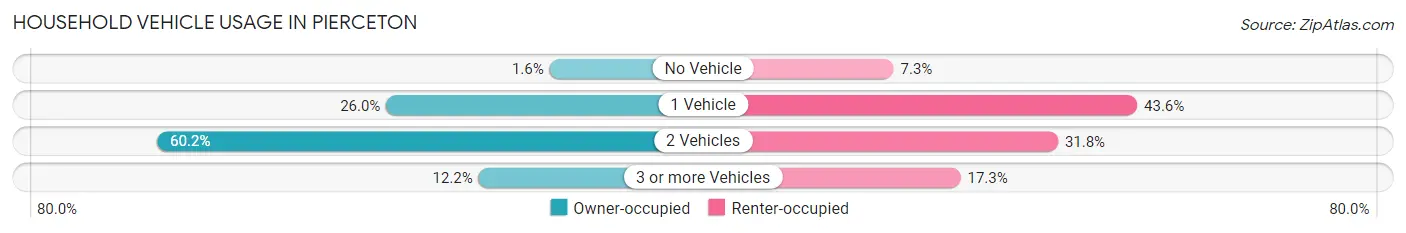
| Vehicles per Household | Owner-occupied | Renter-occupied |
| No Vehicle | 6 (1.6%) | 16 (7.3%) |
| 1 Vehicle | 98 (26.0%) | 96 (43.6%) |
| 2 Vehicles | 227 (60.2%) | 70 (31.8%) |
| 3 or more Vehicles | 46 (12.2%) | 38 (17.3%) |
| Total | 377 (100.0%) | 220 (100.0%) |
Real Estate & Mortgages in Pierceton
Real Estate and Mortgage Overview in Pierceton
| Characteristic | Without Mortgage | With Mortgage |
| Housing Units | 131 | 246 |
| Median Property Value | $87,400 | $107,300 |
| Median Household Income | $29,196 | $5 |
| Monthly Housing Costs | $383 | $0 |
| Real Estate Taxes | - | - |
Property Value by Mortgage Status in Pierceton
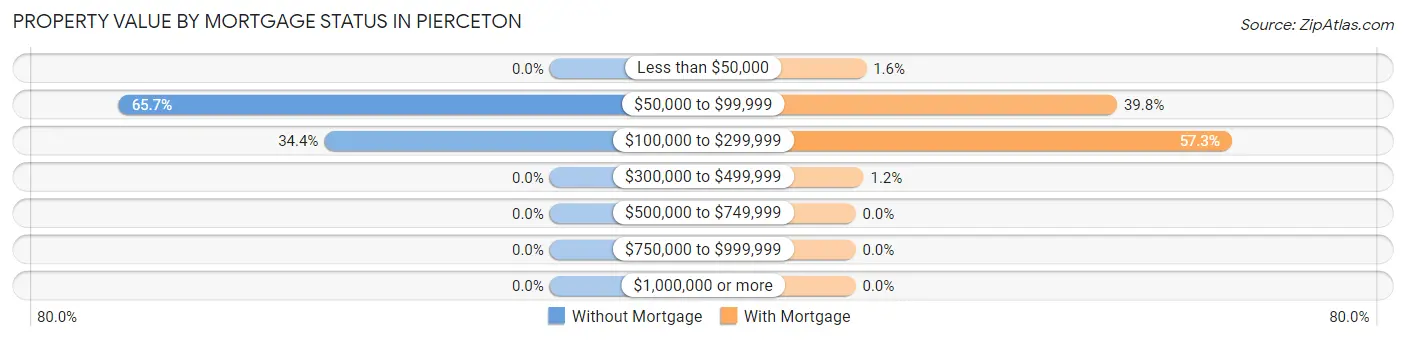
| Property Value | Without Mortgage | With Mortgage |
| Less than $50,000 | 0 (0.0%) | 4 (1.6%) |
| $50,000 to $99,999 | 86 (65.6%) | 98 (39.8%) |
| $100,000 to $299,999 | 45 (34.4%) | 141 (57.3%) |
| $300,000 to $499,999 | 0 (0.0%) | 3 (1.2%) |
| $500,000 to $749,999 | 0 (0.0%) | 0 (0.0%) |
| $750,000 to $999,999 | 0 (0.0%) | 0 (0.0%) |
| $1,000,000 or more | 0 (0.0%) | 0 (0.0%) |
| Total | 131 (100.0%) | 246 (100.0%) |
Household Income by Mortgage Status in Pierceton
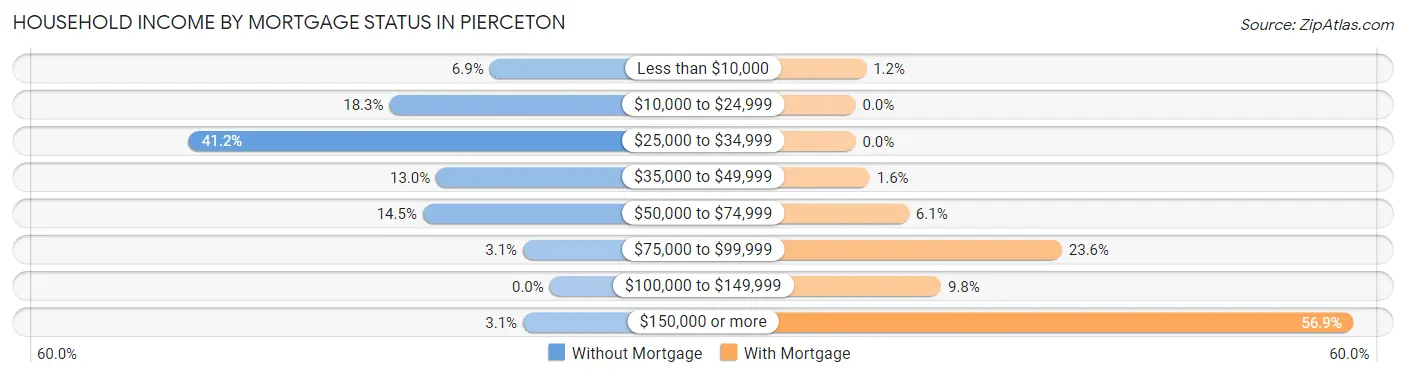
| Household Income | Without Mortgage | With Mortgage |
| Less than $10,000 | 9 (6.9%) | 3 (1.2%) |
| $10,000 to $24,999 | 24 (18.3%) | 0 (0.0%) |
| $25,000 to $34,999 | 54 (41.2%) | 0 (0.0%) |
| $35,000 to $49,999 | 17 (13.0%) | 4 (1.6%) |
| $50,000 to $74,999 | 19 (14.5%) | 15 (6.1%) |
| $75,000 to $99,999 | 4 (3.0%) | 58 (23.6%) |
| $100,000 to $149,999 | 0 (0.0%) | 24 (9.8%) |
| $150,000 or more | 4 (3.0%) | 140 (56.9%) |
| Total | 131 (100.0%) | 246 (100.0%) |
Property Value to Household Income Ratio in Pierceton
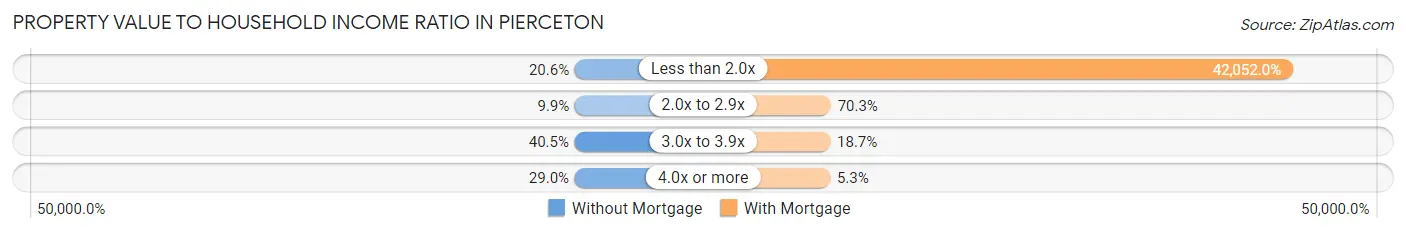
| Value-to-Income Ratio | Without Mortgage | With Mortgage |
| Less than 2.0x | 27 (20.6%) | 103,448 (42,052.0%) |
| 2.0x to 2.9x | 13 (9.9%) | 173 (70.3%) |
| 3.0x to 3.9x | 53 (40.5%) | 46 (18.7%) |
| 4.0x or more | 38 (29.0%) | 13 (5.3%) |
| Total | 131 (100.0%) | 246 (100.0%) |
Real Estate Taxes by Mortgage Status in Pierceton
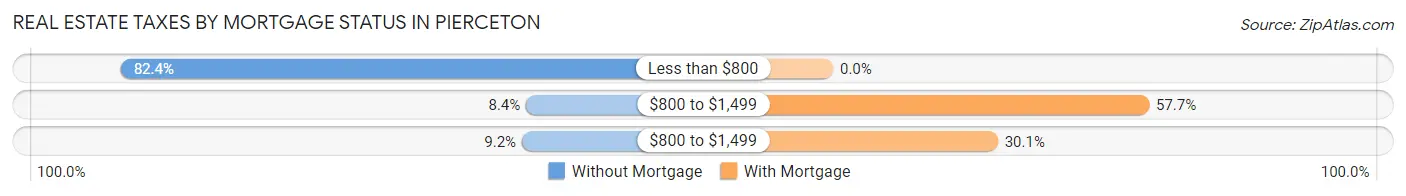
| Property Taxes | Without Mortgage | With Mortgage |
| Less than $800 | 108 (82.4%) | 0 (0.0%) |
| $800 to $1,499 | 11 (8.4%) | 142 (57.7%) |
| $800 to $1,499 | 12 (9.2%) | 74 (30.1%) |
| Total | 131 (100.0%) | 246 (100.0%) |
Health & Disability in Pierceton
Health Insurance Coverage by Age in Pierceton
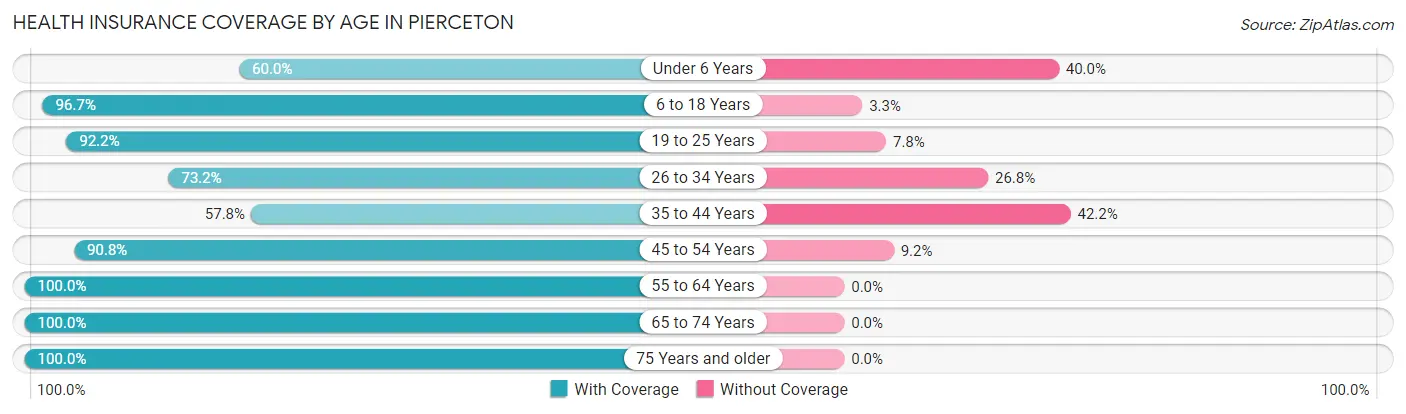
| Age Bracket | With Coverage | Without Coverage |
| Under 6 Years | 45 (60.0%) | 30 (40.0%) |
| 6 to 18 Years | 289 (96.7%) | 10 (3.3%) |
| 19 to 25 Years | 166 (92.2%) | 14 (7.8%) |
| 26 to 34 Years | 112 (73.2%) | 41 (26.8%) |
| 35 to 44 Years | 74 (57.8%) | 54 (42.2%) |
| 45 to 54 Years | 138 (90.8%) | 14 (9.2%) |
| 55 to 64 Years | 142 (100.0%) | 0 (0.0%) |
| 65 to 74 Years | 102 (100.0%) | 0 (0.0%) |
| 75 Years and older | 113 (100.0%) | 0 (0.0%) |
| Total | 1,181 (87.9%) | 163 (12.1%) |
Health Insurance Coverage by Citizenship Status in Pierceton
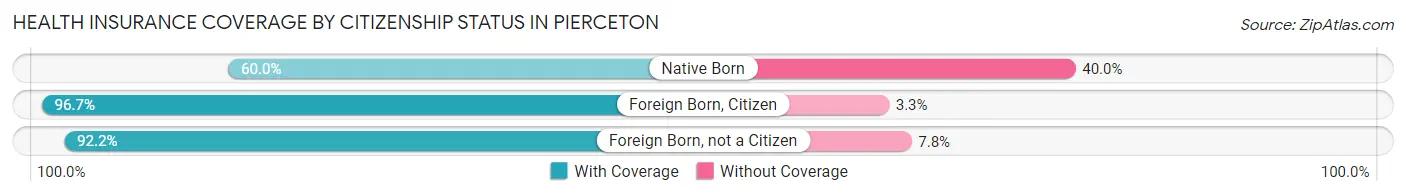
| Citizenship Status | With Coverage | Without Coverage |
| Native Born | 45 (60.0%) | 30 (40.0%) |
| Foreign Born, Citizen | 289 (96.7%) | 10 (3.3%) |
| Foreign Born, not a Citizen | 166 (92.2%) | 14 (7.8%) |
Health Insurance Coverage by Household Income in Pierceton
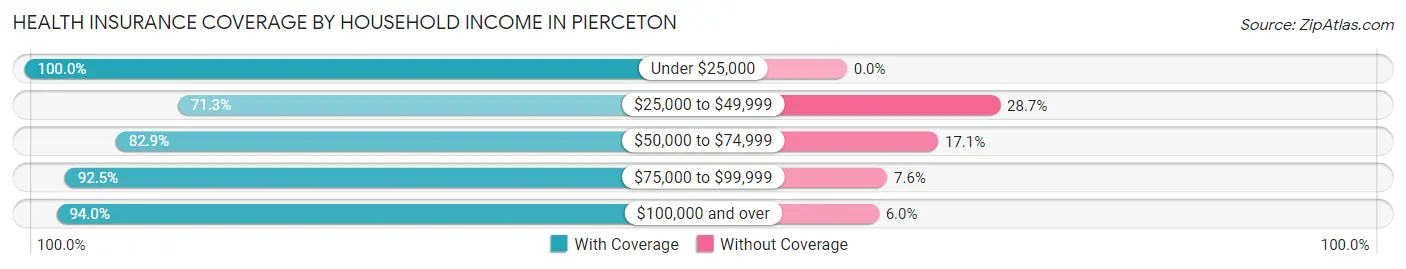
| Household Income | With Coverage | Without Coverage |
| Under $25,000 | 174 (100.0%) | 0 (0.0%) |
| $25,000 to $49,999 | 206 (71.3%) | 83 (28.7%) |
| $50,000 to $74,999 | 165 (82.9%) | 34 (17.1%) |
| $75,000 to $99,999 | 306 (92.4%) | 25 (7.5%) |
| $100,000 and over | 330 (94.0%) | 21 (6.0%) |
Public vs Private Health Insurance Coverage by Age in Pierceton
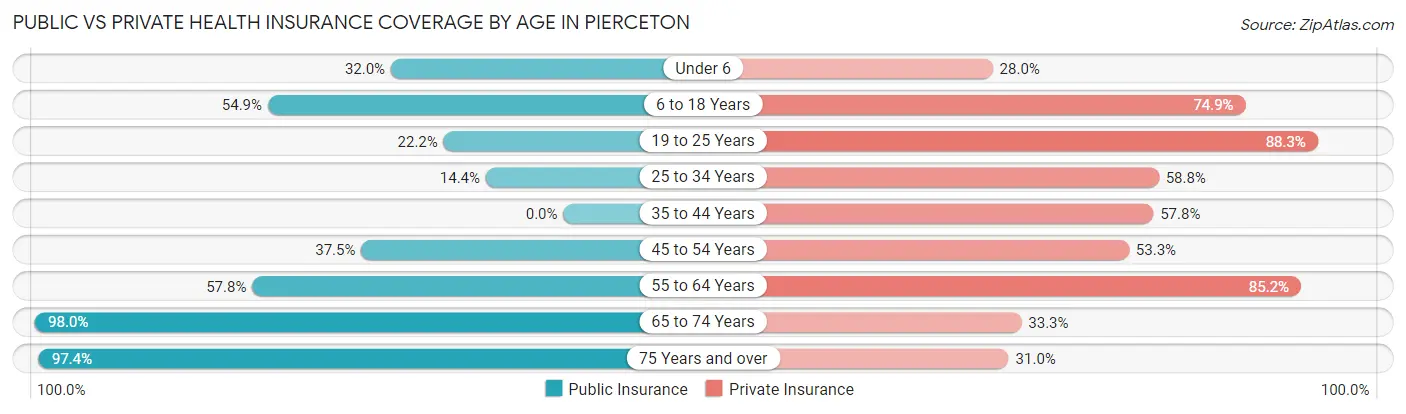
| Age Bracket | Public Insurance | Private Insurance |
| Under 6 | 24 (32.0%) | 21 (28.0%) |
| 6 to 18 Years | 164 (54.8%) | 224 (74.9%) |
| 19 to 25 Years | 40 (22.2%) | 159 (88.3%) |
| 25 to 34 Years | 22 (14.4%) | 90 (58.8%) |
| 35 to 44 Years | 0 (0.0%) | 74 (57.8%) |
| 45 to 54 Years | 57 (37.5%) | 81 (53.3%) |
| 55 to 64 Years | 82 (57.8%) | 121 (85.2%) |
| 65 to 74 Years | 100 (98.0%) | 34 (33.3%) |
| 75 Years and over | 110 (97.4%) | 35 (31.0%) |
| Total | 599 (44.6%) | 839 (62.4%) |
Disability Status by Sex by Age in Pierceton
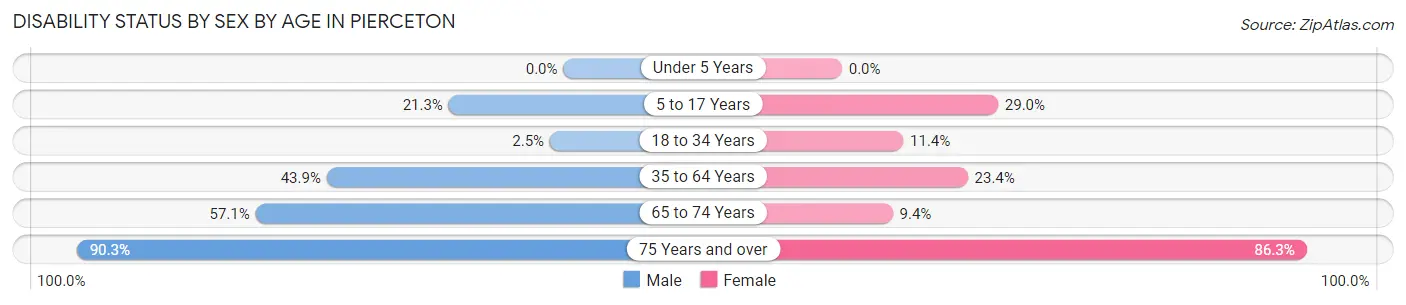
| Age Bracket | Male | Female |
| Under 5 Years | 0 (0.0%) | 0 (0.0%) |
| 5 to 17 Years | 40 (21.3%) | 31 (29.0%) |
| 18 to 34 Years | 6 (2.5%) | 14 (11.4%) |
| 35 to 64 Years | 112 (43.9%) | 39 (23.4%) |
| 65 to 74 Years | 28 (57.1%) | 5 (9.4%) |
| 75 Years and over | 56 (90.3%) | 44 (86.3%) |
Disability Class by Sex by Age in Pierceton
Disability Class: Hearing Difficulty
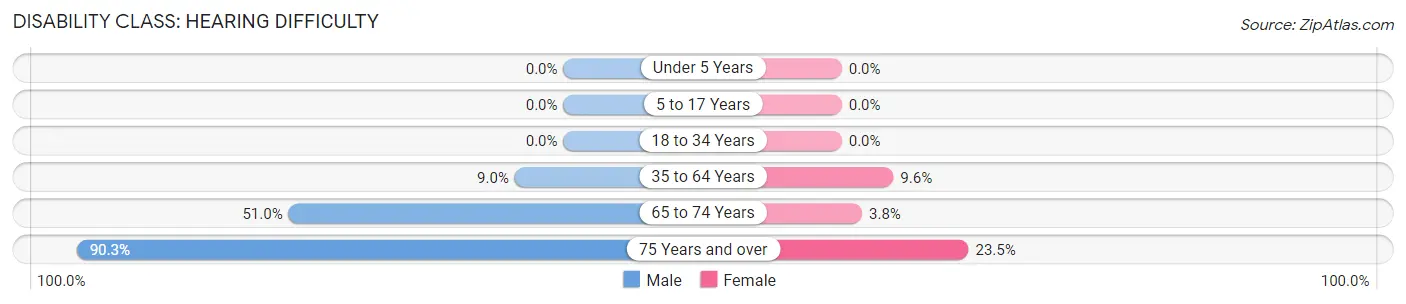
| Age Bracket | Male | Female |
| Under 5 Years | 0 (0.0%) | 0 (0.0%) |
| 5 to 17 Years | 0 (0.0%) | 0 (0.0%) |
| 18 to 34 Years | 0 (0.0%) | 0 (0.0%) |
| 35 to 64 Years | 23 (9.0%) | 16 (9.6%) |
| 65 to 74 Years | 25 (51.0%) | 2 (3.8%) |
| 75 Years and over | 56 (90.3%) | 12 (23.5%) |
Disability Class: Vision Difficulty
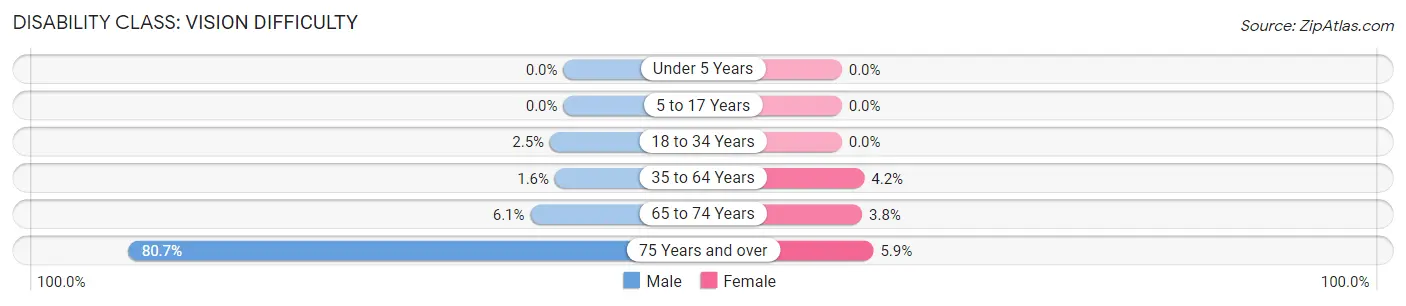
| Age Bracket | Male | Female |
| Under 5 Years | 0 (0.0%) | 0 (0.0%) |
| 5 to 17 Years | 0 (0.0%) | 0 (0.0%) |
| 18 to 34 Years | 6 (2.5%) | 0 (0.0%) |
| 35 to 64 Years | 4 (1.6%) | 7 (4.2%) |
| 65 to 74 Years | 3 (6.1%) | 2 (3.8%) |
| 75 Years and over | 50 (80.6%) | 3 (5.9%) |
Disability Class: Cognitive Difficulty
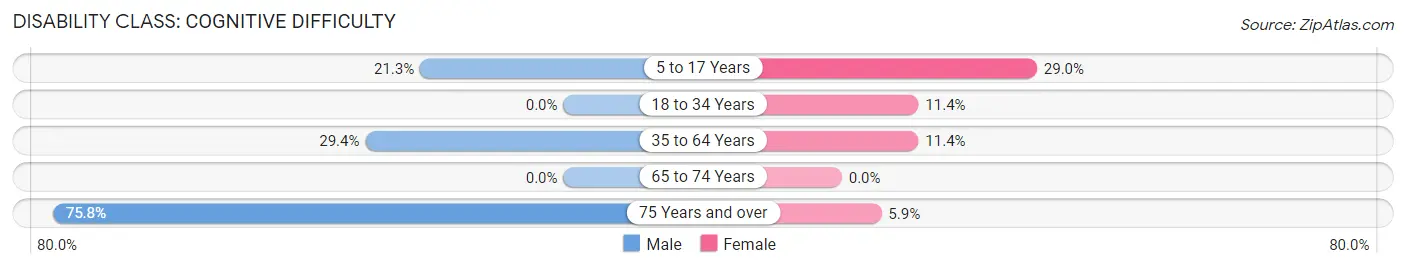
| Age Bracket | Male | Female |
| 5 to 17 Years | 40 (21.3%) | 31 (29.0%) |
| 18 to 34 Years | 0 (0.0%) | 14 (11.4%) |
| 35 to 64 Years | 75 (29.4%) | 19 (11.4%) |
| 65 to 74 Years | 0 (0.0%) | 0 (0.0%) |
| 75 Years and over | 47 (75.8%) | 3 (5.9%) |
Disability Class: Ambulatory Difficulty
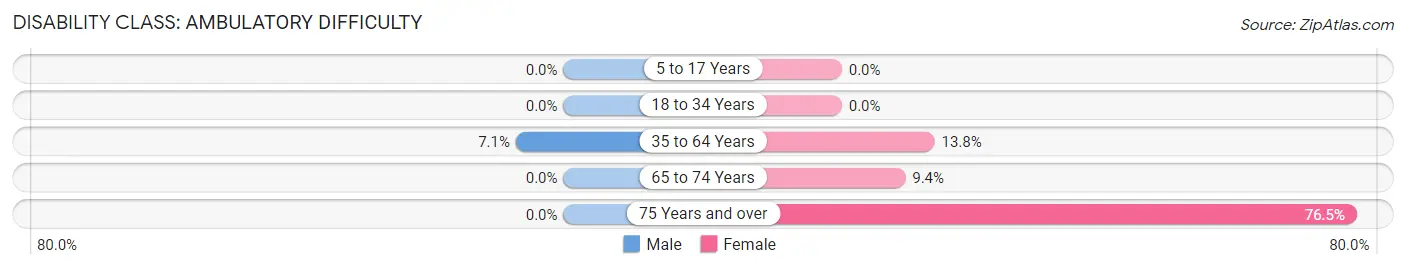
| Age Bracket | Male | Female |
| 5 to 17 Years | 0 (0.0%) | 0 (0.0%) |
| 18 to 34 Years | 0 (0.0%) | 0 (0.0%) |
| 35 to 64 Years | 18 (7.1%) | 23 (13.8%) |
| 65 to 74 Years | 0 (0.0%) | 5 (9.4%) |
| 75 Years and over | 0 (0.0%) | 39 (76.5%) |
Disability Class: Self-Care Difficulty
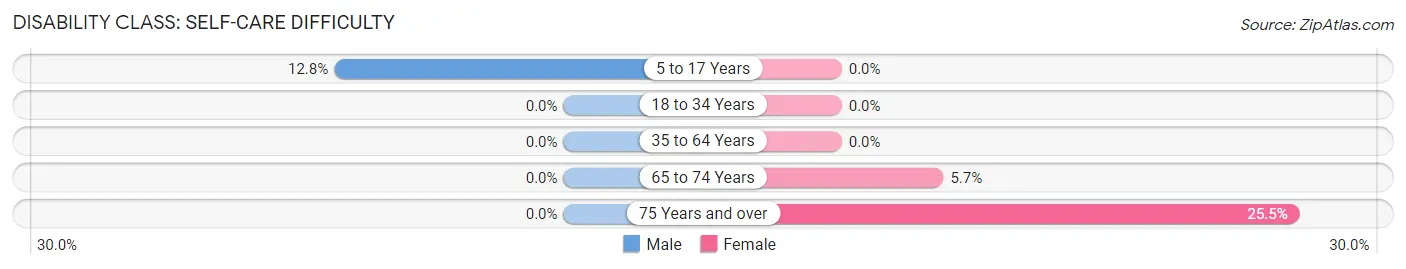
| Age Bracket | Male | Female |
| 5 to 17 Years | 24 (12.8%) | 0 (0.0%) |
| 18 to 34 Years | 0 (0.0%) | 0 (0.0%) |
| 35 to 64 Years | 0 (0.0%) | 0 (0.0%) |
| 65 to 74 Years | 0 (0.0%) | 3 (5.7%) |
| 75 Years and over | 0 (0.0%) | 13 (25.5%) |
Technology Access in Pierceton
Computing Device Access in Pierceton
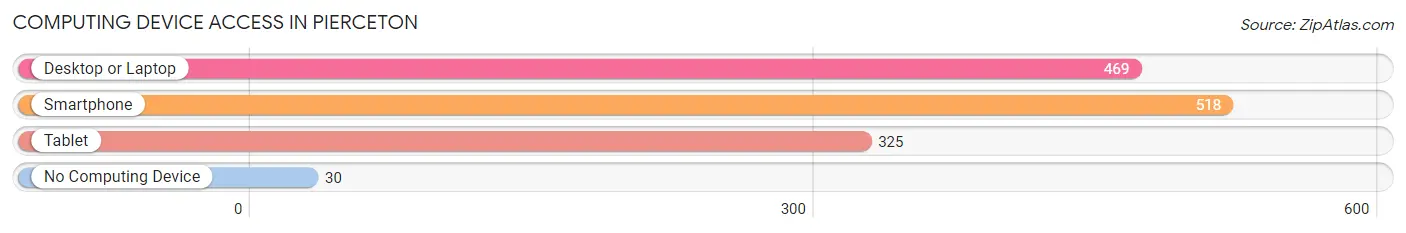
| Device Type | # Households | % Households |
| Desktop or Laptop | 469 | 78.6% |
| Smartphone | 518 | 86.8% |
| Tablet | 325 | 54.4% |
| No Computing Device | 30 | 5.0% |
| Total | 597 | 100.0% |
Internet Access in Pierceton
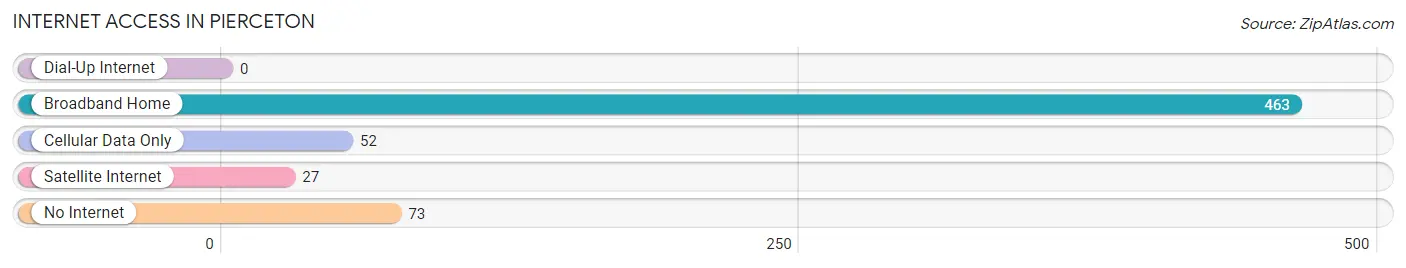
| Internet Type | # Households | % Households |
| Dial-Up Internet | 0 | 0.0% |
| Broadband Home | 463 | 77.5% |
| Cellular Data Only | 52 | 8.7% |
| Satellite Internet | 27 | 4.5% |
| No Internet | 73 | 12.2% |
| Total | 597 | 100.0% |
Pierceton Summary
Pierceton is a small town located in Kosciusko County, Indiana. It is situated in the northern part of the state, about 25 miles east of Fort Wayne. The town has a population of 1,717 people, according to the 2010 census.
History
Pierceton was founded in 1837 by William Pierceton, a settler from Ohio. He purchased the land from the government and began to build a small village. The town was originally called Pierceton Station, as it was a stop on the Wabash and Erie Canal. The canal was an important transportation route in the 19th century, connecting the Great Lakes to the Ohio River.
The town was officially incorporated in 1867. In the late 19th century, Pierceton was a thriving agricultural community. The town was home to several mills, including a flour mill, a sawmill, and a gristmill. The town also had a blacksmith shop, a general store, and a post office.
Geography
Pierceton is located in northern Indiana, about 25 miles east of Fort Wayne. The town is situated in the Tippecanoe River Valley, which is part of the Wabash River watershed. The town is surrounded by rolling hills and farmland. The climate is humid continental, with hot summers and cold winters.
Economy
The economy of Pierceton is largely based on agriculture. The town is home to several farms, which produce corn, soybeans, and wheat. The town also has a few small businesses, including a grocery store, a hardware store, and a restaurant.
Demographics
According to the 2010 census, the population of Pierceton was 1,717. The town is predominantly white, with 92.3% of the population identifying as such. The median household income is $45,938, and the median age is 39.7 years.
Conclusion
Pierceton is a small town located in northern Indiana. It was founded in 1837 and has a population of 1,717 people. The town is situated in the Tippecanoe River Valley and is surrounded by rolling hills and farmland. The economy of Pierceton is largely based on agriculture, and the town is predominantly white.
Common Questions
What is Per Capita Income in Pierceton?
Per Capita income in Pierceton is $29,761.
What is the Median Family Income in Pierceton?
Median Family Income in Pierceton is $53,542.
What is the Median Household income in Pierceton?
Median Household Income in Pierceton is $54,962.
What is Income or Wage Gap in Pierceton?
Income or Wage Gap in Pierceton is 40.5%.
Women in Pierceton earn 59.5 cents for every dollar earned by a man.
What is Inequality or Gini Index in Pierceton?
Inequality or Gini Index in Pierceton is 0.37.
What is the Total Population of Pierceton?
Total Population of Pierceton is 1,344.
What is the Total Male Population of Pierceton?
Total Male Population of Pierceton is 824.
What is the Total Female Population of Pierceton?
Total Female Population of Pierceton is 520.
What is the Ratio of Males per 100 Females in Pierceton?
There are 158.46 Males per 100 Females in Pierceton.
What is the Ratio of Females per 100 Males in Pierceton?
There are 63.11 Females per 100 Males in Pierceton.
What is the Median Population Age in Pierceton?
Median Population Age in Pierceton is 33.6 Years.
What is the Average Family Size in Pierceton
Average Family Size in Pierceton is 2.6 People.
What is the Average Household Size in Pierceton
Average Household Size in Pierceton is 2.2 People.
How Large is the Labor Force in Pierceton?
There are 718 People in the Labor Forcein in Pierceton.
What is the Percentage of People in the Labor Force in Pierceton?
70.0% of People are in the Labor Force in Pierceton.
What is the Unemployment Rate in Pierceton?
Unemployment Rate in Pierceton is 2.5%.